This is a post-peer-review, pre-copyedit version of an article published in International Journal of Advanced Manufacturing Technology. The final authenticated version is available online at:
http://dx.doi.org/10.1007/s00170-015-7889-1 and is licensed under All Rights Reserved license:
Liu, Quan, Yan, Junwei, Pham, Duc Truong, Zhou, Zude, Xu, Wenjun, Wei,
Qing and Ji, Chunqian (2016) Identification and optimal selection of
temperature-sensitive measuring points of thermal error compensation on
a heavy-duty machine tool. International Journal of Advanced
Manufacturing Technology, 85 (1). pp. 345-353.
doi:10.1007/s00170-015-7889-1
Official URL: http://dx.doi.org/10.1007/s00170-015-7889-1 DOI: http://dx.doi.org/10.1007/s00170-015-7889-1
EPrint URI: http://eprints.glos.ac.uk/id/eprint/3051
Disclaimer
The University of Gloucestershire has obtained warranties from all depositors as to their title in the material deposited and as to their right to deposit such material.
The University of Gloucestershire makes no representation or warranties of commercial utility, title, or fitness for a particular purpose or any other warranty, express or implied in respect of any material deposited. The University of Gloucestershire makes no representation that the use of the materials will not infringe any patent, copyright, trademark or other property or proprietary rights.
The University of Gloucestershire accepts no liability for any infringement of intellectual property rights in any material deposited but will remove such material from public view pending investigation in the event of an allegation of any such infringement.
ORIGINAL ARTICLE
Identification and optimal selection of temperature-sensitive
measuring points of thermal error compensation on a heavy-duty
machine tool
Quan Liu1,2&Junwei Yan1,2&Duc Truong Pham3&Zude Zhou1,2&Wenjun Xu1,2&
Qing Wei1,2&Chunqian Ji3
Received: 7 June 2015 / Accepted: 22 September 2015 / Published online: 10 October 2015
#Springer-Verlag London 2015
Abstract Thermal error compensation is considered as an
effective and economic method to improve the machining accuracy for a machine tool. The performance of thermal error prediction mainly depends on the accuracy and robustness of predictive model and the input temperature variables. Selec-tion of temperature-sensitive measuring points is the premise of thermal error compensation. In the thermal error compen-sation scheme for heavy-duty computer numerical control (CNC) machine tools, the identification of temperature-sensitive points still lacks an effective method due to its com-plex structure and heat generation mechanisms. In this paper, an optimal selection method of temperature-sensitive measur-ing points has been proposed. The optimal measurmeasur-ing points are acquired through three steps. First, the degree of tempera-ture sensitivity is defined and used to select the measuring points with high sensitivity to thermal error. Then, the first selected points are classified with fuzzy clustering and grey correlation grade. Finally, the temperature-sensitive measur-ing points are selected with analysis of location of temperature sensors. In order to verify the method above, an experiment is carried out on the CR5116 of flexible machining center. A novel temperature sensor, fiber Bragg grating (FBG) sensor, is used to collect the surface temperature of the machine. A
thermal error compensation model is developed to analyze the prediction accuracy based on four sequences of measuring points, which are generated by different selection approaches. The results show that the number of the measuring points is reduced from 27 to 5 through the proposed selection method, and the thermal error compensation model based on the opti-mum temperature-sensitive measuring points has the best per-formance of prediction effect.
Keywords Temperature-sensitive measuring points . FBG sensors . Heavy-duty machine tools . Thermal errors
1 Introduction
Thermally induced errors and geometric errors are the two main contributors to the inaccuracies on machined workpieces [1]. However, according to the statistics, the thermal errors, caused by internal and external heat sources, account for as much as 70 % of the total workpiece errors in machining [2]. Compared with the geometric error [3], the thermal errors caused by the thermal deformation of the machine structure are time dependent and dynamic. There are many strategies to reduce the thermal errors, such as designing a thermo-symmetric machine with cooling systems, using low-expansion materials, controlling the humidity and temperature of the workshop, and adopting thermal error compensation [4]. Due to the complex heat generation mechanisms and var-ious internal and external heat sources, the thermal errors can-not be eliminated completely in the design stage and the soft-ware compensation method is considered as the most econom-ic and effective way to reduce the thermal error [5].
In general, the research on thermal error compensation in-cludes two parts: the thermal error compensation modeling [1,
2, 6] and the real-time compensation devices [7]. The
* Junwei Yan
1
School of Mechanical Engineering, Wuhan University of Technology, Wuhan 430070, China
2
Key Laboratory of Fiber Optic Sensing Technology and Information Processing, Ministry of Education, Wuhan University of Technology, Wuhan, China
3 School of Mechanical Engineering, University of Birmingham,
Birmingham B15 2TT, UK
Int J Adv Manuf Technol (2016) 85:345–353 DOI 10.1007/s00170-015-7889-1
compensation models are used to predict the thermal error through accurately mapping the empirical relationship be-tween temperature values and thermal errors of the machine tools. However, the temperature measurement and the selec-tion of temperature-sensitive measuring points are the premise of the thermal error compensation models.
In recent years, many research studies have been done on the selection methods of thermal key measuring points. These methods can be categorized into two types accord-ing to their characteristics: mechanism analysis and statis-tics analysis. Mechanism analysis methods concentrate on the generation mechanism of thermal error on machine tools, such as temperature field calculation and displace-ment field analysis. Finite eledisplace-ment method (FEM) [8] and finite difference method (FDM) [9] are two main mecha-nism analysis methods, which are used to analyze the temperature distribution and the deformation at particular points. In the field of statistics analysis, various models and algorithms, such as correlation theory [10,11], grey correlation theory [12,13], neural network [14–16], fuzzy clustering [17–20], partial correlation analysis [21], and stepwise multiple regression analysis [22], have been pro-posed to identify the key temperature measuring points. Liang [23] presented a method using correlation coeffi-cient and multiple linear regressions to identify the key measuring points of a horizontal machine center. Li [12] used the grey system theory to select the optimal measur-ing points and verify the performance of this method. Miao [24] combined the fuzzy clustering and grey corre-lation theory to identify the temperature-sensitive points, and then established the compensation models based on the temperature sequences of these points. Yang [25] pro-posed a grouping method of temperature variables. They were divided into groups based on the correlation coeffi-cient, and then the key points were determined by permu-tation and combination of temperature variables of each group. Miao [26] used a comprehensive analysis method
to identify the temperature-sensitive points, which was a combination of grey correlation, stepwise regression, and fuzzy clustering.
The methods discussed above both have advantages and disadvantages in temperature-sensitive point selec-tion. Due to the complex process of heat transfer and difficulties in determining the boundary condition, the performance of mechanism analysis methods is not good. In statistics analysis areas, correlation coefficient and grey system theory only consider the correlation between the temperature variables and thermal errors, which ignore the coupling problems among temperature variables. Fuzzy clustering theory is used to classify the temperature vari-ables. However, the random selection of threshold makes various results in classification. In order to reduce the coupling and grouping problem, this paper proposes a new method combining the mechanism analysis and sta-tistics analysis to select the optimal temperature measur-ing points.
Section 2 introduces temperature measurement method and chooses initial measurement points. Section 3 proposes a method for selecting temperature-sensitive measuring points. Section 4 describes the experimental setup and evaluates the performance of thermal error compensation based on the se-lected points.
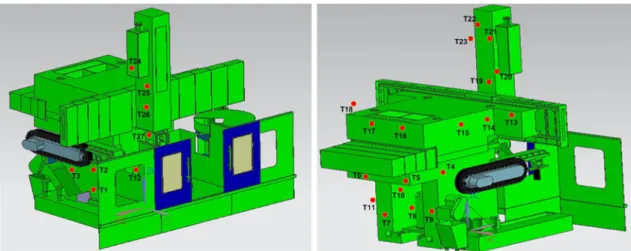
Fig. 1 The deployment of FBG sensors
Table 1 Classification of FBG sensors
Position FBG sensor no. Total
Bed T1, T2, T3, T4, T5, T6, T7, T8, T9, T10 10 Column T13, T14, T15, T16, T17 5 Headstock T19, T20, T21, T22, T23 5
Tool rest T25, T26, T27 3
2 Measurement of surface temperature and thermal
error on heavy-duty CNC machine tool
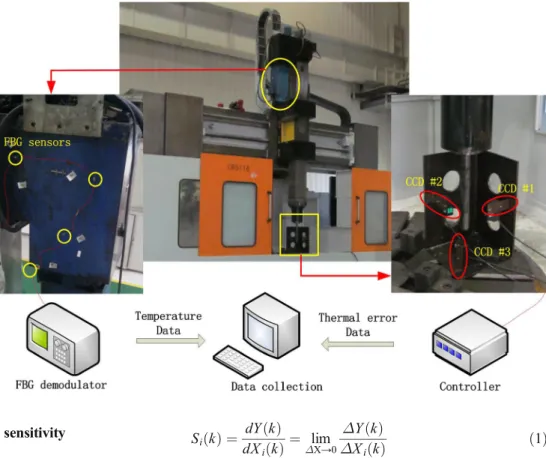
This study was carried out on a CR5116 flexible machin-ing center (FMC). Due to the complex heat generation mechanisms of the machine tools, it is difficult to deter-mine the measuring positions of the machine tools and the numbers of the temperature sensors. The FMC heat sources, causing the thermal errors, always come from two main aspects, internal and external sources. The in-ternal sources mainly include the heat generated by spin-dle motor, spinspin-dle bearing, ball screw system, cool sys-tem, etc. The external ones are from sunlight, heater, and personal radiations. All these heat sources will affect the temperature field distribution and cause the heat defor-mation and relative displacement of components on the machine tool. In order to monitor the thermal behavior of the FMC, 27 measuring points were selected according to the main heat sources, such as headstock, drive motor, ball screw, and environmental temperature. In this paper, fiber Bragg grating (FBG) sensors [27,28] were used to collect the surface temperature data of FMC. Compared with PT100 platinum resistance sensors, FBG sensors have the advantages in temperature measurement on the heavy-duty machine tools, such as easy deployment, anti-electromagnetic property, and small size. In this ex-periment, FBG sensors were attached on the surface of the FMC. Figure 1 shows the details of the temperature measuring points and locations of FBG sensors. The FBG sensors can be divided into five groups according to their locations, as shown in Table1.
The other parameters to be collected are the thermal errors of the spindle in theX,Y, andZdirections. Three CCD laser displacement sensors were used to measure the thermal drifts of the spindle in the three directions.
3 Temperature-sensitive measuring points selection
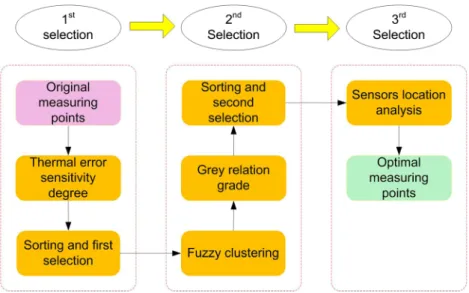
In this section, we introduce the method for temperature-sensitive measuring point selection, which is based on corre-lation analysis, correcorre-lation analysis, temperature sensitivity analysis, and fuzzy clustering.As shown in Fig.2, the processes of optimal selection for temperature measuring points can be divided into three parts. In the first selection, the temperature variables will be sorted according to the degree of thermal error sensitivity and gen-erated a new sequence. The measuring points in the first half of the sequence are chosen for further analysis. In the second selection, the grey relation grades between the first selected measuring points and thermal errors are calculated and then these measuring points will be classified into different groups using fuzzy clustering. The second selected sequence of mea-suring points will be achieved by choosing the point with maximum grey relation grade in each group. In the third se-lection, the second selected sequence will be analyzed by combining with the location of sensors. Through the three steps, the temperature-sensitive measuring points are identi-fied. The definitions and algorithms used in the three selec-tions are described as below.
Fig 2 The processes of temperature-sensitive measuring point selection
Fig 3 Fuzzy clustering processes
3.1 Definition of thermal error sensitivity
In order to facilitate the analysis and description, the thermal error and temperature data sets can be represented as y={y(k)|k=1,2,…,m} and xi={xi(k)|k=1,2,…,m;i=1,2,…,
n} separately, in whichnmeans the number of temperature measuring points andkis the sample size.
The thermal error sensitivity represents the impact degree of temperature changes on thermal errors. The coefficient of thermal error sensitivity is defined as
Sið Þ ¼k dY kð Þ dXið Þk ¼ lim ΔX→0 ΔY kð Þ ΔXið Þk ð1Þ AsΔXimight be zero in different measuring points, it is
much easier to calculate the reciprocal ofSi, which isSi1ð Þk ≈
ΔXið Þk
ΔY ð Þk . The degree of thermal error sensitivityGiwill be
calculated as Eq. (2), in whichðΔXið Þk
ΔY kð ÞÞpresents the average
value ofΔXið Þk
ΔY kð Þ:
Fig. 4 Temperature and thermal error collection system
0 500 1000 1500 2000 2500 3000 3500 4000 4500 -20 -15 -10 -5 0 5 10 15 Time(m) T h e rm a l-e rrors (u m )
Thermal errors in XYZ direction
X Y Z
Fig. 5 Comparison of thermal errors in XYZ directions
Gi¼ 1 Di ¼ ffiffiffiffiffiffiffiffiffiffiffiffiffiffiffiffiffiffiffiffiffiffiffiffiffiffiffiffiffiffiffiffiffiffiffiffiffiffiffiffiffiffiffiffiffiffiffiffiffiffiffiffiffiffiffiffiffiffiffi1 Xm k¼1 ΔXið Þk ΔY kð Þ− ΔXið Þk ΔY kð Þ !2 v u u t ð2Þ
The value ofGiis bigger, the more sensitive the
tempera-ture measuring point is.
3.2 Grey correlation analysis
Grey system theory presented by Deng [29] aims to evaluate the relationship of a series of data through analyzing the geo-metric similarity of the data curves. The grey correlation grade indicates the close degree between two series, which is calcu-lated by grey correlation coefficient. In this study, we assume the original sequence and the sequence for comparison as y={y(k)|k=1,2,…,m} and xi={xi(k)|k=1,2,…,m;i=1,2,…,
n} separately. In the grey system theory, the grey correlation coefficient is defined as
ξ0ið Þ ¼k
ΔminþρΔmax
Δ0ið Þ þk ρΔmax
ð3Þ whereρis the distinguishing coefficient and it is taken as 0.5 in general.Δ0i(k) is defined asΔ0i(k)=|x0(k)−xi(k)|.Δminand
Δmaxmean the minimum and maximum ofΔ0i(k), which are
defined as Δmin¼min
i mink Δ0ið Þk and Δmax¼min
i mink Δ0ið Þk . The grey correlation grade is
de-fined as γ0i¼ 1 m Xm k¼1 ξ0ið Þk ð4Þ
3.3 Fuzzy clustering analysis
Fuzzy clustering is used to establish the fuzzy relationship among temperature variables. The temperature variables will be classified based on a specific threshold. As shown in Fig.3, there are five main steps in fuzzy clustering analysis, which are normalization, correlation coefficient calculation, estab-lishment of fuzzy similarity matrix, threshold determining, and variables classification:
1.Data normalization aims to increase the cohesion of entity types and reduce the data redundancy. We use variablecas a normalized value ofx, which is calculated as
cið Þ ¼k xi k ð Þ
maxjxið Þk j
ð5Þ
2.Fuzzy similarity matrix is defined asR=(rij)n×n, constructed
by the relation coefficientrij. Therijdescribes the linear
rela-tionship betweenciandcjand is calculated as
ri j¼ Xm k¼1 cið Þ−k cið Þk cjð Þ−k cjð Þk ffiffiffiffiffiffiffiffiffiffiffiffiffiffiffiffiffiffiffiffiffiffiffiffiffiffiffiffiffiffiffiffiffiffiffiffiffiffiffiffiffiffiffiffiffiffiffiffiffiffiffiffiffiffiffiffiffiffiffiffiffiffiffiffiffiffiffiffiffiffiffiffiffiffiffiffi Xm k¼1 cið Þ−k cið Þk 2Xm k¼1 cjð Þ−k cjð Þk 2 v u u t ð6Þ
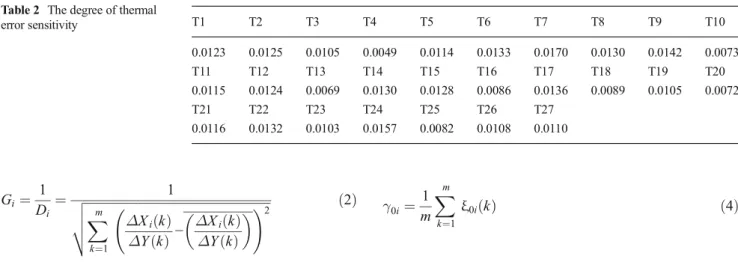
Table 2 The degree of thermal
error sensitivity T1 T2 T3 T4 T5 T6 T7 T8 T9 T10 0.0123 0.0125 0.0105 0.0049 0.0114 0.0133 0.0170 0.0130 0.0142 0.0073 T11 T12 T13 T14 T15 T16 T17 T18 T19 T20 0.0115 0.0124 0.0069 0.0130 0.0128 0.0086 0.0136 0.0089 0.0105 0.0072 T21 T22 T23 T24 T25 T26 T27 0.0116 0.0132 0.0103 0.0157 0.0082 0.0108 0.0110
Fig. 6 The fuzzy equivalence matrix
wherecið Þk and cjð Þk mean the average value of sequence ci(k) andcj(k).
3.As the fuzzy similarity matrixR=(rij)n×nis not transitive, a
fuzzy equivalence matrix should be created for variables clas-sification. We assumet(R) as the fuzzy equivalence of R. If there exists an integerl, which satisfiesR2l=R2l+1, then the fuzzy equivalence matrix can be defined ast(R)=R2l.
4.Threshold determining is the last step before classification. The value of the thresholdλdirectly determines the result of variables classification. So the temperature variables will be classified into different groups with different thresholds. In this research,λis determined by the number of temperature variables. For example, if the amount of temperature variables isn, the thresholdλwill be chosen, when the number of classified groups is aroundn/2.
4 Example verification
4.1 Experiment setup
An experiment was designed to identify the temperature-sensitive measuring points on a flexible manufacturing center CR5116. Based on the temperature data collected from the measuring points, thermal errors compensation model was developed to analyze the feasibility and performance of the method for key measuring points selection.
Figure4shows the temperature and thermal errors collec-tion based on FGB sensors and CCD laser displacement sen-sors. There were 27 FBG sensors deployed on the surface of
FMC, as shown in Fig.1. Three CCD sensors were used to measure the thermal errors ofX,Y, andZdirection of spindle. The experiment lasted for 3 days with air cutting, which means that the FMC run without implementing real cutting process and the measuring system collected data per minute, including temperature values and the spindle thermal errors. The collected data were divided into three groups according to the date: data01, data02, and data03. The first group was used to select the temperature-sensitive measuring points. The sec-ond and the third ones were used to verify the effectiveness and robustness of the thermal error compensation model based on the selected points. Figure5shows the thermal errors ofX, Y, and Zdirections of spindle. It is obvious that the biggest change of the thermal error happened inYdirections. So the thermal error in Y direction was only considered in the experiment.
4.2 Temperature-sensitive measuring points selection
As discussed in Sect.3, an integrated method can be used to select the temperature-sensitive points. In this paper, data01 was considered as the original data set for identification of the measuring points. Based on the processes in Fig.2, the simu-lation results of each step were obtained using Matlab, which were listed as below:
1. According to the Eq. (2), the degrees of thermal error sensitivity for the 27 measuring points were calculated. Table2shows the results of each measuring point.
The first selection of temperature-sensitive measuring points was made based on the degrees of thermal error
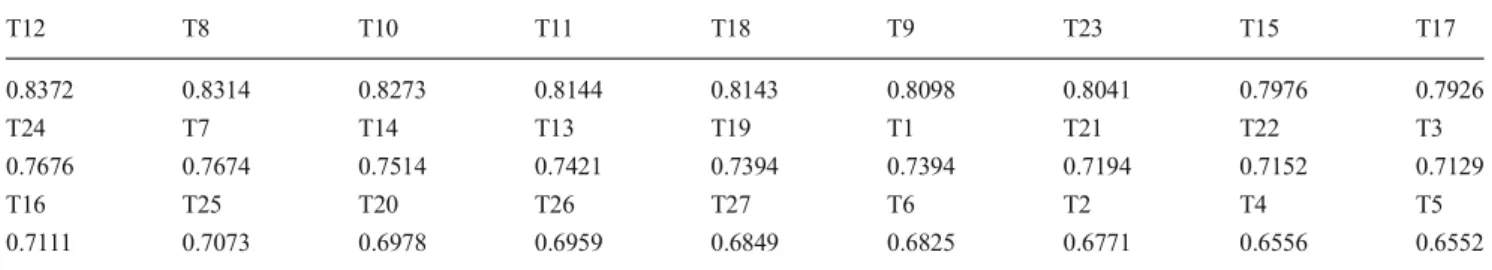
Table 3 The grey correlation grades between temperature variables and thermal errors
T12 T8 T10 T11 T18 T9 T23 T15 T17 0.8372 0.8314 0.8273 0.8144 0.8143 0.8098 0.8041 0.7976 0.7926 T24 T7 T14 T13 T19 T1 T21 T22 T3 0.7676 0.7674 0.7514 0.7421 0.7394 0.7394 0.7194 0.7152 0.7129 T16 T25 T20 T26 T27 T6 T2 T4 T5 0.7111 0.7073 0.6978 0.6959 0.6849 0.6825 0.6771 0.6556 0.6552
Table 4 Classifications of measuring points with different thresholds
Threshold Classification Second selection of temperature variables
i. ii. iii. iv. v. vi. vii. viii
λ=0.8996 T1 T7 T8 T9 T11 T12 T15 T18, T22 T2 T6 T14 T23 T25 T2 T6 T12 T14 T23 T25 λ=0.9017 T1 T8 T9 T11 T12 T15 T18 T22 T2 T6 T7 T14 T23 T25 T2 T6 T7 T12 T14 T23 T25 λ=0.9095 T1 T8 T9 T11 T12 T15 T18 T2 T6 T7 T14 T22 T23 T25 T2 T6 T7 T12 T14 T22 T23 T25
sensitivity. First, the temperature measuring points were sorted by the values shown in Table2. Then, the top 14 points were selected for further analysis. So T1, T2, T6, T7, T8, T9, T11, T12, T14, T15, T18, T22, T23, and T25 were selected and others were abandoned.
2.The 14 primary points were classified into different groups with fuzzy clustering algorithms. The first step was the calcu-lation of fuzzy equivalence matrixt(R). By following Eq. (6), t(R) was calculated and shown in Fig.6. The second one was threshold (λ) selection, which was determined by the number of primary points and the classification of measuring points. The goal of this step was to reduce by around half the amount of primary variables. As the number of primary points was 14, the temperature variables could be divided into six, seven, and eight groups with different thresholds. The third step was cal-culation of grey correlation grades between temperature vari-ables and thermal errors. The results were sorted and shown as Table3. The final step was selecting temperature variables in each classification. The point with max value of grey
correlation grade was selected in each group. Three tempera-ture variables sequences were achieved, which were r1=[T2 T6 T12 T14 T23 T25], r2=[T2 T6 T7 T12 T14 T23 T25], and r3=[T2 T6 T7 T12 T14 T23 T25], as shown in Table4.
3. The third selection was based on the positions of FBG sensors. As shown in Table 1, the temperature measuring points were divided into five groups. Only one measuring point was chosen in each group. In order to eliminate coupling among temperature variables, the one with maximum value of grey correlation grade was selected. Based on r1, r2, and r3, the new sequences of measuring points were got, which were e 1 = [ T 6 T 1 2 T 1 4 T 2 3 T 2 5 ] a n d e 2 = e3=[T7 T12 T14 T23 T25]. According to Table3, the grey correlation grade of T7 was larger than that of T6, so we chose e2 or e3 as the optimal measuring points.
4.3 Models of thermal error compensation
In order to evaluate the performance of the method for mea-suring point selection, a thermal error prediction model was designed based on the multi-linear regression (MLR). In the experiment, MLR, as a statistical technique, was used to pre-dict thermal error through several temperature variables. Da-ta01 was used to establish the thermal error prediction model. T7, T12, T14, T23, and T25 were selected to establish regress equation. We assumedx7,x12,x14,x23, andx25as the temper-ature variables of the selected points. The prediction model was calculated as below:
y ¼ 6:5263x7þ 5:1961x12þ 0:1227x14
þ 4:5709x23− 4:9635x25þ 14:1779 ð9Þ Data02 and data03 were used to analyze the prediction accuracy. The fitting accuracy for data0201 is shown in 0 100 200 300 400 500 600 700 -8 -6 -4 -2 0 2 4 6 8 Time(m) Y -t h e rm a l e rro r (u m ) Original-error Predictive-error Residual-error
Fig. 7 The fitting accuracy of data0201
0 100 200 300 400 500 600 700 800 900 10001100120013001400 -20 -18 -16 -14 -12 -10 -8 -6 -4 -2 0 2 4 Time(m)
Y-thermal error (um)
Original-error Predictive-error Residual-error 0 100 200 300 400 500 600 700 800 900 10001100120013001400 -14 -12 -10 -8 -6 -4 -2 0 2 4 6 8 Time(m)
Y-thermal error (um)
Original-error Predictive-error Residual-error
(a)
The predictive effect of Data0202(b)
The predictive effect of Data0203 Fig. 8 Analysis of predictive effectsFig.7, and the predictive effects of the two batches are shown in Fig.8.
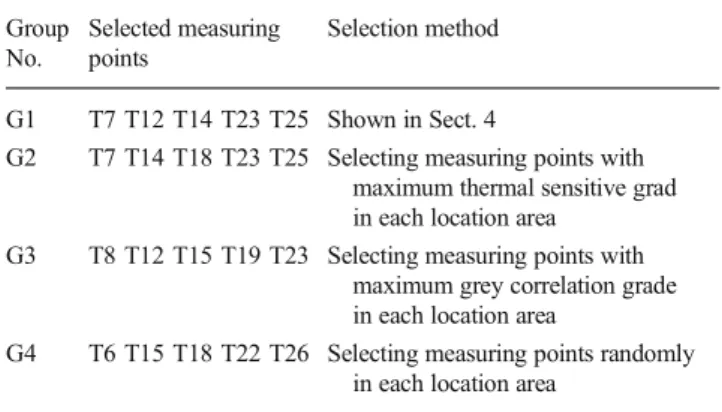
In order to compare the performance of the compensation model with different temperature variables, four measuring point sequences (G1, G2, G3, and G4) were chosen based on different selection methods.
As shown in Table1, the measuring points were divided into five groups according to their location. G2 consisted of the measuring points with maximum degree of temperature sensitivity in each group. G3 selected the measuring points with maximum grey correlation grade with thermal errors in each group. G4 concluded the measuring points, selected ran-domly in each group. The details of the sequences are shown in Table5, and the predictive performance based on each sequences of measuring points is shown in Table6.
From the Table6, we can see that the mean error of G1, G2, and G3 was much smaller than that of G4. The max error of G4 is bigger than the original max error, which means that G4 cannot be used to predict the thermal error. Through
comparison of the four groups in terms of mean error, standard error, and max error, G1 had the best performance of thermal error prediction and the predictive thermal error was reduced by 79.42 %.
5 Conclusion
In this paper, FBG sensors have been used to collect the sur-face temperature of a heavy-duty machine tool. A new method of temperature-sensitive measuring point selection consists of three steps. The first step defines the degree of temperature sensitivity, and the primary measuring points are achieved according to the degree of temperature sensitivity. The second step combines grey theory with fuzzy clustering. In this step, the first selected measuring points are classified with fuzzy clustering. The second selected measuring points are chosen with comparison of grey grade for each temperature variable. Finally, the last step aims to select the optimal temperature measuring points by considering the locations of FBG sensors.
An experiment was carried out on a flexible machining center CR5116 to verify the method. By using the three selec-tions, the temperature-sensitive points were identified. The number of measuring points was reduced from 27 to 5. Based on these measuring points, a thermal error prediction model was built to analyze the performance of the method for temperature-sensitive point selection. The experiment result based on data0202 shows that the average predictive residual error was reduced to 1.6 μm and the maximum predictive residual thermal error was less than 5.3μm. In order to further demonstrate the effectiveness of the point selection method, three other methods were used to create three different mea-suring point sequences. Then, a comparison was made among four thermal prediction models using data02 and data03, which were based on four measuring point sequences. The result shows that the prediction model with the temperature-sensitive points, selected by the method proposed in this pa-per, had the best performance of predictive accuracy.
Acknowledgments This research is supported by the National Natural Science Foundation of China (Grant No. 51475343), the International Science & Technology Cooperation Program of China (Grant No. 2015DFA70340), and Wuhan International Science and Technology Co-operation Project (Grant No. 2014030709020306).
References
1. Li ZH, Yang JG, Fan KG, Zhang Y (2015) Integrated geometric and thermal error modeling and compensation for vertical machining centers. Int J Adv Manuf Technol 76:1139–1150
2. Mayr J, Jedrzejewski J, Uhlmann E, Donmez MA, Knapp W, Härtig F, Wendt K, Moriwaki T, Shore P, Schmitt R, Brecher C,
Table 5 Measuring points sequences based on different selection models Group No. Selected measuring points Selection method G1 T7 T12 T14 T23 T25 Shown in Sect. 4
G2 T7 T14 T18 T23 T25 Selecting measuring points with maximum thermal sensitive grad in each location area
G3 T8 T12 T15 T19 T23 Selecting measuring points with maximum grey correlation grade in each location area
G4 T6 T15 T18 T22 T26 Selecting measuring points randomly in each location area
Table 6 Predictive effect comparison among four measuring points sequences
Data0202
Group no. Mean error Std. error Max error Original value 11.1940 2.4323 16.1076 G1 Residual error 1.6003 1.9288 5.2796 G2 Residual error 1.4309 1.7552 5.0765 G3 Residual error 2.0735 2.0018 6.3235 G4 Residual error 4.4308 2.4857 11.4625 Data0203
Group no. Mean error Std. error Max error Original value 5.8659 6.1626 10.0394 G1 Residual error 1.2073 1.9288 4.2989 G2 Residual error 1.9640 1.5568 5.3708 G3 Residual error 1.3859 1.3793 4.7506 G4 Residual error 8.8911 3.5468 15.0949
Würz T, Wegener K (2012) Thermal issues in machine tools. CIRP Ann Manuf Technol 61:771–791
3. Ramesh R, Mannan MA, Poo AN (2000) Error compensation in machine tools—a review: Part I: geometric, cutting-force induced and fixture-dependent errors. 40:1257–1284
4. Ramesh R, Mannan MA, Poo AN (2000) Error compensation in machine tools—a review: Part II: thermal errors. Int J Mach Tools Manuf 40:1257–1284
5. Postlethwaite SR, Allen JP, Ford DG (1999) Machine tool thermal error reduction—an appraisal. Proc Inst Mech Eng B J Eng Manuf 213:1–9
6. Jiang H, Fan KG, Yang JG (2014) An improved method for ther-mally induced positioning errors measurement, modeling, and com-pensation. Int J Adv Manuf Technol 75:1279–1289
7. Cui G, Lu Y, Gao D, Yao YX (2012) A novel error compensation implementing strategy and realizing on Siemens 840D CNC sys-tems. Int J Adv Manuf Technol 61:595–608
8. Kim SK, Cho DW (1997) Real-time estimation of temperature dis-tribution in a ball screw system temperature. Int J Mach Tools Manuf 37:451–464
9. Mayr J, Weikert S, Wegener K (2007) Comparing the thermo-mechanical-behavior of machine tool frame designs using a FDM-FEA simulation approach. Proc 22nd ASPE Annu Meet 17–20
10. Zhang T, Ye WH, Liang RJ, Lou PH, Yang XL (2013) Temperature variable optimization for precision machine tool thermal error com-pensation on optimal threshold. Chin J Mech Eng 26:158–165 11. Lee J-H, Yang S-H (2002) Statistical optimization and assessment
of a thermal error model for CNC machine tools. Int J Mach Tools Manuf 42:147–155
12. Li YX, Yang JG, Gelvis T, Li YY (2008) Optimization of measur-ing points for machine tool thermal error based on grey system theory. Int J Adv Manuf Technol 35:745–750
13. Yan JY, Yang JG (2009) Application of synthetic grey correlation theory on thermal point optimization for machine tool thermal error compensation. Int J Adv Manuf Technol 43:1124–1132
14. Liang RJ, Ye WH, Zhang HH, Yang QF (2012) The thermal error optimization models for CNC machine tools. Int J Adv Manuf Technol 63:1167–1176
15. Zhang Y, Yang JG, Jiang H (2012) Machine tool thermal error modeling and prediction by grey neural network. Int J Adv Manuf Technol 59:1065–1072
16. Yang H, Ni J (2005) Dynamic neural network modeling for nonlin-ear, nonstationary machine tool thermally induced error. Int J Mach Tools Manuf 45:455–465
17. Han J, Wang LP, Cheng NB, Wang HT (2012) Thermal error modeling of machine tool based on fuzzy c-means cluster analysis and minimal-resource allocating networks. Int J Adv Manuf Technol 60:463–472
18. Wang HT, Wang LP, Li TM, Han J (2013) Thermal sensor selection for the thermal error modeling of machine tool based on the fuzzy clustering method. Int J Adv Manuf Technol 121–126
19. Abdulshahed AM, Longstaff AP, Fletcher S, Myers A (2015) Thermal error modelling of machine tools based on ANFIS with fuzzy c-means clustering using a thermal imaging camera. Appl Math Model 39:1837–1852
20. Lee J, Lee J, Yang S (2001) Development of thermal error model with minimum number of variables using fuzzy logic strategy. 15: 1482–1489
21. Fan ZL, Li ZH, Yang JG (2010) NC machine tool tempera-ture measuring point optimization and thermal error model-ing based on partial correlation analysis. China Mech Eng 21:2025–2028
22. Chen C, Zhang CY, Chen H (2011) Selection and modeling of temperature variables for the thermal error compensation in servo system. In: Electron. Meas. Instruments (ICEMI), 2011 10th Int. Conf. on. IEEE. pp 220–223
23. Liang RJ, Ye WH, Luo W, Yu H, Yang Q (2011) Identification of the key thermal points on machine tools by grouping and optimiz-ing variables. 18:87–93
24. Miao EM, Gong YY, Niu PC, Ji CZ, Chen HD (2013) Robustness of thermal error compensation modeling models of CNC machine tools. Int J Adv Manuf Technol 69:2593–2603
25. Yang JG, Deng WG, Ren YQ, Li YS, Dou XL (2004) Grouping optimization modeling by selection of temperature variables for the thermal error compensation on machine tools. 6–9
26. Miao EM, Gong YY, Dang LC, Miao JC (2014) Temperature-sensitive point selection of thermal error model of CNC machining center. Int J Adv Manuf Technol 74:681–691
27. Zhou ZD, Liu Q, Ai QS, Xu C (2011) Intelligent monitoring and diagnosis for modern mechanical equipment based on the integra-tion of embedded technology and FBGS technology. Meas J Int Meas Confed 44:1499–1511
28. Zhou ZD, Jiang DS, Zhang DS (2009) Digital monitoring for heavy duty mechanical equipment based on fiber Bragg grating sensor. Sci China, Ser E Technol Sci 52:285–293
29. Deng JL (1989) Introduction to grey system theory. J of grey Syst 1: 1–24