A description of the electricity system in
Spain since 2005 and the economic potential
for renewable energy technologies
by
Javier Izquierdo-Millan
A thesis
presented to the University of Waterloo in fulfilment of the
thesis requirement for the degree of Master of Applied Science
in
Civil Engineering
Waterloo, Ontario, Canada, 2014 © Javier Izquierdo-Millan 2014
Declaration
I hereby declare that I am the sole author of this thesis. This is a true copy of the thesis, including any required final revisions, as accepted by my examiners.
Abstract
The energy system in Spain can be characterized as being high energy intensive when compared to the rest of Europe and because of its high dependence on imported resources (around 84%). The focus of this document is to explore a novel approach to describe, as part of this energy system, the electricity system in Spain since 2005 and the economic potential for renewable energy technologies (RET) to replace the electricity generated from fossil resources by 2050. The heart of the design and implementation of any RET policy should be the reduction or elimination of fossil fuel dependency.
This document aims at describing the evolution of the Spanish electricity system in the last decade, and addressing the possible influence of certain factors in the design and implementation of the electricity system by using modern modeling technologies to evaluate the potential of RET. This will represent a novel approach to bridge the results from modeling technologies to policy makers. To ensure the credibility and reliability of the data researched, validation criteria has been used which includes the accuracy of information, the content (whether factual or opinion), time (limited to certain periods), format (validity of internet sources, journals, etc), authority (reputable authors and sources), objective reasoning, currency and links to other resources, and the quality of writings and its review among others.
The proposed research approach follows a methodology where the first step is to understand the electricity system in Spain, followed by the definition of the model of interest (optimization models) and the design of three different scenarios (Business as Usual, FIT and High fossil prices) for the evaluation of the potential of RET, finishing with the analysis of the results from the model and data collected from the perspectives of what has been done in previous RET policies and plans, and the possible influence of factors such as organizations and corporations on those policies and plans.
The results obtained from the model are analysed and compared to the Business as Usual scenario. The amount of electricity generated from fossil resources and to be replaced by RET is calculated using the scenarios, as well as the evolution of primary energy, imports, final energy consumptions and CO2 emissions.
In order to test the applicability of this approach, the results of the model have been compared with the current situation of the Spanish electricity system. Calculations using capacity factors of the RET and their share in the current electricity generation are performed in order to identify the final amount of power (MW) to be installed in order to replace the electricity generated (GWh) by fossil resources by 2050. Based on the conclusions, RET has the potential to replace the generation of electricity from fossil fuels but improvements in the efficiency of RET will be needed. In addition, it is recommended that significant considerations in RET policy like the energy and electricity systems should be a strategic component of the Spanish policy system, be done in order to set the Spanish electricity system in a more sustainable path.
Acknowledgements
I would like to express my special appreciation and thanks to my supervisors Professor Jatin Nathwani and Professor David Fuller, who have been tremendous mentors for me. I would like to thank you for encouraging my research and for allowing me to grow as a research scientist. Your support and guidance have been incredible and without your extensive expertise, knowledge and kindness, this document would not have been possible.
I would also like to thank my readers Professor Ian Rowlands and Associate Professor Monica Emelko for serving as readers and for your brilliant comments, suggestions and valuable feedback.
I would especially like to thank Dr. Helena Cabal and Dr. Maryse Labriet for their academic and continued support and assistance over this past year.
A special thanks to my family. Words cannot express how grateful I am to my wonderful wife and children, Grace, Gabriel and David, for their love and inspiration and for all of the sacrifices that you have made on my behalf.
At the end I would like to express appreciation to my beloved wife Grace who I spent sleepless nights with and was always my support in the moments when there was no one to answer my queries. I love you and admire you, and you gave me the courage and strength needed to continue with this. Without your support, this document would not have been possible. I dedicate this document to you.
Table of Contents
List of Figures ... vii
List of Tables ... x
List of Abbreviations ... xii
1. Introduction ... 1
2. RET in Spain ... 6
2.1. RET plans and RET in Spain ... 6
2.2. Renewable policies in Spain ... 7
2.3. CO2 emissions and contribution of RET ... 11
3. Framework of the PER... 13
3.1. Regulatory overview ... 13
3.2. Targets of the PER ... 14
3.3. Financing ... 17
3.4. Policy tools ... 19
3.5. Results of the PER... 21
3.5.1. Main results ... 21
3.5.2. Achievements of the RET ... 25
3.5.3. Investments of the RET ... 27
3.5.4. Premiums of the RET... 28
4. A review of the Spanish electricity system ... 30
4.1. Possible factors influencing electricity plans ... 30
4.1.1. Influence from corporations ... 30
4.1.2. Evolution of regulations and its relationship to corporations ... 36
4.1.3. The “revolving doors” effect ... 41
4.1.4. Considerations of influences ... 44
4.2. Current situation of the Spanish electricity system ... 47
5. Application of the TIMES-IB model to the Spanish energy system ... 66
5.1. The Times model generator... 67
5.2. The Times-IB model ... 73
6. Results ... 81
6.1. Primary energy ... 81
6.2. Final energy consumption ... 84
6.3. Primary energy-Imports ... 85
6.4. Electricity generation ... 86
6.5. Electricity generation-fossil resources ... 88
6.6. CO2 emissions... 89
6.7. Summary ... 90
7. Analysis... 93
7.1. Analysis of the PER ... 93
7.2. Understanding the Spanish electricity system ... 100
8. Conclusions and recommendations... 111
8.1. Conclusions ... 111
8.2. Recommendations ... 115
9. Further work... 119
References ... 120
Appendix A – Shell interface ... 130
Appendix B – Primary energy additional graphs ... 141
Appendix C – Primary energy imports additional graphs ... 144
Appendix D – Electricity generation additional graphs ... 147
Appendix E – Electricity generation from fossil additional graphs ... 150
Appendix F - CO2 emissions additional graphs ... 152
Appendix G - VEDA training course agenda ... 154
Appendix H - VEDA training course certificate ... 156
List of Figures
Figure 1. Evolution of political decisions related to RET in the last 13 years ... 3
Figure 3.1. Expected RET supply mix by 2010 ... 16
Figure 3.2. Primary energy consumption mix in 2005 and 2010 (March 2011) ... 22
Figure 3.3. Evolution of biofuels over gasoline and diesel... 24
Figure 3.4. Premium to RET during the PER ... 28
Figure 4.1. Iberdrola’s electricity generation in Spain (2012) ... 33
Figure 4.2. Evolution of political decisions related to RET in the last 13 years ... 37
Figure 4.3. Evolution of regulations 2000-2010 ... 37
Figure 4.4. Primary energy in Spain (2011) ... 48
Figure 4.5. Composition of renewable energies in primary energy (2011) ... 49
Figure 4.6. Evolution of electricity generation in Spain (2013) ... 51
Figure 4.7. Evolution of electricity generation from conventional technologies in Spain (2013) 52 Figure 4.8. Comparison of electricity generated in Spain (2013) ... 53
Figure 4.9. Evolution of electricity generation from RET technologies in Spain (2013) ... 54
Figure 4.10. Annual demand coverage of electricity demand (2012) ... 57
Figure 4.11. Coverage of peninsular maximum hourly demand 13 February 2012 (9:00 pm -10:00 pm) (2012) ... 58
Figure 4.12. European electricity prices for residential consumers (2013) ... 60
Figure 4.13. Electricity bill composition in Spain ... 61
Figure 4.14. Evolution of CO2 emission in Spain ... 62
Figure 4.15. Evolution of CO2 emission from energy processes in Spain compared to total emissions ... 63
Figure 5.1. Overview of an energy system model ... 67
Figure 5.2. Illustration for market equilibrium. ... 70
Figure 5.3. Simplified TIMES objective function ... 72
Figure 5.4. Total annual cost simplified equation... 72
Figure 5.5. Origins of Times-IB. ... 73
Figure 5.6. Single region reference energy system. ... 74
Figure 5.8. FIT values in the model. ... 79
Figure 6.1 Primary energy consumption in the three scenarios. ... 81
Figure 6.2. Final energy consumption in the three scenarios. ... 84
Figure 6.3. Comparison of primary energy import results per scenario in 2050 (PJ)... 85
Figure 6.4. Comparison of electricity generation results per scenario in 2050 (GWh) ... 86
Figure 6.5. Comparison of electricity generation from fossil resources results in 2050 (GWh) .. 88
Figure 6.6. Comparison of CO2 emissions before CCS results per scenario in 2050 (MtCO2) .. 90
Figure 7.1. Expected and real installed capacity of the PER. ... 95
Figure 7.2. Maximum hourly and daily demands in Spain. ... 100
Figure 7.3. Supply and demand aggregated curves. ... 101
Figure 7.4. Evolution of the tariff deficit in Spain (2013). ... 104
Figure B.1 Evolution of primary energy – BaU ... 141
Figure B.2. Evolution of primary energy – FIT ... 141
Figure B.3. Evolution of primary energy – HFOSPRI ... 142
Figure B.4. Primary energy share by 2050 – BaU ... 142
Figure B.5. Primary energy share by 2050 – FIT ... 143
Figure B.6. Primary energy share by 2050 – HFOSPRI ... 143
Figure C.1. Evolution of imports on primary energy – BaU ... 144
Figure C.2. Evolution of imports on primary energy – FIT... 144
Figure C.3. Evolution of imports on primary energy – HFOSPRI ... 145
Figure C.4. Imports share on primary energy by 2050 – BaU ... 145
Figure C.5. Imports share on primary energy by 2050 – FIT ... 146
Figure C.6. Imports share on primary energy by 2050 – HFOSPRI... 146
Figure D.1. Evolution of electricity generation – BaU ... 147
Figure D.2. Evolution of electricity generation – FIT ... 147
Figure D.3. Evolution of electricity generation – HFOSPRI ... 148
Figure D.4. Electricity generation share by 2050 – BaU ... 148
Figure D.5. Electricity generation share by 2050 – FIT ... 149
Figure D.6. Electricity generation share by 2050 – HFOSPRI ... 149
Figure E.3. Evolution of electricity generation from fossil resources – HFOSPRI ... 151
Figure F.1. Evolution of CO2 emissions before CCS – BaU ... 152
Figure F.2. Evolution of CO2 emissions before CCS – FIT ... 152
List of Tables
Table 3.1. Targets of the PER for 2010 (2010)... 14
Table 3.2. Situation in 2005 and targets of the PER for 2010 – Generation in primary energy terms ... 15
Table 3.3. Situation in 2005 and targets for 2010 according to PER – Installed capacity ... 16
Table 3.4. Situation in 2005 and targets for 2010 according to PER – Generation ... 17
Table 3.5. Financial analysis of the PER ... 17
Table 3.6. Public financial support to the PER ... 18
Table 3.7. Endowment of the PER... 18
Table 3.8. PER budget and AACC contribution ... 19
Table 3.9. Financial analysis of the PER (thousands of euros) ... 20
Table 3.10. Premiums of the PER (2005) ... 21
Table 3.11. Primary energy consumption in 2005 and 2010 (March 2011) ... 22
Table 3.12. Generation and gross consumption of electricity in Spain, 2005-2010 ... 23
Table 3.13. REE’s 2010 Electrical Power Balance... 24
Table 3.14. Real installed capacity and degree of achievement of the PER (March 2011) ... 25
Table 3.15. Real electricity generated and degree of achievement of the PER (March 2011) ... 26
Table 3.16. Final electricity generated after the PER (March 2011) ... 27
Table 3.17. Forecasted and real investment of the PER (March 2011) ... 28
Table 4.1. Installed capacity per corporation (2008) ... 31
Table 4.2. Connections of politicians and electricity generators (2013) ... 43
Table 4.3. Level of dependency of external sources (2011) ... 49
Table 4.4. National Electricity Balance (2013) ... 51
Table 4.5. Installed capacity in Spain (2012) ... 55
Table 4.6. Evolution of capacity factors in Spain (2013) ... 56
Table 4.7. Levelized cost in Spain (2013) ... 56
Table 4.8. Evolution of premiums toRES in Spain (2013) ... 59
Table 6. Color coding for main technologies. ... 81
Table 6.1. Share of primary energy per scenario in 2050 ... 82
Table 6.3. Share of electricity generation per scenario in 2050 ... 87
Table 6.4. Share of electricity generation from fossil resources per scenario in 2050 ... 88
Table 7.1. CO2 emissions from the Spanish electricity sector ... 109
Table 7.2. Values for the Spanish electricity and energy systems (2012-2013) ... 110
List of Abbreviations
AACC Autonomous Communities
BP British Petroleum
CNE Comisión Nacional de la Energía (National Energy Commision)
CPI Consumer´s Price Index
EE Energy Efficiency
EEA European Economic Area
EU European Union
FIT Feed-In-Tariff
IDAE Institute for the diversification and the energy saving IEA International Energy Agency
MITYC Ministry of Industry, Tourism and Commerce MIEYT Ministry of Industry, Energy and Tourism
MMA Ministry of Environment
MtCO2 Millions of tons of CO2
PER Spanish renewable energy plan 2005-2010 PFER Spanish renewable energy plan 2000-2010 PP Popular party (Political party)
PSOE Socialist party (Political party)
REE Red eléctrica de España
RET/RET Renewable energy sources/Renewable energy technologies
TIMES The Integrated MARKAL–EFOM System
TIMES-IB TIMES Iberia (Spain + Portugal) TNCs Transnational corporations
1.
Introduction
The Spanish energy system has been characterized by higher energy intensity than the rest of Europe, by a high dependence on energy imports (around 84%) and also by rapid changes of the energy system in the last few years (IDAE 2005) (MIEYT 2011). The Spanish renewable energy plan 2005-2010 (Plan de Energías Renovables - PER) represented a revision of the Spanish promotion plan for renewable energy 2000-2010 (PFER) in force up until 2005. As stated in the PER, this revision happened because the initial forecast of absolute growth of renewable energies (RET) set up in the PFER were not met, energy consumption was growing continuously and over forecasted, and there was a need to comply with new international environmental commitments set by the Government of Spain (GOS) in terms of climate change and sustainable development.
The PER set three main targets and only one was fulfilled (and not to its full extent). When it comes to plans of this kind, it does not matter how ambitious the targets can be and how successful policy tools are, if it is continually lacking on considering fundamental and structural changes to the system. For instance, and based on further reviews in this document of the evaluations carried out by the Evaluation´s State Agency of public policies and the quality of services of the PER, the creation of a central unit for the Spain’s energy strategy and a real cooperation between the GOS and the Autonomous communities (AACC) should have been at the core of the PER. In addition, it was detected that the AACC had too much power and influence during the last decade and it made them key players in any policy deployment. These influences, in addition to the transferred powers and competences associated to RET policies and politicians, should have been revised during the deployment of the PER (AEVAL 2011).
The economic crisis is still hitting many European countries and Spain is struggling to cope with factors that are damaging its economy (a high unemployment rate of more than 25% by 3Q/2013). In addition, the Spanish energy system appears to be unsustainable as there is a high dependence of imported resources; the Spanish energy system generates high CO2 emissions; and there is high uncertainty of nuclear policy in the future (Cabal and Lechon 2011).
In particular, in 2010, around 80% of the total primary energy was from fossil resources and 77% of the total primary energy was imported (MITYC 2010). Also, up to 2007 CO2 emissions’ trend was upward, well above the agreed target in the Kyoto Protocol (protocol approved by the EU through the Decision 2002/358/EC), and exceeding 51% from base year levels. Unfortunately the trend has gone upward again and Spain will have to buy carbon credits from other EU countries1 in order to not exceed the 15% increase in emissions from the year base (1990) during the period 2008-2012 (Kyoto commitment). Finally, there will be a withdrawal from nuclear energy (fission) in 2028 in Spain with the decommissioning of the last nuclear facility, and due to the Fukushima accident, the society is questioning this type of energy again.
This situation implies the need to review the Spanish energy and electricity systems through possible changes in demand and supply. The following concepts should be taken into account: a) the dependency of external sources (imports) for primary energy;
b) the scarcity of fossil resources;
c) the uncertainties over the nuclear future, and
d) the potential of renewable energy and the maturity of some of these technologies.
In order to look at these issues in a comprehensive approach, the following research questions will be investigated:
- Is there an economic potential for RET to replace electricity generated from fossil resources by looking at the current situation of the electricity system?
- Is there potential to reduce CO2 emissions by using RET in Spain?
This document will aim at contributing to the description of the evolution of the Spanish electricity system in the last decade, to address the possible influence of various factors (i.e. corporations and organizations) in the design and implementation of electricity systems and the use of modern modeling technologies to evaluate the performance of energy and electricity systems. All together, they will represent a novel approach to bridge the results from modeling technologies to policy makers.
This novel approach follows a methodology where the first step is to understand the electricity market of the jurisdiction of analysis (in this case Spain), and to ensure the availability and credibility of the data to be used. It is followed by the definition of the model of interest and the design of the scenarios, and finalizing with the analysis of both results from the model and data collected from the perspectives of what has been done in previous RET policies and plans, and the possible influence of external factors in those policies and plans.
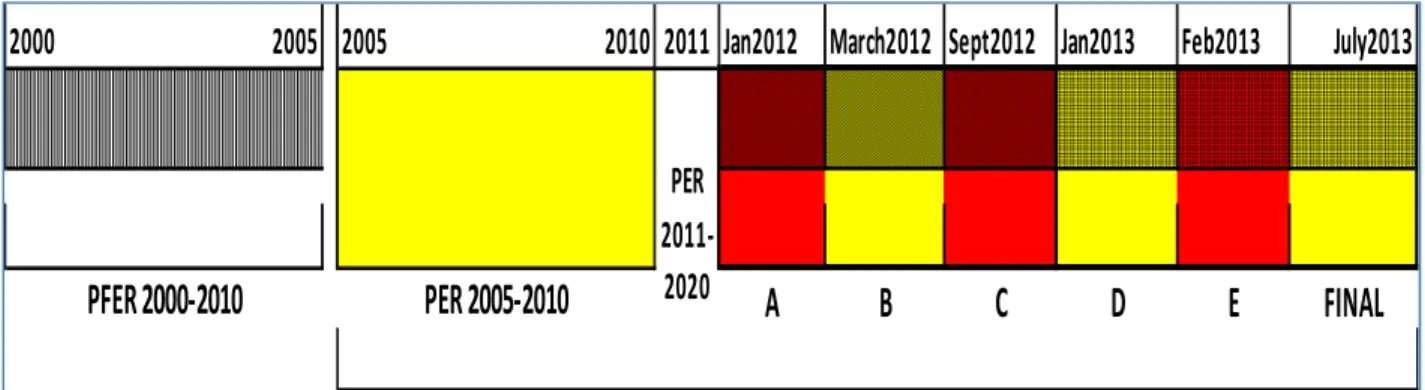
It was also found that the best way to clearly understand such a complex area of analysis, which is energy and electricity models and its implications, was on a timeframe approach, where, starting in the year 2000, the storyline could be told following the path up to 2050. Figure 1 shows the timeframe related to the first 13 years (2000-2013) including the most important political decisions related to RET. The remainder of the period of analysis, up to 2050, will be covered by the preliminary results from the model of interest.
Figure 1. Evolution of political decisions related to RET in the last 13 years
Previous studies of electricity markets using modelling techniques have been done extensively. Fuller (2008) described market equilibrium models with continuous and binary variables, where binary variables were introduced into nonintegrable models (not based in social welfare maximization). In a different approach, Linares et al. (2008) used an oligopolistic, long-term generation expansion model to design three scenarios to analyze whether current policies could be able to achieve sustainability by themselves.
San Cristobal (2012) used a goal programming model for environmental policy analysis with an application for Spain, and Burgos-Payan et al. (2013) discussed the case of the effects of the integration of RET in Spain by empirically reviewing Spanish RET support schemes and the 2000 2005 2005 2010 2011 Jan2012 March2012 Sept2012 Jan2013 Feb2013 July2013
A B C D E FINAL
PER 2011-2020
balance between the cost increase for the system and the reduction in wholesale prices, while including the effect of the cost of CO2 allowances needed to cover the greenhouse emissions, as given in Sensfuss et al. (2008) and Saenz de Miera et al. (2008).
Labriet et al. (2010) used an analysis to evaluate the energy strategies to be implemented in Spain in order to satisfy the EU Renewable Directive. The modelling framework of this work relied on the techno-economic model TIMES-Spain, part of the Pan-European TIMES model, and is used to discuss the dynamics of the RET implementation in Spain, given the European targets as well as the national targets and context. The model of interest used in this document follows this approach and utilizes and modifies the existing model of the TIMES-IB (IB stands for Iberia: Spain and Portugal). The TIMES-IB model is a techno-economic model of the Spanish and Portuguese energy systems which resulted from the interaction and participation of various European projects. This model was selected as it best represents the Spanish energy system and is a reputable source for modelling technologies.
This document represents a summary of the RET and RET plans in Spain, as well as the PER and its results. It provides a review of the evaluation carried out by the evaluation and quality agency of the Government of Spain, and it analyzes the results focusing on the electricity generation from RET. The document also provides current available information for installed power and generation from both RET and conventional sources in Spain, as well as the current premiums for the generation of electricity from RET, the capacity factors and levelized costs for selected generating technologies in Spain, and the peninsular instantaneous peak power demand (in MW) for the current time and for the period of the PER.
This information will be supported by the analysis of the results from the identified model which considers three possible scenarios: a Business as Usual scenario, which includes the suspension of Feed-In-Tariff (FIT) incentives in Spain since January 2012, a FIT scenario, which maintains the FIT incentives, and a high fossil fuel scenario, where prices for imported fossil fuels have been increased in 10% to see the response of the system such increase. These three scenarios have been defined under these concepts because they represent the most real situation of the energy and electricity systems (Business as Usual scenario); they consider the hypothesis of
continuing with the FIT incentives (FIT scenario); and analyses the reaction of the systems under an increase of imported resources (high fossil fuel scenario). The scenarios will be analysed in order to reflect the anticipated situation in 2050. The document will also provide comprehensive conclusions and recommendations that might help understand the complexity of implementing these types of plans and its consequences.
The document is structured as follows. Chapter 2 briefly describes the renewable energy context in Spain including renewable energy plans and renewable energy policies in Spain, CO2 emissions and the contribution of RET to mitigate them. Chapter 3 briefly describes the framework of the PER and its main targets, it presents the results, including the achievements of the RET, the investment in RET and the premiums to RET. Chapter 4 reviews the Spanish electricity system focusing on possible external factors that might influence RET plans, as well as providing current data available in the Spanish energy and electricity sectors. Chapter 5 introduces the modelling framework used for the analysis (TIMES-IB) and the defined scenarios. Chapter 6 presents the most important results obtained for the different designed scenarios, and chapter 7 analyzes the PER results and the current data available in the Spanish electricity sector. Finally, conclusions and recommendations are provided in chapter 8.
2.
RET in Spain
This chapter further elaborates the renewable energy context in Spain, taking into consideration the RET plans and RET in Spain. It provides a brief review of the renewable energy policies over the last 15 years and the evolution of CO2 emissions with considerations for the contribution of RET to mitigate them.
2.1.
RET plans and RET in Spain
A cost-effective reduction in CO2 emissions should require both the implementation of effective Energy Efficiency (EE) technologies and practices, and also give priority to low carbon technologies in the energy mix including RET. In this context, most governments adopted measures aimed at overcoming economic, technical and nontechnical barriers to deploy RET. The specific objectives and the support mechanisms employed have varied from country to country, reflecting specific interests, economic context, market and industrial situation, technology potential, and also the idiosyncrasies of each culture. The degree of success of these measures has also been variable, both in terms of cost and deployment effectiveness (Lewis and Wiser 2007) (Komor and Bazilian 2005). Spain has often been cited as an example for its success in the rapid deployment of alternative energy technologies, particularly wind, concentrated solar thermo electric, and photovoltaic (PV) (Martinez et al. 2009). However, there have been serious concerns about the rising costs of RET support in a country that has been badly hit by a financial crisis.
For the last two decades, Spain has undergone a rapid economic expansion accompanied by a similarly fast growth in energy consumption. Between 1990 and 2005, Spain’s gross domestic product (GDP) grew by 49.1% and its primary energy use by 61.3%, compared to 12.0% and 15.1% in the EU, respectively (IEA 2008). Despite the lack of fossil fuel resources in its national territory, the Spanish energy model is highly centralized and is dependent on conventional technologies. As a reference, of the 142 070 ktoe of primary energy used in 2008, 47.6% came from oil-derived products, 24.3% natural gas, 10.7% nuclear power, 9.7% coal, and 7.6% renewable energies. Imports accounted for 68.6% of the coal, 99.8% of the oil, and 99.9%
of the natural gas consumed (MITYC 2009). In addition, prior to the development of incentive programs, the use of RET in Spain was limited to small-scale biomass combustion installations for heat generation and small hydropower plants.
Several studies analyzed the future of RET in Spain. Linares et al. (2008) described different scenarios with estimations for 2020 that ranged from 16% (nonintervention) to 53% (ambitious RET policies including large hydropower investments). Resch et at. (2008) calculated that RET contribution in Spain would need to reach 40% of electricity (mostly from wind, large-scale hydropower, and biomass) and 21% of heat in order to comply cost effectively with 2020 EU objectives. The Spanish government approved the “Planning of the Electricity and Gas sectors 2008–2016,” which included a national indicative target for RET generation of 32% in 2016 (129,472 GWh).
2.2.
Renewable policies in Spain
The Spanish policy on the promotion of RET needs to be analyzed within an international context. On one hand, the European Union sets the common ground in the form of directives which are subsequently transposed and developed into national legislation while, on the other hand, international commitments on CO2 emissions (like the Kyoto Protocol) became legally binding to EU Member States following ratification in 2002.
The Kyoto Protocol allowed Spain a 15% increase in CO2 emissions above the 1990 values for the reference period 2008–2012. This allocation has been exceeded due to a larger than expected economic expansion in that period. GHG emissions peaked in 2005 (52.9% above 1990 values) and were subsequently reduced to 42.7% in 2008 due to low economic activity levels as a result of the economic crisis (more information about CO2 emissions in Spain will be provided in following chapters).
• The most recent RET Directive (Directive 28/2009/EC on the promotion of the use of energy from renewable sources) which set the regulatory framework and a target for renewable energies in Europe (20% RET in the final energy consumption, including electricity, heat, and transport sectors combined).
• The European Climate Change and Energy Package (2008) (also referred to as 20/20/20 by 2020) included three binding targets for the EU to be achieved by 2020: To reduce emissions of GHG emissions by 20% by 2020 (with respect to 1990), to increase energy efficiency to save 20% of EU energy consumption by 2020, to reach 20% of renewable energy in the total energy consumption in the EU by 2020, and to reach 10% of biofuels in the total consumption of vehicles by 2020.
• The Biomass Action Plan (2005) sets out a strategy aimed at doubling the use of biomass for energy purposes in the EU from 69,000 ktoe in 2004 to around 150,000 ktoe in 2010. • Directive 2003/96/EC restructuring the Community framework for the taxation of energy
products and electricity allowed Member States to apply low (or even zero) fuel tax rates for biofuels.
• The Biofuels Directive (Directive 2003/30/CE on the promotion of biofuels for transport) set non-legally binding targets on the share of biofuels on transport fuels (2% in 2005 and 5.75% in 2010).
• The RET Directive (Directive 2001/77/EC on the promotion of electricity produced from renewable energy sources in the internal electricity market) sets specific targets for RET-E generation in Member States and included several technical and administrative measures intended to achieve an overall objective of 21% by 2010.
Spain has been one of the most successful countries in the public promotion of RET, particularly wind electricity (Del Rio 2008). This support has been regulated through a feed-in tariff (FIT) scheme (FITs are subsidies per unit of energy (kWh) generated paid in the form of a total quantity (tariff) or as an amount on top of the wholesale electricity price (premium) fed into the grid and combined with a purchase obligation by the utilities). This instrument is also used in most other EU countries with different degrees of success both in terms of effectiveness and cost (Del Rio 2008) (Linares et al. 2008).
The success of RET support policies does not depend only on the type of support scheme being implemented, but is significantly affected by the design elements of those instruments. The basic structure of the Spanish FIT system was first implemented in 1998 but has been subsequently modified in 2004 and 2007 (2008 for solar PV). Despite the legislative changes, there has been continuity and stability in the RET promotion framework under different governments (Del Rio 2009). The main regulations regarding RET promotion in Spain according to San Miguel et. al (2010) were:
Law of the Electricity Sector (Law 54/97): this law established a “Special Regime” in which RET was given a special treatment with the aim of achieving the EU target of 12% of the gross energy consumption from RET in 2010. The basic framework for RET support was provided by this law, which included guaranteed grid access and a price support for RET producers. In addition, RET plants lower than 10 MW would receive a premium set by the government.
Royal Decree on the Special Regime (RD 2818/1998): this Royal Decree developed the support system for RET producers, who could choose between two alternatives: (1) A fixed premium on top of the electricity market price and (2) a fixed total price (fixed feed-in). These values were adjusted annually, which allowed generators to know their revenue in advance regardless of changes in the market price. The cost of implementing this scheme is finally paid by consumers through their electricity bill.
Royal Decree 436/2004: RET generators were allowed to sell their electricity to distributors or directly to the market. In both cases, support was defined for each renewable technology as a percentage of the average electricity tariff (AET). The rapid increase in the AET that took place in that period led to an excessive increase in the costs of RET support. This led to the approval of another Royal Decree.
Royal Decree 661/2007: this Royal Decree provided the current RET regulatory framework in Spain. RET support was tied to the evolution of the consumer price index (CPI). In addition, a cap-and-floor system for RET support levels was implemented. If the market price plus the premium are above the cap value, then RET generators only receive the cap level. If they are
below the floor values, they receive the floor price. The goal was to avoid excessive costs for consumers (cap), while simultaneously encouraging investments (floor).
However, back in 2008 there were already concerns about the rising costs of the system, an inherent problem of effective FIT schemes. Although the unitary support (eurocents/kWh) was capped, a relatively high FIT made RET investments very attractive, which lead to a high increase in the total support. Official data from the National Energy Commission (2008) showed that the total amount of RET support increased more than threefold from 1,740 million euros in 2004 to 5,702 million euros in 2008. Particularly problematic was the rise in the total support between 2007 and 2008 (from 3,369 million euros to 5,702 million euros, a 69% rise). Although total support increased for all technologies, the greatest growth in relative terms was experienced by Solar PV (fivefold increase) and in absolute terms by wind (it added €1,100 million to the support received in 2007). The fact that the total installed Solar PV electricity capacity in Spain in 2008 was 3,210 MW, when its target for 2010 was only 400 MW, suggests that the FIT was set at a very high level.
In order to deal with FIT increases, the Spanish government put a cap on the price and on the quantity (RET deployment), leading to a high increase in the total support. This was done first in the solar PV realm.
In September 2008, the Spanish government approved the Royal Decree 1578/2008, which set not only a cap price on this technology but also a quantity cap (through the requirement for a preregistration). This was done in order to keep the overall support costs at reasonable levels. For the other RET, there was an attempt to limit the overall costs of the system by requiring renewable energy projects to pre-register, limiting the right to receive the FIT to those already preregistered before June 7, 2009 (Royal Decree-Law 6/2009). The aim of this preregistration was, according to the government, to encourage a “sustained growth” for the different technologies in order to avoid technical problems and excessive costs (Hernandez 2009).
2.3.
CO2 emissions and contribution of RET
Spanish CO2 emissions in 2008 were 42.7% above base-year levels (1990), which compares poorly against the Kyoto target of 15% in 2008–2012. Energy and transport sectors were the main contributors to the CO2 emissions. The analysis of the factors behind these emission trends is beyond the scope of this document, although there is a relation to the strong economic and demographic growth, and the increase in energy demand.
The two main pillars to mitigate emissions are policies aimed at Energy Efficiency (EE) and the promotion of RET. Regarding the former, most instruments to promote EE in Spain are the result of transposition of EU directives into national law which predominantly fall under the Spanish Energy Efficiency Strategy (E4) 2004–2012. The other main pillar of a low carbon economy is RET, which contributes to the reduction in CO2 emissions and Kyoto compliance.
A particularly decisive effort should be made in sectors not covered by the EU emissions trading scheme (EU-ETS), also called diffuse sectors (mainly transport and residential/commercial), where emissions are expected to increase by 65% (MMA 2007). Substitution of conventional fuels for RET in electricity generation would facilitate compliance with the EU-ETS by power companies. In addition, the implementation of renewables in transport and heat would contribute to the control of emissions in the diffuse sectors. However, this will not be enough to reduce emissions to the required levels (MMA 2007).
Therefore, recourse to Kyoto units2 were needed to cover emissions both in sectors covered and non-covered by the EU-ETS. For covered sectors, private companies (mostly in the electricity sector) needed to purchase Kyoto units (1,302 MtCO2 for 2008–2012). In addition, the government purchased 159 MtCO2 to cover diffuse emissions, thus promoting the development of RET abroad.
The long-term problem is that emissions from diffused sectors are difficult to tackle with renewable energy measures and other more decisive instruments have been neglected. In
2
Emissions trading, as set out in Article 17 of the Kyoto Protocol, allows countries that have emission units to spare - emissions permitted them but not "used" - to sell this excess capacity to countries that are over their targets.
particular, fiscal instruments (taxes) within an ecological tax reform, with corresponding reductions in social security contributions by employers have been proposed by economists in Spain with little success. Instead, the approach should be a more politically feasible one (but less socially desirable), i.e., to subsidize the large emissions increase in the diffuse sectors by buying Kyoto units through the public budget.
Deployment of renewables will reduce CO2 emissions in Spain. The initial plan indicates that about 70% of the reduction should be attained in the electricity generation area, followed by 20% in biofuels, and 10% in thermal uses. However, there are currently no official calculations on how Spain is expected to achieve its 20% renewable energy target in 2020 and the resulting CO2 emission reductions. Only some prospective studies for the electricity sector can shed light on this issue.
The following chapter provides a detailed explanation of the latest RET plan deployed in Spain, the PER (2005-2010).
3.
Framework of the PER
According to IDAE (2005) Spain has been undergoing rapid growth in energy intensity for the last fifteen years. Spain’s excessive and growing dependence on external energy supplies — around 83% over the last few years— and the need to preserve the environment, made it necessary to promote effective formulas for efficient use of energy and the use of clean sources of energy. It was believed that there were enough reasons to promote effective formulas for efficient use of energy and the use of clean sources of energy.
3.1.
Regulatory overview
Since 1997 Spain has undergone its own liberalization process, going from a strong interventionist policy, almost a monopoly status, to a more open market for generation and commercialization (IDAE 2005). Following the European framework, promotion policies for renewable energies (RET) have been developed around the liberalized market set up by the Law 54/1997. In particular, Article 4 of the 54/97 Law for the Electrical Sector, stated that “the national electricity planning will be indicative except for those concerning transmission facilities, with the participation of the Autonomous communities (AACC)”.3
This “indicative planning” should include: notes to the evolution of market conditions, the expectations about the behaviour of the demand and the resources to fulfill it, the need of new power, correction of the imbalances between generation and demand, and the criteria for environmental protection. In this planning process, AACC should have had special significance due to their authority to decide the preferential location of the resources within its own territory, although, it could represent an opposition to any national electricity policy. Under this regulatory overview, the targets for the PER were set.
3
The State is organized into municipalities, provinces and autonomous communities (AACC): 17 autonomous communities and two cities (Ceuta and Melilla). These AACC are: Andalusia, Aragón, Principality of Asturias, Balearic Islands, Basque Country, Canary Islands, Cantabria, Castile-La Mancha, Castile and Leon, Catalonia, Extremadura, Galicia, La Rioja, Madrid, Region of Murcia, Navarre, and Valencian Community.
3.2.
Targets of the PER
The targets set in 2005 expected a contribution from RET (hydro included) of 12.10 % of primary energy consumption in 2010, electricity generation from RET of 29.4 % of the gross electricity consumption, and biofuels consumption of 5.75 % of gasoline and diesel use for transport in 2010 (IDAE 2005). Table 3.1. summarizes the three main targets for 2010.
Target # Targets of the PER 2010
1 Renewable energies / Primary energy 12.10 %
2 % of electricity from renewable sources / Gross consumption of electricity 29.4 %
3 % of biofuels (gasoline and diesel) use for transport 5.75 %
Table 3.1. Targets of the PER for 2010 (2010)
Source: Adapted from the PER targets, IDAE (2005).
These targets were broken down by the electricity generation technologies considered in the PER (see Table 3.2.) and classified into primary energy terms (ktoe) for the first target, and into installed power (MW) and generation of electricity (GWh), for the second target. The third target was classified as a percentage of biofuels consumption over the consumption of gasoline and diesel.
In order to evaluate the achievement of the first target, the PER considered to move from a 6.88 % of RET of the total consumption of primary energy, to a 12.10 % share of RET’s total country’s consumption by 2010. The following table shows the targets for the generation of electricity from RET in primary energy terms (ktoe).
Renewable energy source / ktoe
Output in primary energy terms (ktoe)
2005 2010
Hydro-electric (>50MW) 1,979 1,979
Hydro-electric (10-50MW) 498 557
Hydro-electric (<10MW) 466 575
Biomass power station 680 3,586
Biomass Co-combustion 0 1,552
Wind power 1,683 3,914
Solar PV 5 52
Biogas 267 455
Solar Thermoelectric 0 509
Biomass Thermal 3,487 4,070
Low temperature solar Thermal 51 376
Biofuels 228 2,200
Total renewable energy source 9,739 20,220 Consumption of primary energy 141,567 167,100 % of renewable energy / primary 6.88 % 12.10 %
Table 3.2. Situation in 2005 and targets of the PER for 2010 – Generation in primary energy terms
Source: Adapted from the PER targets, IDAE (2005).
For the second target, the PER aimed at installing more than 15,400 MW from RET by 2010 with an increase of more than 17% in wind power. Hydro-electric (>50MW) was planned to stay at the same capacity and therefore having a decrease of more than 18% at the expense of other RET. Other technologies presented only increments of around 1% (solar PV, biomass power stations, etc). Table 3.3. shows, for the installed power, the situation in 2005, the targets set by PER for 2010, and the expected increases for this period. In addition, Figure 3.1. shows the expected percentages of RET installed capacities by 2010.
Renewable energy source / MW
Situation in 2005 (MW) Target for 2010 (MW) Expected increase 2005-2010 (MW) Hydro-electric (>50MW) 13,521 13,521 0 Hydro-electric (10-50MW) 2,897 3,257 360 Hydro-electric (<10MW) 1,749 2,199 450 Biomass
Biomass power station 344 1,317 973
Co-combustion 0 722 722 MSW 189 189 0 Wind power 8,155 20,155 12,000 Solar PV 37 400 363 Biogas 141 235 94 Solar Thermoelectric 0 500 500
Table 3.3. Situation in 2005 and targets for 2010 according to PER – Installed capacity
Source: Adapted from the PER targets, IDAE (2005).
Figure 3.1. Expected RET supply mix by 2010
Source: Adapted from MIEYT (2011)
The targets of the PER aimed at increasing by more than 42,000 GWh the electricity generation from RET, with an important increase coming from wind power, almost 12%, at the expense of reduction in generation from hydro-electric. Table 3.4. shows the situation in 2005, the targets set in the PER for 2010 for the generation of electricity from RET, and the expected increases for this period.
Renewable energy source / GWh
Situation in 2005 (GWh) Target for 2010 (GWh) Expected increase 2005-2010 (GWh) Hydro-electric (>50MW) 25,014 25,014 0 Hydro-electric (10-50MW) 5,794 6,480 686 Hydro-electric (<10MW) 5,421 6,692 1,271 Biomass
Biomass power station 2,193 8,980 6,787
Co-combustion 0 5,036 5,036 MSW 1,223 1,223 0 Wind power 19,571 45,511 25,940 Solar PV 56 609 553 Biogas 825 1,417 592 Hydro-electric (>50MW), 0% Hydro-electric (10-50MW), 1% Hydro-electric (<10MW), 1% Biomass power station, 1% Co-combustion, 0% MSW, 0% Wind power, 71% Solar PV, 22% Biogas, 0% Solar Thermoelectric, 4%
Solar Thermoelectric 0 1,298 1,298
Total electricity generated from RET 60,097 102,260 42,163 Table 3.4. Situation in 2005 and targets for 2010 according to PER – Generation
Source: Adapted from the PER targets, IDAE (2005).
3.3.
Financing
The PER estimated that around 23,598 million euros would be the volume of investment needed in order to achieve the targets over the period 2005-2010 (see Table 3.5). This volume required equity financing (developers) of 4,720 million euros, with the rest to be provided by the market (18,198 million euros) and public subsidies (681 million euros).
Source of finance Amount
(millions of euros) %
Developers 4,719 20
Debt (external) 18,198 77
Public subsidies 681 3
Total 23,598
Table 3.5. Financial analysis of the PER
Source: Adapted from the PER targets, IDAE (2005).
The total public financial support for renewable energies was estimated to be approximately 8,492 million euros, where 3,536 million euros (2,855 + 681) were going to be strictly public aid, and charged to the national budget partly in the form of investment subsidies and partly as tax incentives for the production of biofuels, and 4,956 million euros for the total support over the period through the premium system for the generation of electricity from RET. Thus, under the “Public aids” denomination, the PER considered three categories as financing sources: Public subsidies, Tax incentives for the use of biofuels, and Premium to electricity generation from RET. Table 3.6. shows a summary of these categories and the allocated budget and percentage to the total.
Public aids (millions of euros) Amount %
Public subsidies 681 8
Premiums to electricity generation from RET 4,956 58
Total 8,492
Table 3.6. Public financial support to the PER
Source: Adapted from the PER targets, IDAE (2005).
Public subsidies included the conventional non-recoverable subsidies and those intended to improve the conditions for the financing of the investments (681 million euros). Tax incentives for the use of biofuels consisted on the tax exemption on hydrocarbons in the selling price of biofuels or zero tax rate (2,855 million euros), and the Premiums to electricity generation from RET was a financial support for the bulk of electricity generated with RET. Only in two areas, solar PV and solar thermoelectric, were premiums planned to be supported with investment aids. The implementation of the indicative premiums proposed in the PER implied a steady annual increase in the average reference tariff of approximately 0.6 %.
Table 3.7. illustrates the total endowment of the PER, and its distribution during the implementing period.
2005 2006 2007 2008 2009 2010 TOTAL
Public subsidies (millions of euros) 62 82 115 126 137 156 678 Tax incentives for the use of biofuels
(millions of euros) 18 153 328 517 751 1,085 2,852 Premiums to electricity generation from
RET (tariff contributions) - (millions of euros)
79 264 521 909 1,352 1,828 4,953
Total 159 499 964 1,552 2,240 3,069 8,483
Table 3.7. Endowment of the PER
Source: Adapted from the PER targets, AEVAL (2011).
This financing was planned to be provided by the GOS and by the AACC, although the latter had a scant economic contribution. The following table summarizes the estimates for this financing.
2005 2006 2007 2008 2009 2010 TOTAL
PER budget (millions of euros) 160.20 499.12 965.95 1,554.28 2,241.94 3,070.70 8,492.19 AACC contribution (millions of
Table 3.8. PER budget and AACC contribution4
Source: Adapted from the PER targets, AEVAL (2011).
3.4.
Policy tools
Following the European model, generation and commercialization of electricity in Spain are both deregulated, while transportation and distribution are regulated activities with tolls and tariffs. Electricity generation in Spain has two different regimes: the ordinary regime (OR), to which all the conventional generation technologies belong to, and the special regime (SR), to which the renewable energy generation belongs. Although a wholesale electricity market was created at the end of the 90s, a high proportion of domestic consumption continued to be supplied at regulated tariff. The regulated rate does not cover all generation and distribution costs, thus leading to a deficit (tariff deficit), which is through credits backed by revenue from the electricity system. The National energy commission (CNE) estimated that this deficit could be more than 43,000 million euros by 20205. According to Linares et al. (2008), the Spanish market is a concentrated market, with two large firms covering almost 80% of the generation market with four other small firms with only some generation capacity.
The SR grants grid access priority and ensures higher remuneration to RET producers. The extra cost of the RET is passed on to the electricity system and to consumers through tolls and consumption rates. The feed-in-tariff (FIT) of the PFER incorporated both fixed total prices and price premiums added to the electricity market price. Tariffs were updated in May 2007 by curbing profits for wind generators and setting incentives for other types of renewable energies. The new rules set by the PER aimed at guaranteeing an internal rate of return of 7% to wind and hydroelectric plants that chose to sell power to distributors directly, and returns of 5% and 9% respectively if they participated in the electricity pool market.
As outlined in the PER, project developers had to choose between transferring electricity to the system through the transport or distribution grid and therefore being paid a FIT (premium) for it
4
The differences observed between this table and the previous totals reflect literally which was contained in the PER.
5
(constant for all the programming periods), or selling the electricity on the wholesale electricity market, having the electricity sale price being the hour price resulted in the wholesale market supplemented if any, with a premium. The following table was prepared in the PER to show the financing plan per technology.
Renewable energy source
Total financing Premium
for period
Tax
incentives Total
investment
Developer External Public Exemption
Wind 190,013 760,051 0 189,062 0 950,063 Hydro 2,351,278 9,405,113 0 2,598,870 0 11,756,391 10MW 10,915 43,662 0 0 0 54,577 10-25MW 142,019 284,039 284,039 0 0 710,097 25-50MW 392,919 1,571,677 0 1,059,922 0 1,964,596 Solar Thermoelectric 231,366 925,464 0 0 2,855,095 1,156,830 Solar PV 23,932 95,726 0 49,425 0 119,658 <100kW w/monitoring 536,922 1,799,610 348,078 0 0 2,684,611 <100kW fixed 432,500 1,723,800 6,200 559,514 0 2,162,500 >100kW 33,021 95,762 36,324 0 0 165,107 Biomass 374,842 1,493,070 6,299 499,415 0 1,874,211 Totals 4,719,728 18,197,974 680,939 4,956,208 2,855,095 23,598,641 Table 3.9. Financial analysis of the PER (thousands of euros)
Source: Adapted from the PER targets, AEVAL (2011).
Based on the PER’s financial analysis, project developers would have to invest approximately 4,719 million euros and the financial markets would have to lend around 18,197 million euros. The three public measures considered by the PER were previously described in section 3.3.
In general, the main source of aid for electricity generation from RET was the one provided by the PER’s premiums system. This incentive constituted the main mechanism supporting the development of these sources. The following table shows the premiums quoted in the PER (2005) per generating technology. The following section will present the results of the PER and the current available information to help in analysing the results and understanding the complexity of implementing these types of plans.
Electricity Generation Premium (c€/kWh) Electricity Generation Premium (c€/kWh) Wind 2.9322 Biogas 2.9322 Hydro Biomass 10MW 2.9322 Energy crops <15MW 5.8643 10-25MW 2.9322 Energy crops 15-50MW 4.3982
25-50MW 2.1991 Agricultural and forestry wastes 4,3982
Solar Thermoelectric 18.326 Agro-industry waste 4.3982
Solar PV Timber industry waste 2.1991
<100kW with monitoring 38.4846 Co-combustion 1.4661
<100kW fixed 38.4846
>100kW 18.3260
Table 3.10. Premiums of the PER (2005)
Source: Adapted from the PER targets, IDAE (2005).
3.5.
Results of the PER
3.5.1. Main results
The PER considered three main targets: 12.10 % of RET over the total primary energy consumption, 29.4% of electricity to be generated from RET, and biofuels consumption of 5.75 % of gasoline and diesel use for transport by 2010. The results presented in this section were provided by the IDAE in April 2011 (last ones available).
i) Target 1: 12.10 % of renewable energies over the total primary energy consumption.
The target for primary energy consumption was not fulfilled. Table 3.11. shows that the final primary energy consumption from RET was of 11.30 % and therefore did not achieve the 12.10 % targeted.
Primary energy source 2005 2010
Natural Gas 20.04 % 23.50 %
Oil 49.39 % 47.30 %
Nuclear 10.32 % 12.20 %
Renewable Energies 5.76 % 11.30 %
Table 3.11. Primary energy consumption in 2005 and 2010 (March 2011)
Source: Adapted from the AEVAL report (2011).
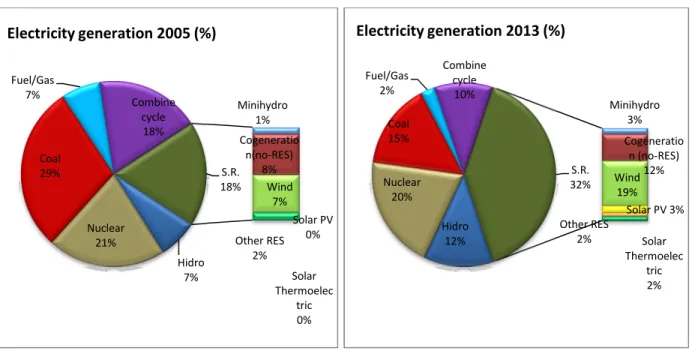
Figure 3.2. shows the primary energy consumption mix in 2005 and in 2010, where wind and hydro representing only 2.9% and 2.8% respectively in 2010.
Figure 3.2. Primary energy consumption mix in 2005 and 2010 (March 2011)
Source: Adapted from the AEVAL report (2011).
ii) Target 2: 29.4 % of electricity to be generated from RET.
The target for the share of electricity produced from RET was fulfilled according to the results presented in the E4 report. For this case, electricity generated from RET reached 33.3 % of the total electricity production in 2010. Table 3.12. shows the generation and gross consumption of electricity in Spain during the period of the PER.
Electricity generation 2005 (GWh) 2006 (GWh) 2007 (GWh) 2008 (GWh) 2009 (GWh) 2010 (GWh) Conventional Coal 81,458 69,850 75,505 49,892 36,864 25,493 Nuclear 57,539 60,126 55,102 58,971 52,761 61,788 Natural Gas 82,819 94,706 98,272 122,964 109,565 96,216 Oil 24,261 22,203 21,591 22,099 20,074 16,517 Natural Gas 20.04% Oil 49.39% Coal 14.58% Nuclear 10.32% Hydro 1.06% Wind 1.25% Biomass, Waste, Biogas 3.22% Biofuels 0.19% Solar 0.04% RES, 5.76% Natural Gas 23.50% Oil 47.30% Coal 6.30% Nuclear 12.20% Hydro 2.80% Wind 2.90% Biomass and Waste 3.80% Rest of RES 1.90% RES, 11.30%
Hydro from pumping (not RET) 5,153 3,941 3,289 2,817 2,831 3,106 Total conventional (GWh) 251,740 250,826 253,759 256,743 222,092 203,120 Renewables Hydro 17,872 25,890 27,233 23,271 26,353 42,215 Wind 21,175 23,297 27,568 32,496 38,091 43,708 Solar PV 41 119 501 2,541 5,939 6,279 Solar Thermo 0 0 8 16 103 691
Thermal RE (Biogas, Biomass,
etc) 2,652 2,774 2,898 3,696 3,876 4,228
Total renewables 41,740 52,080 58,208 62,020 74,362 97,121
Total gross generation 292,970 302,906 311,967 318,763 296,457 300,241
International exchange (export) -1,344 -3,279 -5,751 -11,039 -8,106 -8,338
Gross consumption 291,626 299,627 306,216 307,724 288,351 291,903
Evolution of RET
contribution 14.3% 17.4% 19.0% 20.2% 25.8% 33.3%
Table 3.12. Generation and gross consumption of electricity in Spain, 2005-2010
Source: Adapted from CNE, IDAE, Energy Deputy Office and the Ministry of Industry (March 2011).
However, if the results of Red Electrica Española’s (REE – the Spanish Transmission Operator) annual report are applicable, the RET contribution to the total reaches a share of 21.76 %. This reduction is caused because the REE’s annual report considered RET in a different way than the PER. The PER considered all hydro generation as a renewable source but did not consider all hydro generation for the PER. Hydro (more than 50MW) from the ordinary regime is not considered as a renewable source receiving premium since it does not belong to the special regime, where hydro (minihydro, up to 50MW) receives a premium for generation of electricity. Table 3.13. shows the REE’s annual results for 2010.
Electricity generation GWh % Ordinary regime Hydro 38,653 13.39% Nuclear 61,990 21.48% Coal 25,478 8.83% Fuel/Gas 9,553 3.31% Combined Cycle 68,595 23.77%
Total ordinary regime 204,269 70.79%
Consumption in generation -7,572
Hydro 6,811 2.36%
Wind 43,692 15.14%
Solar PV 6,311 2.19%
Solar Thermo 692 0.24%
Thermal RE (Biogas, Biomass, etc) 5,316 1.84%
Thermal not renewable 29,045 10.07%
Total renewables 62,822 21.76%
Total special regime 91,867 31.84%
Total net generation 288,564
Consumption in pumping -4,458.00
International exchange (export) -8,333.00
Demand 275,773.00
Balance 12,791.00 Table 3.13. REE’s 2010 Electrical Power Balance
Source: The Spanish electricity system summary, REE (2010).
iii) Target 3: 5.75 % of biofuels (gasoline and diesel) use for transport.
The target for the use of biofuels as an alternative for gasoline and diesel was not fulfilled. Figure 3.3. shows the evolution of the consumption of biofuels over gasoline and diesel (%) during the period of the PER. The consumption reached only a 5 % share, below from the 5.75 % targeted.
Figure 3.3. Evolution of biofuels over gasoline and diesel
Source: AEVAL report (2011)
0.54% 1.20% 1.93% 3.46% 5.00% 0.00% 1.00% 2.00% 3.00% 4.00% 5.00% 6.00% 2006 2007 2008 2009 2010
3.5.2. Achievements of the RET
Installed capacity
Renewable energy source / MW Expected increase 2005-2010
Real installed capacity increase 2010 % of target achieved Hydro-electric (>50MW) 0 0 100 % Hydro-electric (10-50MW) 360 192 53.33 % Hydro-electric (<10MW) 450 173 38.44 % Biomass
Biomass power station 973 188 19.32 %
Co-combustion 722 0 0 % MSW 0 0 0 % Wind power 12,000 12,426 103.55 % Solar PV 363 3,749 1,032.78 % Biogas 94 59 62.77 % Solar Thermoelectric 500 632 126.40 %
Total installed capacity from RET 15,462 17,419
Table 3.14. Real installed capacity and degree of achievement of the PER (March 2011)
Source: Adapted from the AEVAL report (2011).
Table 3.14. indicates that wind energy and solar thermoelectric achieved their targets as planned, with approximately 103% and 126% respectively of target achievement. The degree of achievement for Solar PV was more than 1,032%, installing more than 3,700 MW. The rest of the technologies did not achieve their targets. The total installed capacity by the PER was of 17,419 MW by 2010. The final installed capacity after the PER finished can be seen in the following table. Wind power installed 20,581 MW (46.30 %), and Solar PV installed 3,786 MW (8.52 %).
Renewable energy source / MW capacity in 2010Final Installed
Hydro-electric (>50MW) 13,521
Hydro-electric (10-50MW) 3,089
Hydro-electric (<10MW) 1,922
Biomass
Biomass power station 532
MSW 189
Wind power 20,581
Solar PV 3,786
Biogas 200
Solar Thermoelectric 632
Total installed capacity from RET 44,452
Table 3.15. Final installed capacity after the PER (March 2011)
Source: Adapted from the AEVAL report (2011).
Generation
Renewable energy source / GWh
Expected increase 2005-2010 Real generated increase 2010 % of target achieved Hydro-electric (>50MW) 0 0 100 % Hydro-electric (10-50MW) 686 627 91.40 % Hydro-electric (<10MW) 1,271 585 46.03 % Biomass
Biomass power station 6,787 1,317 19.40 %
Co-combustion 5,036 0 0 % MSW 0 0 0 % Wind power 25,940 24,137 93.05 % Solar PV 553 6,261 1,132.26 % Biogas 592 268 45.27 % Solar Thermoelectric 1,298 1,144 88.14 %
Total electricity from RET 42,163 34,340
Table 3.15. Real electricity generated and degree of achievement of the PER (March 2011)
Source: Adapted from the AEVAL report (2011).
Table 3.15. illustrates that only the generation from Solar PV achieved the target with a 1,132% degree of achievement, corresponding to 6,317 GWh generated, representing around 5,700 GWh generated more than what was targeted. Wind power was close to the target with a 93% degree of achievement as well as Hydro-electric (10-50MW) with around 91% of degree of achievement. The following table shows the final electricity generated by RET in 2010 as a consequence of the PER.
Electricity Generation (GWh) generated in 2010Final electricity
Hydro-electric (>50MW) 25,014
Hydro-electric (10-50MW) 6,421
Hydro-electric (<10MW) 6,006
Biomass
Biomass power station 3,510
Co-combustion 0 MSW 1,223 Wind power 43,708 Solar PV 6,317 Biogas 1,093 Solar Thermoelectric 1,144
Total electricity generated from RET 94,437
Table 3.16. Final electricity generated after the PER (March 2011)
Source: Adapted from the AEVAL report (2011).
After the PER finished , the final total electricity generated by RET was 94,437 GWh. Wind power generated 43,708 GWh (46.3 %), and Solar PV generated 6,317 MW (26.49 %).
3.5.3. Investments of the RET
According to the results of the PER, the total investment planned for the PER was approximately 23,084 million euros (see table 3.7. in section 3.3. for more details). The real investment, in 2010, was approximately 39,237 million euros, an increase of almost 70% of the forecasted budget. Per technology, in 2005 wind was planned to receive almost 51% of the total investment by 2010, but the final investment received was only 35%. In monetary values, Wind received more than was planned (13,630 million euros versus the 11,757 million euros planned).
Solar PV was planned to receive an investment of approximately 2,000 million euros (8.8% of the total) but it ended up receiving 19,697 million euros or 50.2% of the total invested in RET in 2010. This is an increase of more than 865% of the investment planned. Table 3.17. shows the planned and real investments per technology in the PER.
Electricity generation Plan Invesment (M€)
Plan Forecast Real (2010)
Wind power 11,757.00 13,630.00 Hydro-electric (<10MW) 700.00 258.90 Hydro-electric (10-50MW) 250.00 167.90 Solar Thermal 2,685.00 1,331.50 Solar Thermoelectric 2,163.00 1,924.00 Solar PV 2,039.30 19,697.00 Biomass Thermal 764.40 316.10 Biomass electrical 1,448.90 553.10 Biogas 119.70 129.90 Biofuels 1,156.70 1,229.30 Total investment 23,084.00 39,237.70
Table 3.17. Forecasted and real investment of the PER (March 2011)
Source: Adapted from the AEVAL report (2011).
3.5.4. Premiums of the RET
Premiums for the generation of electricity from RET (under the special regime) during the period of the PER (2005-2010) were a total of 9,448.50 million euros, where around 66% (6,250 million euros) went to the Solar PV technology. Figure 3.4. illustrates the unbalanced distribution of the premium among the different technologies.
Figure 3.4. Premium to RET during the PER
2853 6250 207.1 103.2 35.2 0 1000 2000 3000 4000 5000 6000 7000
Wind Solar PV Solar TE Total Hydro Biogas
m il li o n e u ro s
After this brief description of the framework of the PER and its main targets and final results, the following chapter will look into possible external factors that could have influenced some key decisions regarding the deployment of RET policies. As well, it will provide a brief summary of the current situation of the Spanish electricity system.