Compressed sensing in FET based terahertz
imaging
Domonkos Gergelyi
A thesis submitted for the Doctor of Philosophy
Pázmány Péter Catholic University
Faculty of Information Technology and Bionics
Roska Tamás Doctoral School of Sciences and Technology
Supervisor
Péter Földesy, Ph.D.
Introduction
Terahertz sensing is a relatively new modality in medicine. Its clinical usage started in July 2012 by inspecting specific cancer diseases of dermal origin (TeraView – Cambridge, UK). However, terahertz imaging still has a long way to go to become an accepted technique in diagnostics. The possible applications require the fast observation of large areas with high sensitivity. For this, the large-scale integration and the overall noise suppression of the measurement system are indispensable.
In the Institute for Computer Science and Control of the HAS, research on CMOS based terahertz sensors has been carried out since 2008. Room temperature, antenna coupled, FET plasma wave detectors were in the focus of the research project I got the chance to join in 2009.
With my work, I target the above-mentioned questions – scalability and overall system performance – by studying sensing in a holistic, application oriented manner: I consider the integrated focal plane antenna array, the detectors, the read-out circuitry and the post-processing as a whole.
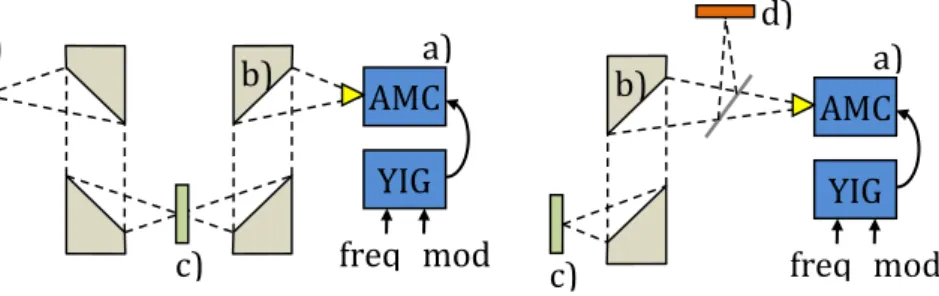
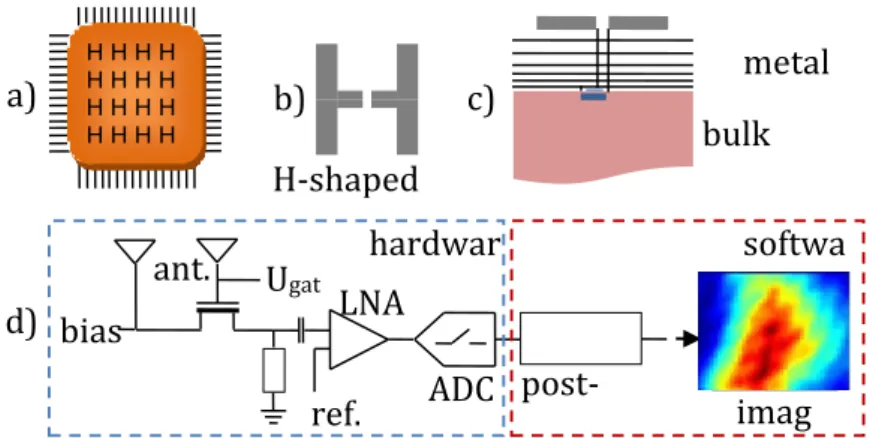
Fig 1 shows two simple experimental measurement setup and Fig 2 depicts the main components of the system that were modeled together primarily from the aspect of their noise performance.
CMOS based power detectors are promising solutions for low cost, high resolution, room temperature terahertz detection. However, the system level integration of these plasma wave detectors is less matured.
Fig. 1 A transmissive and a reflective setup is depicted on the left and right side, respectively; the main components are: a) Terahertz continuous wave (CW) source: amplifier-multiplier chain (AMC) and yttrium iron garnet (YIG) oscillator, b) off-axis parabolic mirrors, c) target object d) detector chip
d)
AMC
YIG
freq
.
mod
.
a)
c)
b)
)
AMC
YIG
freq
.
mod
.
d)
a)
c)
b)
)
Fig. 2 The study covers some parts of both the hardware (architecture of the antenna array, read-out organization) and the software (post-processing, image reconstruction): a) focal plane antenna arraywith the detectors; b) top view of a single antenna; c) cross section of the chip (antenna at the top and the MOS FET detector in the middle); d) the scheme of the studied system (considering a single detector element) – the components are represented with appropriate noise models to be able to handle them together, in a holistic way to evaluate design choices on a quantitative base
My work brings terahertz imaging closer to the application fields with investigating the possibilities that compressed sensing and holistic (software and hardware level) optimization could provide for FET based sensor arrays to mitigate their low SNR.
H H H H H H H H H H H H H H H H
a)
b)
c)
d)
metal
layers
bulk
H-shaped
ant.
U
gatref.
LNA
ADC
post-proc.
image
ant.
bias
hardwar
e
softwa
re
imag
e
Methods
Compressed sensing
The compressive sampling of a discrete signal is represented as the multiplication:
𝚽𝒙 = 𝒚
(1)where 𝚽 is an M by N random matrix containing only binary values with equal distribution. ′𝒙′ is the signal vector and 𝐲 is the vector of measurements. The signal can be reconstructed if a proper basis exists, in which the representation of the observed signal is sparse:
𝚿𝒂 = 𝒙.
(2)Here Ψ is the matrix of the special basis and a is the sparse representation of the signal x. Exploiting this extra information one can minimize according to the L0 norm, that is finding an a vector with the most zero components.
Substituting (2) into (1), the problem formulated as:
𝒂
∗= arg min
𝒂
‖𝒂‖
0𝑠. 𝑡. 𝚽 𝚿𝒂 = 𝒚.
(3)To solve the combinatorial problem above several techniques were examined. For instance the L2 and L1 optimization and alternating projection methods based on smoothed zero norm functions.
We call the signal k-sparse if 𝒂∗ has only k number of non-zero elements or in practice k number of elements that are less than a given ε.
L0, L1 and L2 norm of the vector 𝒗:
‖𝒗‖
0=
{# of
𝑣
𝑖-s that are greater than 0}
(4)
‖𝒗‖
1= ∑|𝑣
𝑖|
𝑛 𝑖=1(5)
‖𝒗‖
2= √∑ 𝑣
𝑖2 𝑛 𝑖=1(6)
The sparsity is denoted by 𝑠 and 𝑠 = ‖𝒗‖0. I note that the “L0 norm” is not a true norm from the mathematical sense, as it does not fulfill all the axioms of a norm. The smoothed-L0 norms utilize some function f – other than the absolute value – in order to make the problem treatable:
‖𝒗‖
𝑠0= ∑ 𝑓(𝑣
𝑖)
𝑛𝑖=1
(7)
Cross validation
Cross validation (CV) has several applications within CS and has rigorous mathematical background. However these works focus mainly on the approximation error estimation, and aiding the choice of parameters like the number of measurements or the assumed sparsity.
On the one hand, I investigate cross validation as a tool for reducing the noise of the reconstruction. In the end, this increases the SNR of the resulting images.
On the other hand, the low incident radiation implies we have to consider over sampling as well. I suggest, cross validation as an efficient way to integrate oversampling data with the compressed sensing based reconstruction framework. This way we can improve on the standard L2
minimization (or least squares solution) results.
By usual compressed sensing imaging thorough cross validation is too expensive. Yet, in our case N is relatively small, meaning that the arising computational burden is tractable despite of the O(L·N·log(N) ) or in best case O(L·N) algorithms (here L is the order of CV).
By the suggested cross validation I divide the measured data set, D into two subsets D1 and D2. I perform the reconstruction using only D1 (ignoring the
elements of D2) and may estimate the error of the candidate solution based
on D2, then I repeat the process with a different subset of another division.
These iterations result in several ‘candidate’ solutions that can be combined on various ways to create the final image e.g. substitute the median of pixels or sum them weighted by their calculated error. The described technique belongs to thesis 1.2.
Figure of merit
The performance of terahertz detectors is characterized by the noise equivalent power (NEP), since it incorporates both the noise power level of the detector and its responsivity as well:
𝑁𝐸𝑃
𝑑𝑒𝑡𝑒𝑐𝑡𝑜𝑟=
𝑛𝑜𝑖𝑠𝑒 𝑝𝑜𝑤𝑒𝑟
𝑟𝑒𝑠𝑝𝑜𝑛𝑠𝑖𝑣𝑖𝑡𝑦
=
𝑃
𝑛𝑜𝑖𝑠𝑒𝑈
𝑥𝑃
𝑖𝑛|
𝑥=0(8)
where 𝑈𝑥 is the voltage response of the detector at 𝑥 input power. NEP
assumes 1 Hz sampling frequency that means 0.5s integration time.
In this work I concentrate on the noise part of this performance indicator, thus it is easier to handle the different components by their noise figure (NF):
𝑁𝐹 = 10 𝑙𝑜𝑔
𝑆𝑁𝑅
𝑖𝑛𝑆𝑁𝑅
𝑜𝑢𝑡= 10 𝑙𝑜𝑔
𝑇
𝑜𝑓𝑓+ 𝑇
𝑜𝑛𝑇
0(9)
𝑇 =
𝑃
𝑛𝑜𝑖𝑠𝑒𝐵𝑘
𝐵(10)
The noise figure of a component depends on the presented load and the given formula regards to the matched case. 𝑇𝑜𝑓𝑓, 𝑇𝑜𝑛 are the noise temperature of
the component in OFF and ON state respectively, where as 𝑇0= 290𝐾 is
the reference noise temperature. 𝐵 stands for the bandwidth at which the noise figure measurement is carried out and 𝑘𝐵 is the Boltzmann constant.
The noise temperature (𝑇) assumes additive, white noise. In this case, it is an acceptable estimation to handle the noises in a lumped form, if the measured bandwidth is restricted to a narrow portion of the frequency range, because flicker noise can be significant. To make easy comparisons to other indicators (e.g. NEP), one can use the following approximation, to calculate the noise power of the low noise amplifier:
However in an application environment the specification of the imaging system is usually described at a higher level, controlling only the quality of the results.
The resulting image SNR is taken as the main figure of merit regarding image quality. It is calculated according to the standard form:
SNR
result= 10 𝑙𝑜𝑔
10‖𝐱
1‖
2‖𝐱
𝟏− 𝐱
𝐫𝐞𝐬‖
2 (12) where 𝐱1is the original image (represented as a column vector) and 𝐱resisthe result of the processing.
However I calculated also the L1 distance as well, which is proved to
approximate the image quality better:
𝐿
1error
result= 20 𝑙𝑜𝑔
10∑|𝐱
1|
Summary of conclusions
Thesis 1
SNR enhancement of imaging systems with
compressed sensing
I have shown that the application of compressed sensing (CS) as a
measurement scheme and a post-processing framework can increase
the overall signal to noise ratio (SNR) of field effect transistor (FET)
based terahertz imaging systems.
Publication related to the thesis: [1]
Using CS in such an environment, where the theoretical conditions of the CS reconstruction (sparsity, 𝑀 > 𝑠 ∙ log(𝑁)) do not hold is not obvious. The guaranteed reconstruction error bounds are not valid or are so loose that makes them impractical for this scenario. (Determining the constants of upper bounds is also unreliable for such small images.)
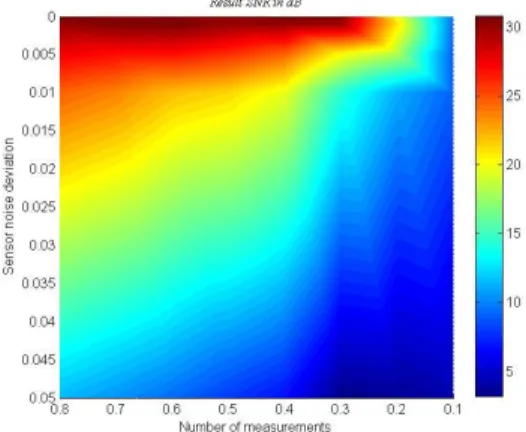
To reconstruct moderately structured (not sparse) and small images (16×16 - 4×4 pixels) from noisy measurements is a challenge. Fig. 3 and Fig. 4 demonstrate this phenomenon. These figures summarize the outcome of numerous simulated CS measurements and image reconstructions, which mimic sensors with various signal-to-noise ratio and reconstructions involving different amount of measurement data relative to the total pixel count. The colorbar shows the resulting image SNR in dB. If we compare the output images to the original one, then the yellow part of the field indicates the region, which already has visually acceptable quality in these executions.
Fig 4 illustrates the effect of increasing high frequency components in the sample image. On the left part one can see the outcome of another assembly of simulations producing a similar image as Fig. 3, but here, visualized as a surface. On the right part of the figure the same simulation executed on an input image with higher entropy. The two object have similar maxima, but the right one is much sharper indicating that the CS framework tolerates noise much less in this case.
To prove that the reconstruction works under these harsh conditions I have tested the performance of CS reconstruction algorithms whether they are capable to outperform the least-square solution of the problems or not. I have investigated the parameter space determined by the noise variance, the size of the image, the M/N ratio and the entropy of the sampled image. I found that even with general algorithms there exist a small space where computationally more intensive methods yield considerable gain against L2 Fig. 3 It shows the usual performance (SNR in dB) of a CS algorithm on a structured target. On the vertical axis the sensor noise deviation is given relative to the maximal signal value in Y. The horizontal axis shows the number of measurements relative to the total number of pixels.
Fig. 4 These example CS reconstructions give an insight to the effect of low sparsity. On the left one can see the image SNR depending on the image size and image noise. On the right, I depicted the resulting SNR of the same algorithm, but sampling an image with higher entropy – indicating a richer surface texture. Their maximums are close to each other, but the latter became much sharper that is, it tolerates noise much less.
minimization. This is visualized in Fig. 5, where an obvious case is shown of a less structured object that was reconstructed with a smoothed-L0 minimization algorithm.
The potential of the CS technique for reconstruction in case of serially connected sensors
Thesis 1.1 I have shown that even a general smoothed L0-norm based algorithm can achieve gain over least-square reconstruction in case of small (0.25-3 kpixel), moderately structured (sparsity around 0.75N) images if the sensor noise deviation is below 0.01 and the compression ratio is between 0.1 and 0.3.
The SNR of the investigated system is approximately 46 dB at free space (given the SNR as a voltage ratio). However, it drops rapidly either in transmissive or reflective configuration by scanning a specimen that has greater spatial extension or includes dispersive layers.
The numerical simulations indicate that a system SNR between 31-36 dB is the practical lower limit of applying classical CS. These basic results gave grounds to further investigations.
Fig. 5 SNR gain of an alternate projecting algorithm over L2 minimization. (The colorbar shows the gain in dB). On the vertical axis the sensor noise deviation is given relative to a fixed maximal signal value of Y. The horizontal axis shows the number of measurements relative to the total number of pixels. This example makes obvious that for this type of application, even the classical CS based algorithms have advances in a restricted region.
Constructive algorithm to help exploiting the gain from the CS post-processing:
Thesis 1.2 I have given a general post-processing algorithm for terahertz measurements involving cross validation (CV) and maximal entropy driven filtering that increases the overall SNR of the CS reconstruction in the presence of noise.
Image noise cancels out by the addition of the pixel values, but sensor noise is a challenge for the sparsity driven reconstruction.
According to this, I have proposed to take more measurements than M by the acquisition. Then, one has the chance to create different datasets of the same size. Each candidate solutions 𝑥𝑀1, 𝑥𝑀2, … , 𝑥𝑀𝑘 should be within the
proven error of the reconstruction (an L2 ball). This is easy to see, for instance with the measure presented by Malioutov: assuming independent measurements, the new collection should induce always the same stopping condition.
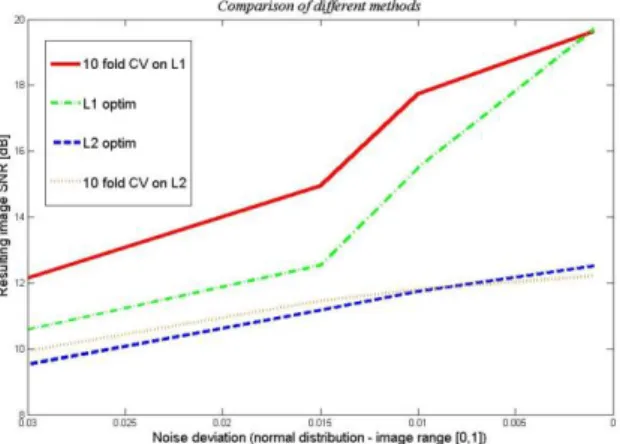
Assuming that reconstruction error results in equal distribution of the candidates within the above mentioned volume, averaging of appropriate candidates should decrease the error of the final result. The noise tolerance of the CV based post-processing can be seen in Figure 6.
However, the averaging of the candidate solutions coming from the CV rounds ends up with an image that is low pass filtered too heavily. Therefore, I have suggested maximum entropy based filtering or weighting to increase the entropy of the image to a more natural level with those pixels that have enough support among the results increasing the SNR of the outcome. According to this, we choose from the different candidate solutions those having the greatest entropy or rather weight them inversely proportional to their entropy at the averaging.
Fig. 6 Comparison of the different optimizations used for the reconstruction of moderately structured images. On the horizontal axis the standard deviation of the additive noise can be seen assuming normalized pixel values. The vertical axis shows the achieved image SNR relative to the noise free case. Figure 7 compares the normalized SNR of the proposed maximum entropy based filtering regarding a reweighting algorithm that works optimally, selecting the weights of the candidate solutions based on the original picture.
Fig. 7 The comparison of the different reconstruction algorithms: L1, CV and the CV + entropy based filtering at σ = 0.015. The proposed algorithm increases the robustness of the CV based reconstructions.
Thesis 2
Relation of CS to physical implementations of
terahertz imaging systems – holistic approach
I have shown, that in practical implementations of integrated FET based terahertz imagers, holistic optimization (system level, including both hardware structures and post-processing) results in SNR gain over the conventional component based optimization.
Publication related to the thesis: [2]
Serial, CS based THz FET detectors have advantage over uniform arrays
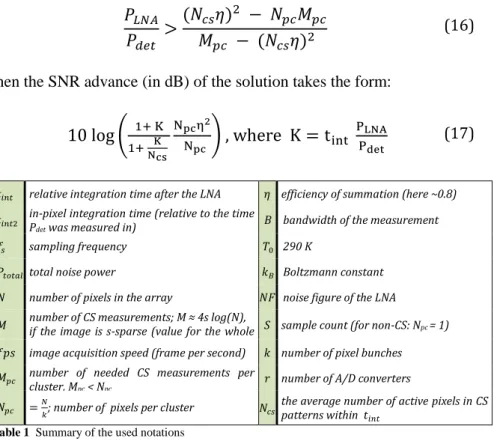
Thesis 2.1 I have proved, that serially connected sensors are advantageous in VLSI implementations of FET based, integrated terahertz imagers if special conditions hold for the detector NEP and the noise figure of the integrated LNA.
By utilizing the partially serialized coarse grain structures the total noise power of the system modifies to:
𝑃
𝑡𝑜𝑡𝑎𝑙= (𝑃
𝑑𝑒𝑡+
1
𝑁
𝑝𝑐𝑃
𝐿𝑁𝐴)
𝑁
𝑝𝑐𝑀
𝑝𝑐𝑁 𝑓𝑝𝑠
𝑡
𝑖𝑛𝑡𝑟 𝑓
𝑠(𝑁
𝑐𝑠𝜂)
2(14)
where the sample count of a generated pattern is:
𝑆 =
𝑀
𝑟 𝑓
𝑠 𝑝𝑐𝑁
𝑝𝑐𝑁 𝑓𝑝𝑠
(15) 𝑃𝑑𝑒𝑡= √𝐵 𝑁𝐸𝑃 and 𝑃𝐿𝑁𝐴≈ 𝑇0𝑘𝐵𝐵 (10 𝑁𝐹10− 1) stand for the detector noise
power and the LNA noise power, respectively. The other notations are indicated in Table 1. If the ratio fulfills the criteria
𝑃
𝐿𝑁𝐴𝑃
𝑑𝑒𝑡>
(𝑁
𝑐𝑠𝜂)
2− 𝑁
𝑝𝑐𝑀
𝑝𝑐𝑀
𝑝𝑐− (𝑁
𝑐𝑠𝜂)
2 (16)then the SNR advance (in dB) of the solution takes the form:
10 log (
1+ K 1+ K Ncs Npcη2 Npc)
, where
K = t
int PLNA Pdet (17)Table 1 Summary of the used notations
Lisauskas investigated the theoretical effect of induced current and proved that the sensor SNR increases at most to 1.35 times the unbiased detector transistor. Later on, Földesy gave a new model for the in-circuit behavior of FET detectors and proved that the measured value can be only smaller than that of the intrinsic open drain response and current does not affect the photoresponse.
In spite of these facts, I have studied the characteristics of biased detection at CS based architectures and I have given a general upper bound of the current loss in the CS case using the Földesy detector model and the results of thesis 2.1:
𝑡𝑖𝑛𝑡 relative integration time after the LNA 𝜂 efficiency of summation (here ~0.8) 𝑡𝑖𝑛𝑡2 in-pixel integration time (relative to the time Pdet was measured in) 𝐵 bandwidth of the measurement
𝑓𝑠 sampling frequency 𝑇0 290 K
𝑃𝑡𝑜𝑡𝑎𝑙 total noise power 𝑘𝐵 Boltzmann constant 𝑁 number of pixels in the array 𝑁𝐹 noise figure of the LNA
𝑀 number of CS measurements; M ≈ 4s log(N), if the image is s-sparse (value for the whole
image)
𝑆 sample count (for non-CS: Npc = 1)
𝑓𝑝𝑠 image acquisition speed (frame per second) 𝑘 number of pixel bunches
𝑀𝑝𝑐 number of needed CS measurements per
cluster, Mpc < Npc 𝑟 number of A/D converters
𝑁𝑝𝑐 =𝑁𝑘; number of pixels per cluster 𝑁𝑐𝑠 the average number of active pixels in CS patterns within 𝑡 𝑖𝑛𝑡
𝐿(𝑁𝑝𝑐, 𝐹𝑑𝑒𝑡) ≤ 10 log (
𝐹𝑑𝑒𝑡∙ 𝑁𝑝𝑐+ 1 + 2√𝐹𝑑𝑒𝑡∙ 𝑁𝑝𝑐
𝑁𝑝𝑐+ 𝐹𝑑𝑒𝑡+ 2√𝐹𝑑𝑒𝑡∙ 𝑁𝑝𝑐
) (18)
This bound is sharp, it equals the loss at 𝑃𝑃𝐿𝑁𝐴
𝑑𝑒𝑡 = √F𝑑𝑒𝑡𝑁𝑝𝑐. This bound gives
a maximal loss of 2.79 dB for 𝐹𝑑𝑒𝑡= 3 and 𝑁𝑝𝑐= 16.
However, if the low noise amplifier is efficient, for instance 𝐹𝐿𝑁𝐴= 1.2, the
loss is less than 13 %. The open drain efficiency of the summation (𝜂) is only 0.8. However, summation efficiencies of at least 0.9 are expected based the reported measurements of Elkhatib at appropriate gate-bias and load. Such efficiencies can balance the mentioned loss. Therefore, I conclude detector biasing can be a rational design choice.
Induced current in integrated systems
Thesis 2.2 I have proved that induced current can enhance overall system SNR in application oriented implementations of FET based FPAs.
In addition, current mode helps the system integration of the THz FET based FPAs, because the significantly greater drain current strengthens the driving capability of the detector allowing higher input load from the read-out circuitry and increases the signal level, what can make the LNA implementation easier. In the end, the current mode sensor tolerates the environmental noises better.
Biasing promises to cancel the loading effect implied losses of serial pixel blocks and enables greater pixel clusters. With this, current mode can further reduce the number of LNAs, the LNA noise contribution and enhance the compression ratio.
Fields of application
The results of thesis one can be applied for any CS based post-processing scheme, where small size, moderately structured, noisy images are to be reconstructed. Integrated FET based terahertz imaging is of this kind, especially, because the sensing is SNR critical and computationally expensive post-processing is acceptable.
Thesis two focuses on the overall performance of integrated arrays and helps the design of CS based terahertz focal plane arrays. It gives a guideline to determine the specifics of the built in LNA, exhibits the effect of a chosen read-out organization, and makes easier to calculate the achievable image SNR with a given configuration. It reveals the advances of CS architectures and delimit the parameter region, where it is applicable.
References
[1] D. Gergelyi and P. Földesy, "Digital Micromirror Device (DMD) projector based test bench for vision chips," in Cellular Nanoscale Networks and Their Applications (CNNA), 2010 12th IEEE International Conference On, Berkeley, CA, 2010.
[2] D. Gergelyi, P. Földesy and Á. Zarándy, "Scalable, Low-Noise
Architecture for Integrated Terahertz Imagers," Journal of Infrared, Millimeter, and Terahertz Waves, vol. 36, no. 6, pp. 520-536, 2015. [3] P. Földesy and D. Gergelyi, "Serially connected MOS terahertz
sensor array," in Infrared millimeter and terahertz waves (IRMMW), International Conference on, Mainz, 2013.
[4] P. Földesy, Z. Fekete, T. Pardy and D. Gergelyi, "Terahertz Spatial Light Modulator with Digital Microfluidic Array," in 26th Eurosensors Conference, appears in Journal of Procedia Engineering, Kraków, 2012.
[5] P. Földesy, D. Gergelyi, C. Füzy and G. Károlyi, "Test and
configuration architecture of a subthz cmos detector array," in Design and Diagnostics of Electronic Circuits and Systems (DDECS ), 2012 IEEE 15th Symposium on, Tallin, 2012.
[6] G. Károlyi, D. Gergelyi and P. Földesy, "Sub-Thz Sensor Array with Embedded Signal Processing in 90nm CMOS Technology," Sensors Journal, IEEE, vol. PP, no. 99, pp. 1-1, 2013.