1
SCHOOLING RESPONSES TO INCOME CHANGES: EVIDENCE FROM UNCONDITIONAL CASH TRANSFERS IN RWANDA
Ricardo Sabates*, Aditi Bhutoria, Rachel Sabates-Wheeler & Stephen Devereux
Ricardo Sabates, University of Cambridge (rs867@cam.ac.uk)
Aditi Bhutoria, Harvard Kennedy School (aditi_bhutoria@hks.harvard.edu) Rachel Sabates-Wheeler, Institute of Development Studies ( r.sabates-wheeler@ids.ac.uk)
Stephen Devereux, Institute of Development Studies (s.devereux@ids.ac.uk) (*) Corresponding Author:
184 Hills Road, Cambridge CB2 8PQ
Acknowledgements: The research on which this paper is based was commissioned by Concern Worldwide. The authors would like to thank Alice Simington, Odette Kampirwa Kweli and Chris Pain for their support, as well as the Graduation Programme participants in Rwanda for their time in responding to the surveys.
Keywords Educational Investment; Educational Access; Cash Transfers; Social Protection; Rwanda
2 Highlights:
Unconditional cash transfer enabled poor households in Rwanda to make educational investments
Proportion of school-age children with uniforms increased by 42 percentage points
Even after 3 years, more beneficiaries reported school uniforms for children
3 Abstract
This paper explores the short and medium term impacts of unconditional cash transfers on school-related choices for children of beneficiary households in Rwanda. We draw on an independent evaluation of the Concern Worldwide Graduation Programme, which supported beneficiaries with monthly cash transfers and livelihood training. Our study finds that the programme enabled poor households to overcome income constraints and, consequently, allowed them to make investments in education. However, since school attendance already exceeded 80 percent at baseline due to the government’s focus on universal access to basic education, the programme was unable to induce additional educational access. Thus, for children who remain out of school, income effects and policy efforts were found to be ineffective.
Keywords: Educational Investment, Educational Access, Cash Transfers, Social Protection, Rwanda
4 1. Introduction
Direct cash transfers to the poor are an important component of social protection policy, and an increasingly popular tool for development (Bastagli, Hagen-Zanker, Harman, & Barca, 2016; Fiszbein et al., 2009). They have been portrayed not only as a safety net to protect and redistribute resources to the poor, but also as an instrument that can facilitate ‘graduation’1 out of poverty (Daidone, Pellerano, Handa, & Davis, 2015; Sabates-Wheeler & Devereux, 2013). In other words, cash transfers are used around the world with two main objectives (as per Baird, Chirwa, McIntosh, & Ozler, 2010): (i) to provide poor households with a minimum threshold of income (reducing poverty in the very short term), and (ii) to improve the accumulation of human capital for the next generation (reducing poverty in the longer term). This, in turn, contributes towards building the recipients’ longer-term resilience.
There is a significant body of evidence supporting the success of cash transfers throughout most of the developing world (Bastagli et al., 2016; de Janvry, 2006; de Janvry, Finan, Sadoulet, & Vakis, 2006; UNICEF-ESARO/Transfer Project, 2015). With respect to the impact of cash transfers on human capital investment, evidence suggests that cash transfers reduce child labour and improve children’s health and food security (Case, Hosegood, & Lund, 2005; Duflo, 2003; Edmonds & Schady, 2012; Paxson & Schady, 2010). With respect to educational investments, however, the impact of cash transfers can be affected by whether they are condition or unconditional. Evidence from 50 studies, mostly from Latin
American contexts, demonstrates that conditional cash transfers are strongly
1 Graduation could refer to the exit from programmes after having reached a specific
administrative benchmark that signals the point at which a beneficiary is no longer eligible (threshold graduation). However, from a sustainability perspective graduation could represent a positive transformation in livelihoods (sustainable graduation), such that over time households become more resilient to different shocks and stressors (Sabates-Wheeler and Devereux 2013).
5
associated with improved school participation (Snilstveit et al., 2016), mainly because receipt of cash transfers is conditional on households sending their children to school.
Evidence on the effectiveness of unconditional cash transfers in improving school participation is mixed, particularly in sub-Saharan Africa (Bastagli et al., 2016; Filmer & Schady, 2009; Haushofer & Shapiro, 2013; Benhassine, Devoto, Duflo, Dupas, & Pouliquen, 2015). The evidence questions whether the cash influx could potentially remove financial barriers faced by households in
accessing education for their children. Even if primary education is universal and free, families across the world still face large out-of-pocket educational expenses for school materials, food, commuting and uniforms (Langsten, 2017; Lewin, Sabates, & Consortium for Research on Educational Access, 2011). In many cases these costs constitute a serious barrier to educational access for low-income families (Oketch, Mutisya, Ngware, Ezeh, & Epari, 2010). Sending a child to school also implies that the family would potentially lose substantial income from child labour. Furthermore, many households may not send their children to school if they perceive that the quality of educational provision is low or poor. Although cash transfers cannot address deficits in educational quality, they can stimulate the demand for education by helping to ease the direct and opportunity-related costs of education.
Theoretically, a reliable, unconditional transfer should enable households to build up assets and precautionary savings that could be used to maintain a minimum standard of living (Bastagli et al., 2016; Robertson et al., 2013; UNICEF-ESARO/Transfer Project, 2015). In cases where beneficiaries choose to use the cash transfers for investments to increase spending on the education of their children, cash transfers should further incentivise human capital accumulation for the next generation (Robertson et al., 2013; Handa & Milliano,
6
Africa have made an explicit reference to sustainable changes in educational spending, or other education outcomes as part of their programme objectives (Daidone et al., 2015). It is ambiguous whether the cash benefits received through unconditional cash transfers are spent on reducing the share of household costs of schooling that occur in the form of purchasing school materials, which in turn could improve other outcomes like school attendance (Ngatia, Evans, & Kremer, 2013).
To fill this knowledge gap, this paper focuses on the impact of an unconditional cash transfer on both educational investments – specifically, purchase of school uniforms -- as well as on school attendance for children. The main research question that we seek to answer is whether the additional income received through cash transfers enables parents to increase their educational expenditure, and if this helps them maintain or even improve educational access for their children over time. Empirically, this paper draws on data from the Concern Worldwide Graduation programme in Rwanda, which supported beneficiary households with unconditional cash transfers over a period of 12 months, and livelihood training for 24 months.
2. Rwanda’s Education Sector
In order to contextualize the research, this section briefly describes the main efforts of the Government of Rwanda to increase access and reach universal enrolment with 9 years of basic education, which was introduced at the end of 2008 (Ministry of Education, Republic of Rwanda, 2008), and the efforts to expand access to 12 years of education as highlighted in the Education Sector Strategic Plan 2013-2018 (Ministry of Education, Republic of Rwanda, 2013). Rwanda considers education a critical investment for the country’s future growth and development. This is evidenced by the increased share of the national budget
7
allocated to the education sector, which was projected to increase from 17% in 2012/13 to 22% in 2017/18 (Ministry of Education, Republic of Rwanda, 2013). The country has also committed to a long-term development plan, namely Vision 2020, with Vision 2050 currently under development. Within Vision 2020, one of the six pillars relates to the development of human resources and the creation of a knowledge-based economy. Recognising the fundamental role of the education sector, Rwanda is committed to achieving universal primary education, as also reflected in the Education Sector policy on basic education. Within this policy all children are entitled to 9 years of basic schooling and the Government of Rwanda is also committed to expanding access to 12 years of education by 2018 (Abbott, Sapsford, & Rwirahira, 2015).
Over the period 2010 to 2014, the percentage of children in Rwanda aged 3 to 6 years above the primary school entry age who had never been to school declined from 10% to 7%, while the percentage of children of primary school age not in primary school also declined from 10% to 7% (UNESCO, 2018). The primary school completion rate, measured as the proportion of children and young people aged between 3 to 5 years above the primary school graduation age who have completed primary school, increased from 43% in 2010 to 57% in 2014, while the lower secondary school completion rate increased from 17% in 2010 to 30% in 2014 (UNESCO, 2018). Over the same period, which coincides with the period when some Rwandan families received cash transfers, educational access in both primary and secondary school increased, indicating that the context in which households were being supported was one which was also driving increased enrolment as a national priority.
8
3. Concern Worldwide’s Graduation Programme in Rwanda
Concern Worldwide’s Graduation Programme was implemented in two rural sectors, Kibeho and Rusatira, in the Districts of Nyaruguru and Huye in South Province. Kibeho is a remote rural area but Rusatira is located near to the main road between Kigali and Butare. The sectors were selected based on an analysis of the poverty and vulnerability profiles of the two districts, taking into account the opinion of local government leaders and under the condition that the sector had not benefited previously from the Government’s Vision 2020 Umurenge Programme (VUP).2 Three sectors within each district were selected for the implementation of the programme and two sectors were identified for the selection of control group households.
The Concern programme is in line with the VUP, an integrated social protection programme designed to accelerate poverty eradication and promote rural economic growth. The Concern Graduation programme aims to “unleash the productive capacity” of poor households and strengthen their resilience to shocks3. It provides support to meet the basic needs of participants, to enable them to increase their productivity and to develop livelihood strategies for fostering sufficient income to exit and remain out of extreme poverty. It also aims to build confidence and enable the participants to plan for their future.
Further, the programme has adapted the Graduation Model4 to the Rwandan context. It combines protection and promotion aspects including cash transfers, sensitisation and reinforcement of savings activities for risk mitigation and
2 The Vision 2020 Umurenge Programme (VUP) is the Government of Rwanda’s flagship
social protection programme, providing unconditional cash transfers to poor households without labour capacity and temporary employment on community infrastructure projects for poor households with labour capacity.
3
Rwanda is already experiencing the effects of climate change (unpredictable rainfall pattern, prolonged dry season, flooding, storms that destroy crops, landslides and heavy erosion due to heavy rains).
9
potential investment in productive activities, skills development and the provision of resources. Such investments are expected to enable the development of productive Income Generating Activities (IGAs), reinforce community-based support mechanisms, enhance non-farm employment and develop capacity to graduate into access to credit.
Overall, the Graduation programme was designed to support extremely poor households by providing them with unconditional cash transfers to meet basic needs, but, at the same time it supported skills development to foster productive investments and livelihood choices. This paper places the Graduation programme within the literature on unconditional cash transfers and focuses on the choices made by beneficiaries to increase educational investments in their households as one of the multiple investment options available to beneficiary households.
Although households were able to make different choices with respect to meeting basic needs and investments in productive and non-productive activities, our interest is on educational investments as a key driver of skills formation, social mobility, future employment and future protection from children to their elderly parents. The other reason we focus on education relates to the firm commitments by the Government of Rwanda to achieve and maintain universal primary education and the concomitant view held by many Rwandans that education is important for the social and economic development of the country.
4. Hypotheses, Data & Analytical Approaches
4.1 Hypotheses
Based on literature reviewed above on the impacts of unconditional cash transfers, our knowledge of Concern Worldwide’s Graduation Programme, and our interest on educational investments for children’s education, we propose the following hypotheses about the potential impact of the programme:
10
1) Beneficiary households will increase educational investment in the form of purchasing school uniforms for their children in the short term as a result of the cash provided by the Graduation programme. This is a direct income effect.
2) School access, in the form of school attendance, should also be enhanced for children living in beneficiary households in the short run as the result of the cash provided by the Graduation programme provided that households face financial barriers for sending their children to school.
3) Over time, that is 24 months after the end of the cash support, we hypothesise that there may be further investments in school uniforms and potential sustained educational attendance for children of beneficiary households which could be explained by the sustained benefits of the Graduation programme on building beneficiaries’ livelihoods.
Note that we choose spending on school uniforms as our indicator of household investment in education, and school attendance by children in beneficiary households as our indicator of access to education, as these are the only indicators related to schooling which were collected as part of the evaluation of the Graduation programme. We acknowledge the limitations of focusing exclusively on these indicators when measuring schooling outcomes, but we believe that it provides further support to the evidence on the effectiveness of unconditional transfers on schooling outcomes, in particular over a period of time after the cash support has come to an end.
In order to test these hypotheses, we use a quasi-experimental research design with information collected longitudinally on beneficiary households at the start of the programme, 12 months after the start of the programme, which coincides with the end of the first year of the disbursement of the cash transfer, and 2 years after the end of the cash transfer period (or 3 years from the baseline). The ‘before and
11
after’ survey design enables us to measure changes in the outcomes of interest for beneficiaries and non-beneficiaries. This research design, however, does not enable us to attribute any changes unambiguously to the intervention. The extent that investments made by parents in school uniforms increase more for beneficiary households, or that educational access for children of beneficiary households improve more than for children in the control group, can only be interpreted as a probabilistic association of the programme with the outcomes of interest.
4.2 Sample Selection
The selection of beneficiary and control group households for the Concern programme was undertaken through a participatory process. Eligible households had to be in one of the bottom two Ubudehe categories5. Village leaders were asked to identify the poorest households amongst them and the lists they drew up were then discussed and agreed upon by all adult members of the communities. Concern workers then validated the selection to ensure that the poorest and most vulnerable households were identified. These households had at least one adult member who was able to work, were landless or had small land holdings (less than 0.25 of a hectare), had no cattle, were not supported by other programmes, were not engaged in any income generating activity and did not have a technical or a vocational school diploma. The villages to which the poor households belonged were classified as the beneficiary villages. Concern works in specific villages across Rwanda and from the ones that did not receive cash transfers, they selected villages similar to the targeted villages (based on socio-economic characteristics and belonging to the same districts) to form a control group.
5
Ubudehe is a participatory process where trained volunteers place all households in a village in one of six poverty categories from destitute to wealthy. The classification is agreed by all adults in the village. All households that are in Categories 1 and 2 are eligible for free Mutual Health Insurance.
12
Following this selection procedure, 800 beneficiaries were identified from 31 villages (19 villages in Rusatira District and 12 villages in Kibeho District) and 200 households were identified as a control group from 23 villages (15 villages in Rusatira District and 8 villages in Kibeho District). The sample size for the programme was selected with power calculations to account for changes in poverty indicators from which baseline estimates were high and expected to decline as a result of the Graduation programme.
Baseline data was collected for 793 beneficiaries and 190 control group households in August 2012, just before the programme started. For the purpose of this paper, we focus exclusively on households with school-aged children (7 to 16). Of 793 beneficiaries, 518 (65%) had children aged between 7 and 16 in 2012 and of 190 control group households, 121 (63%) had school-aged children.
After 12 months of receiving cash support, in August 2013, data was collected again but this time for a random selection of 50 % of the beneficiaries (395 households were reached) and for control group households (161 households were reached). The aim of this second survey was to measure changes in socioeconomic circumstances of programme beneficiaries that were likely to be the result of the support received. Data was collected on 257 beneficiary households and 105 control group households with school-aged children during the second round of data collection. Attrition for control group households with school-age children was only 16 households (121 from baseline reduced to 105 in second round). For beneficiary households with school aged children the target sample of 50% of the original sample was short by only 2 households (the target of 50% of 518 households was 259).
Finally, in August 2015, two years after the disbursement of the last cash transfer (or three years after the start of the programme) survey data was collected for 363 beneficiary households (231 with school-aged children) and 178 control group households (114 with school-aged children). The aim of this survey was to
13
measure the longer-term impact of the programme on different outcomes. Attrition for households with school-age children was 26 for beneficiaries and 7 for control group households. The sample attrition was low, at less than 10%.
This paper uses data from all three rounds, but is restricted to the sub-set of households with school-aged children (7 to 16). We investigate changes over time in household investments on school uniforms and educational access for children. These changes are measured at the end of the disbursement of the cash transfer and 2 years after the last disbursement of cash was received.
4.3 Key Variables for Analyses
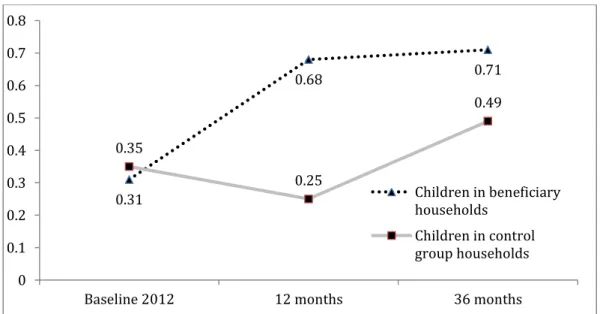
The paper uses two schooling outcomes which were measured as part of the evaluation of the programme: i) educational investment made by parents in terms of school uniforms, and ii) access to education for children in terms of school attendance. For educational investment in school uniforms, we use the answer to this question: “how many school-age children (7 to 16) have school uniforms?” Using information from the household roster on the total number of children aged 7 to 16 we estimate the proportion of school-aged children in the household who have school uniforms. Descriptive statistics in Table 1 show that the proportion of children in beneficiary households who had school uniforms increased from 31% to 68% between baseline and 12 months after the initial disbursement of the cash transfer, and increased further to 71% two years after the disbursement of the final cash transfer. In contrast, 35% of children in the control group had school uniforms during baseline, falling to 25% after 12 months but then rising to 49% after 36 months.
Information about educational access was obtained from this question on the household roster: “what is the main occupation of the member of the household?”. For the case of children aged 7 to 16 one possible option was “child in school in primary or lower secondary” which in the Rwandan context is from primary 1 to
14
secondary 3. Two other options were “child aged 7 to 16 at home” and “child 7 to 16 working”. As can be seen, information on whether the child was in school was aggregated into primary and lower secondary, thus we are unable to estimate age in grade attendance patterns. Nonetheless, we are able to identify whether children of this age group are in school and given that the age of the children was also recorded we are able to further examine school attendance for children aged 7 to 12, the vast majority of whom should be attending at primary level and children aged 13 to 16 for whom the level of school attendance is more difficult to predict given the large problem of over-age learners experienced in Rwanda.
Table 1 also shows the proportion of children from beneficiaries and control group in each of the age groups. For children aged 7 to 12, we find that the majority were likely to be attending school, with over 80% of children reporting to be in school across the beneficiary and control group households. For the older group aged 13 to 16, we find an equally high proportion of households reporting their children to be attending school, with over 80% across the treatment and control groups. Given the high proportion of children of this older age group attending school, and given that over-age in school is a significant issue in Rwanda, it is likely that most of these children are attending primary school.
<TABLE 1>
We selected a number of key control variables for analytical purposes. Before these variables are described, it is important to highlight that their identification depends on the way in which the key educational outcome of interest is measured as well as the analytical approach proposed. For investment in school uniforms, models are run at a household level as we do not have information about which child has a uniform. Hence we do not introduce child-level factors in these models. For school attendance, on the other hand, models are run at child level, as
15
this information is provided for each child who is a resident of the household. Hence information about each child’s age and gender is incorporated in the models.
At an individual level, information about the age of children enables us to undertake the analysis for different age groups. Children aged 7 to 12 are likely to be in primary school, while children aged 13 to 16 could be in either primary or lower secondary school. At the individual level we also have information on child’s gender. At the household level, we have information on education for the head of the household, measured in years of formal schooling, and the value of assets for the household as an indicator of wealth. Households reported the number of casserole dishes, basins, jerrycans, spoons, chairs and plates which they owned. A set of prices for these items were collected in the local market and are used to estimate the monetary value of the assets. The value in Rwandan francs is converted into pound sterling using 1,000 as an approximate exchange rate. This variable is linearized and the impact of extreme values is reduced by using a logarithm transformation. The main productive assets for which data was collected relates to livestock. We construct a tropical livestock units (TLUs) variable that is additive across different internationally agreed weights given to different categories of livestock. Conversion factors are: cattle = 0.7, sheep = 0.1, goats = 0.1, pigs = 0.2, chicken = 0.01.6 A final asset included is whether households had ownership of their dwelling (instead of being hosted for free, renting or living in a house provided by the government).
The final set of control variables included the gender of the head of the household, the size of the household and the dependency ratio, measured as the proportion of children under 6 and adults 65 and over who live in the household, relative to the number of adults aged 16 to 64, who are assumed to have labour
6Tropical Livestock Units are livestock numbers converted to a common unit (in 2005). Factors
16
capacity. These three variables are important as the Graduation programme targeted female headed households as well as households with labour capacity (according to the inclusion criteria described above). Descriptive statistics for these variables are shown in Table 2.
<TABLE 2>
4.4 Analytical Approach
Analytically, we first investigate whether there are systematic differences between households with school age children who were beneficiaries of the programme and households also with school age children who were part of the control group. Since the selection of treatment and control group villages was not random, it was likely that there were differences between households within selected villages at baseline. Therefore, we utilised propensity score matching (PSM) techniques (Dehejia & Wahba, 1999; Heckman, Ichimura, & Todd, 1997; Rosenbaum & Rubin, 1983) to deal with these initial differences and to see if we could find a common support for estimation of the programme effects.
In our particular case, PSM involved estimating a binary treatment model (in our case a logit model) that predicted the probability of each household being part of the Graduation programme as a function of observed characteristics. The variables included in the analysis are those that influence simultaneously the participation in the Graduation programme and educational investment on school uniforms as well as school attendance for children. We used Stata 13 and the Stata commands pscore (to identify the matching).
In order to estimate differences in the proportion of children who have school uniforms between beneficiary households and control group we use difference in differences estimation. We also use differences in differences estimation to investigate school attendance for children aged 7 to 12 and 13 to 16 who reside in
17
beneficiary households and those who reside in control group households. We assessed difference in differences by the formula:
CONTROL ht BEN ht CONTROL ht CONTROL ht CONTROL ht BEN ht BEN ht BEN ht Y Y Y Y Y Y Y Y 1 and 1 (1)
where Y stands for the outcome of interest, h stands for household, t is time, BEN denotes beneficiaries and CONTROL denotes control group households. In this paper, t-1 covers either the period 2012 against 2013 or 2012 against 2015, depending on whether we are estimating the short or medium term differences.
The difference in these differences () is an estimate of the potential impact of the programme. This estimate is unbiased under several assumptions, one of which requires random allocation of households to the programme to minimise systematic differences between programme participants and control group households. Since these differences are likely to emerge as the programme was not intended to support beneficiaries at random, we handle this potential bias by introducing controls for the characteristics of households and regional controls. The difference in difference parameter is then estimated using the equation of the form: ht ht h h ah T T Time X u Y * 1 (2)
where Th is a binary dummy variable indicating difference between beneficiaries and non-beneficiaries and Time is a binary dummy variable indicating the period after the programme. The parameter is the difference in the average level of the educational outcome of interest before and after the introduction of the programme, i.e. the difference in differences estimator. The parameter β is the estimated difference in the level of educational outcomes in
18
baseline between beneficiaries and control group. If this estimate is positive it indicates that beneficiaries were better off in their initial level of educational outcomes than control group households. If the parameter is negative, this is less of a problem as it indicates that during initial conditions beneficiaries were worse off than control group in terms of their initial level of educational outcomes for children. The matrix X contains child level characteristics (for school attendance only) and household level characteristics which are incorporated in the estimation, to condition for observable differences between beneficiaries and control households. The estimation also includes regional controls by using a set of dummy variables for different sub-regions (known as Cells in Rwanda).7
5. Results
5.1 Comparability of treatment and control households
As expected, given the non-random selection of participants into the programme, Table 3 shows systematic differences in observable characteristics between beneficiaries and control group households who have children of school age at baseline. We find that proportionally, beneficiaries were more likely to come from larger households compared with the control group. We also find the value of assets to be significantly larger for beneficiary households compared to control group. However, with respect to the other observable factors, such as female headed household, dependency ratio, education of the head of the household, total livestock units and ownership of shelter we do not find statistical differences between treatment and control group households.
7 Methodologically, our difference in differences approach enables us to establish changes at
two particular points in time relative to baseline measures. Other approaches such as growth curve modelling could allow for a more complete account of the nature of change across the three points in time. Based on information shown in Table 1, our results are unlikely to change using this alternative methodology.
19 <TABLE 3>
The previous results highlight that some of the factors underlying observable differences between treatment and control group households could introduce different sources of bias into our models. In particular, beneficiaries coming from larger households could make lower investments in school uniforms for children. Similarly, greater asset value in favour of beneficiaries could indicate a potential source of bias towards increased investment in children’s education, and potentially improved access to education due to more privileged wealth position of beneficiaries relative to control group. The sources of bias are not consistently placing beneficiaries at a position of advantage or disadvantage relative to the control group. Other factors do not seem to play a significant role in determining observable differences between beneficiary households with school aged children and control group households with school aged children.
Therefore, in order to find a matched sample, the logit model specification is checked to test the equality of the mean and standard deviation of the observed characteristics across beneficiaries and control group households. This test is called the balancing propensity test (Dehejia & Wahba, 1999; Heckman et al., 1997; Rosenbaum & Rubin, 1983).
<TABLE 4>
The next step in the PSM involved testing the ‘match’. This means using the propensity scores estimated in the first instance to identify control group households that compare to beneficiaries (i.e. with the closest propensity score values) using the ‘nearest neighbour’ algorithm. The balancing property is satisfied for beneficiaries versus control group households. The number of households in each of the blocks of the propensity score is shown in Table 4. As
20
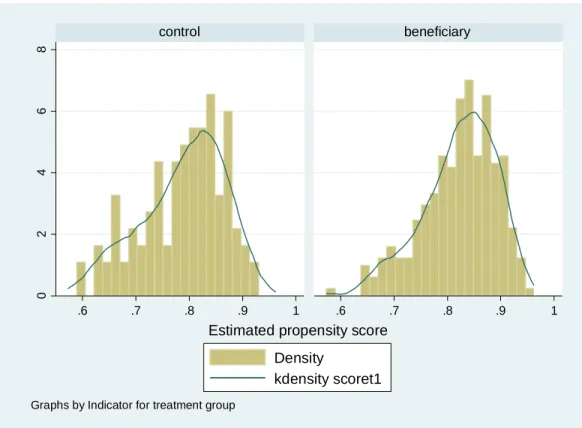
can be seen, we have some differences in the proportion of beneficiaries and control group for the lowest and highest bounds. For the lowest bound we have 10% of the control group households and 7% of the beneficiary households. As the propensity score increases we demonstrate an inverse relationship: the number of households who are participants of the programme who are comparable to control group increases. For the highest bound, we have 11% of beneficiary households and only 3% of control group households. The above information is also confirmed by showing the distribution of the propensity score according to beneficiaries and control households (see Figure 1). For households who participated in the programme we can see that the propensity score distribution is skewed to the right, more so than the distribution for control group households.
<FIGURE 1>
Although there are systematic differences according to some of the observable factors between beneficiaries and control group, the use of propensity score matching enables us to provide a more accurate estimate of the differences in educational investment in school uniforms made by households as well as school attendance for children of beneficiaries and control group households.
5.2 Household investment in school uniforms for children aged 7 to 16
In Table 5, we test whether participation in the Graduation programme increased the proportion of school age children with uniforms 12 months into the programme, which coincided with the end of the disbursement of cash for beneficiary households, relative to control group. The difference-in-differences parameter estimate indicates that the proportion of school age children with school uniforms increased by 42 percentage points after 12 months of receiving cash transfers in beneficiary households. Table 5 also shows that 2 years after
21
leaving the programme, i.e., not receiving cash transfers, a significantly higher proportion of beneficiaries have children with a school uniform. However, the gap over time in the proportion of children who have school uniforms between beneficiaries and control group has declined. Almost no further beneficiaries have invested in school uniforms, whereas the proportion of control group households who had invested in school uniforms during the final 24 months of the evaluation nearly doubled (see Figure 2).
Among other results in Table 5 we find that there were no statistical differences at baseline between the proportion of children in beneficiary and control group households who had uniforms. This is important as it indicates that beneficiaries and control group households started at a similar level of this outcome variable. The two key controls that are statistically associated with the proportion of children with school uniforms are household size and the value of assets. Larger households are estimated to have a lower proportion of children with school uniforms. Similarly, wealthier households, as indicated by the value of their household assets, have a higher proportion of children with school uniforms. The only other factor which also predicts investment in school uniforms over the medium term is total livestock units, whereby household with larger livestock holdings have a higher proportion of children with school uniforms. Many studies have been done about the effects of school uniforms on various aspects of children's lives. Some research shows that wearing uniforms is positively associated with students’ perceptions of the school environment (Murray, 1997) and increased attendance (Evans, Kremer, & Ngatia, 2013; Gentile & Imberman, 2011).
22
5.3 School attendance for children aged 7 to 16
Table 6 shows estimated parameters for the likelihood of children (ages 7-16) to be in school, focusing mainly on the difference between treatment and control groups over time. Results show that the difference-in-difference coefficient for whether children are in school is not significant across all age groups, whether participants were 12 months or 36 months into the programme. Hence, we fail to reject the null that there is a statistically significant difference between children living in beneficiary households and those in control group households on their likelihood to be in school.
<TABLE 6>
Specifically, primary and lower secondary school-aged children (7-12 years) who come from households with more assets are more likely to be in school. Even for the 13-16 year olds, wealth proves to be a key determinant of access. Out of the included controls for both age groups, the age and gender of the child are statistically significant, indicating that older girls in this age group are more likely to be in school. Moreover, within this cohort, those in large households are less likely to be in school. Interestingly, education of the parents is not found to be statistically significant. Large regional differences in access to school have also been found across all ages. The results remain consistent over time.
6. Discussion and Conclusion
This paper set out to investigate if parents who receive unconditional cash transfers spend some of this money to undertake educational investments for their children. The study was motivated by the need to generate rigorous evidence on the longer-term impact of programme support, which we addressed in this study by measuring outcomes at 12 months and 36 months after the transfers started.
23
We found significant positive impacts on parental spending on school uniforms, mostly at the end of the cash transfer period.
The paper benefits from a quasi-experimental design in which households were selected to participate in the programme and a comparable control group was also followed over the same period. The selection into treatment and control groups was not done at random, and therefore the paper incorporates control variables to partially deal with time-variant confounding factors. The paper does not claim causality, but highlights important differences between households.
Results from this paper point to the potential effects of cash transfers on educational investments in terms of educational inputs, such as school uniforms. These complementary investments can be viewed as important for removing barriers to accessing education, particularly financial barriers. However, we do not find that the removal of financial barriers makes beneficiary families more likely to send their children to school. There are several possible reasons for this result. First, educational access was never an explicit purpose of the programme. Therefore, the programme did not generate the incentives for beneficiaries to support education for their children. A second reason, which is more technical, could be the lack of power to obtain statistical significance in the results of this study given that the access to school during baseline was already high (over 80 percent as suggested by descriptive statistics).
Third, the particular context of Rwanda could shed some light on why the programme had no effect on school access. During the study period, the Government of Rwanda had been investing heavily in education as a move towards the achievement of the Millennium Development Goals (Abbott et al., 2015), possibly curbing any incentives from parents to use the additional cash to send their children to school. A fourth possible explanation is that the proportion of children in school is already high, as over 80% of children within the households were reported to be in schools at baseline. It is possible that in this
24
sample, children who were not in school faced non-financial access barriers. Therefore, the cash transfer programme, while supporting investment in education for those already in school, was not enough to stimulate educational access for marginalised, hard-to-reach children.
These findings are aligned with those from numerous evaluations of cash transfer programmes, in Africa and elsewhere. Cash transfers alleviate income constraints in poor households. Recipients allocate cash transfers to consumption needs and to investments in household income-generating activities as well as in human capital, notably costs of education and health care. In this case study from the Graduation programme in Rwanda, participants’ investment of cash transfers in education is clearly demonstrated by purchases of school uniforms for their school-age children. This finding supports evidence from elsewhere, that poor households invest cash transfers in their children’s education, even without a conditionality that requires them to do so.
On the other hand, cash transfers are of limited value and are therefore used mainly for consumption, especially by extremely poor recipients. In this case study, the lack of discernible impact of cash transfers on indicators of educational access reveals the dominance of the broader policy context. Government policies promoting universal basic education were already ensuring high levels of access in Rwanda. Cash transfers from the Graduation programme supported complementary costs such as school uniforms, rather than financing access to education directly.
25 References
Abbott, P. A., Sapsford, R., & Rwirahira, J. (2015). Rwanda’s potential to achieve the millennium development goals for education. International Journal of Educational Development, 40, 117–125.
https://doi.org/10.1016/j.ijedudev.2014.12.007
Baird, S., Chirwa, E., McIntosh, C., & Ozler, B. (2010). The short-term impacts of a schooling conditional cash transfer program on the sexual behavior of young women. Health Economics, 19 Suppl, 55–68.
https://doi.org/10.1002/hec.1569
Bastagli, F., Hagen-Zanker, J., Harman, L., Barca, V., Sturge, G., & Schmidt, T. (2016). Cash transfers: what does the evidence say? Retrieved from
https://www.odi.org/sites/odi.org.uk/files/resource-documents/10749.pdf Benhassine, N., Devoto, F., Duflo, E., Dupas, P., & Pouliquen, V. (2015).
Turning a Shove into a Nudge? A “Labeled Cash Transfer” for Education. American Economic Journal: Economic Policy, 7(3), 86–125.
https://doi.org/10.1257/pol.20130225
Case, A., Hosegood, V., & Lund, F. (2005). The reach and impact of Child Support Grants: evidence from KwaZulu-Natal. Development Southern Africa, 22(4), 467–482.
Daidone, S., Pellerano, L., Handa, S., & Davis, B. (2015). Is Graduation from Social Safety Nets Possible? Evidence from Sub-Saharan Africa. IDS Bulletin, 46(2), 93–102.
de Janvry, A., Finan, F., Sadoulet, E., & Vakis, R. (2006). Can conditional cash transfer programs serve as safety nets in keeping children at school and from working when exposed to shocks? Journal of Development Economics, 79(2), 349–373. https://doi.org/10.1016/j.jdeveco.2006.01.013
26
de Janvry, A., & Sadoulet, E. (2006). Making Conditional Cash Transfer Programs More Efficient: Designing for Maximum Effect of the Conditionality. The World Bank Economic Review, 20(1), 1–29. https://doi.org/10.1093/wber/lhj002
Dehejia, R. H., & Wahba, S. (1999). Causal Effects in Nonexperimental Studies: Reevaluating the Evaluation of Training Programs. Journal of the American Statistical Association, 94(448), 1053–1062.
https://doi.org/10.2307/2669919
Duflo, E. (2003). Grandmothers and Granddaughters: Old‐ Age Pensions and Intrahousehold Allocation in South Africa. The World Bank Economic Review, 17(1), 1–25. https://doi.org/10.1093/wber/lhg013
Edmonds, E. V., & Schady, N. (2012). Poverty Alleviation and Child Labor. American Economic Journal: Economic Policy, 4(4), 100–124.
https://doi.org/10.1257/pol.4.4.100
Evans, D., Kremer, M., & Ngatia, M. (2013). The impact of distributing school uniforms on children’s education in Kenya (No. 81501) (pp. 1–2). The World Bank. Retrieved from
http://documents.worldbank.org/curated/en/447291468278360392/The-impact-of-distributing-school-uniforms-on-childrens-education-in-Kenya Filmer, D., & Schady, N. (2009). School enrollment, selection and test scores.
World Bank Policy Research Working Paper Series, Vol. Retrieved from http://papers.ssrn.com/sol3/papers.cfm?abstract_id=1437950
Fiszbein, A., Schady, N., Ferreira, F. H. G., Grosh, M., Keleher, N., Olinto, P., & Skoufias, E. (2009). Conditional cash transfers: reducing present and future poverty (No. 47603) (pp. 1–384). The World Bank. Retrieved from
http://documents.worldbank.org/curated/en/914561468314712643/Conditio nal-cash-transfers-reducing-present-and-future-poverty
27
Uniforms on Student Achievement and Behavior (Working Paper No. 17337). National Bureau of Economic Research.
https://doi.org/10.3386/w17337
Handa, S., & Milliano, M. (2015). The Impact of Social Cash Transfers on Schooling in Africa: An Update from the Transfer Project (Research Brief). The Transfer Project. Retrieved from https://transfer.cpc.unc.edu/wp-
content/uploads/2015/09/TransferProjectBrief_2015-01_SCTImpactSchooling.pdf
Haushofer, J., & Shapiro, J. (2013). Household Response to Income Changes: Evidence from an Unconditional Cash Transfer Program in Kenya. Massachusetts Institute of Technology, 57.
Heckman, J. J., Ichimura, H., & Todd, P. E. (1997). Matching As An Econometric Evaluation Estimator: Evidence from Evaluating a Job Training Programme. The Review of Economic Studies, 64(4), 605–654.
https://doi.org/10.2307/2971733
Langsten, R. (2017). School fee abolition and changes in education indicators. International Journal of Educational Development, 53(C), 163–175. Lewin, K., Sabates, R., & Consortium for Research on Educational Access, T. &
E. (2011). Changing patterns of access to education in Anglophone and Francophone countries in Sub Saharan Africa: is education for all pro-poor?
Ministry of Education, Republic of Rwanda. (2008). Nine Years Basic Education Implementation. Kigali, Rwanda. Retrieved from
http://www.mineduc.gov.rw/fileadmin/user_upload/9_year_B_E.pdf Ministry of Education, Republic of Rwanda. (2013). Education Sector Strategic
Plan 2013/14-2017-18 (p. 137). Kigali, Rwanda. Retrieved from
http://planipolis.iiep.unesco.org/sites/planipolis/files/ressources/rwanda_edu cation_sector_strategic_plan_2013-2018.pdf
28
Murray, R. K. (1997). The Impact of School Uniforms on School Climate. NASSP Bulletin, 81(593), 106–112. https://doi.org/10.1177/019263659708159314 Ngatia, M., Evans, D., & Kremer, M. (2013). The impact of distributing school
uniforms on children’s education in Kenya (No. 81501) (pp. 1–2). The World Bank. Retrieved from
http://documents.worldbank.org/curated/en/447291468278360392/The-impact-of-distributing-school-uniforms-on-childrens-education-in-Kenya Oketch, M., Mutisya, M., Ngware, M., Ezeh, A. C., & Epari, C. (2010). Free
Primary Education Policy and Pupil School Mobility in Urban Kenya. International Journal of Educational Research, 49(6), 173–183. https://doi.org/10.1016/j.ijer.2011.01.002
Paxson, C., & Schady, N. (2010). Does Money Matter? The Effects of Cash Transfers on Child Development in Rural Ecuador. Economic Development and Cultural Change, 59(1), 187–229. https://doi.org/10.1086/655458 Robertson, L., Mushati, P., Eaton, J. W., Dumba, L., Mavise, G., Makoni, J., …
Gregson, S. (2013). Effects of unconditional and conditional cash transfers on child health and development in Zimbabwe: a cluster-randomised trial. The Lancet, 381(9874), 1283–1292.
https://doi.org/10.1016/S0140-6736(12)62168-0
Rosenbaum, P. R., & Rubin, D. B. (1983). The Central Role of the Propensity Score in Observational Studies for Causal Effects. Biometrika, 70(1), 41–55. https://doi.org/10.2307/2335942
Sabates-Wheeler, R., & Devereux, S. (2013). Sustainable Graduation from Social Protection Programmes. Development and Change, 44(4), 911–938.
https://doi.org/10.1111/dech.12047
Snilstveit, B., Stevenson, J., Menon, R., Phillips, D., Gallagher, E., Geleen, M., … Jimenez, E. (2016). The impact of education programmes on learning and school participation in low-and middle-income countries.
29
UNESCO. (2018). World Inequality Database on Education • Rwanda. Retrieved September 1, 2018, from
https://www.education-inequalities.org/countries/rwanda#?dimension=all&group=all&year=2014& population=yes
UNICEF-ESARO/Transfer Project. (2015). Social Cash Transfers and Children’s Outcomes: A Review of Evidence from Africa. Retrieved from
https://www.unicef.org/esaro/Social_Cash_Transfer_Publication_ESARO_ December_2015.pdf
30 Tables
Table 1: Descriptive statistics on key outcome variables
Baseline
12 month survey
36 month survey
Proportion of Children with School Uniforms
Children in beneficiary households 0.31 0.68 0.71
Children in control group households 0.35 0.25 0.49
Proportion of Children aged 7 to 12 Attending School
Children in beneficiary households 0.83 0.86 0.82
Children in control group households 0.88 0.89 0.84
Proportion of Children aged 13 to 16 Attending School
Children in beneficiary households 0.82 0.85 0.78
Children in control group households 0.85 0.84 0.81
Source: Impact Evaluation Data Concern Worldwide Rwanda, Cohort 2, 2012.
Table 2: Descriptive statistics for the control variables measured at baseline
Control variables Beneficiaries Control
Gender of the child: Girl (%) 51.14 48.65
Female headed households (%) 47.43 51.86
Household size
(mean number of individuals in a household)
6 6
Dependency ratio 0.82 0.78
Education of household head (mean number of years in education)
2.36 2.40
Total livestock units (mean value in TLUs)
0.054 0.031
Asset Value
(mean value in GBP)
13.07 7.84
House ownership (%) 54.22 58.95
31
Table 3: Estimated Parameters of Likelihood to Participate in the Programme
Beneficiaries versus Control Group Coef. Std. Err. Sig
Female headed household -0.25 [0.17]
Household size 0.17 [0.05] **
Dependency ratio -0.04 [0.13]
Max education head of household -0.05 [0.04]
Total Livestock Units 0.73 [0.90]
Total value of assets (in ln) 0.25 [0.09] *
House ownership -0.35 [0.18]
Constant -0.75 [1.08]
Source: Impact Evaluation Data Concern Worldwide Rwanda, Cohort 2, 2012. Notes: Asterisks **, *
indicate statistical significance at 1, 5% level, respectively.
Table 4: Number of Blocks and Number of Matched Households from the Beneficiaries and Control Groups.
Inferior block Households
Propensity
score Control Beneficiaries Total
0 12 36 48 0.5 1 2 3 0.6 18 33 51 0.7 36 131 167 0.8 54 275 329 0.9 4 60 64 Total 125 537 662
32
Table 5: Parameter estimates (S.E.) for the proportion of children with school uniforms by households (beneficiaries and control group)
Proportion of eligible children (7 to 16) with uniforms in a household
12 Month survey 36 Month survey
Baseline difference -0.0615 0.0115
[0.0771] [0.0701]
Change in control group over time -0.0780 0.0507
[0.0614] [0.0557]
Difference-in-Difference 0.420*** 0.278***
[0.0706] [0.0611]
Whether HH head = female -0.00974 0.000580
[0.0323] [0.0264] HH size -0.0273*** -0.0340*** [0.00984] [0.00799] Dependency ratio 0.00855 0.00724 [0.0224] [0.0225] Education of HH head -0.00512 0.000365 [0.00559] [0.00457]
Total Livestock Units 0.0477 0.0841*
[0.0801] [0.0464]
Asset Value 0.0418** 0.0377**
[0.0197] [0.0179]
House ownership -0.0150 -0.0105
[0.0317] [0.0276]
Regional Controls included? Yes Yes
Constant 0.178 0.130
[0.195] [0.177]
Observations 702 1,029
R-squared 0.211 0.210
Source: Impact Evaluation Data Concern Worldwide Rwanda, Cohort 2, 2012. Notes: Asterisks (*, **) indicate statistical significance at 5% and 1% level, respectively. Estimations account for clustered standard errors at village level.
33
Table 6: Parameter estimates (S.E.) for the likelihood of school attendance i.e. whether or not the child is in school (children aged 7 to 12 and 13 to 16)
7-12 years 13-16 years 12 month survey 36 month survey 12 month survey 36 month survey Baseline difference -0.0635 -0.0635 -0.0790 -0.0790 [0.0442] [0.0442] [0.0840] [0.0840]
Change in control group over
time 0.0292 0.0292 -0.00113 -0.00113 [0.0406] [0.0406] [0.0683] [0.0683] Difference-in-Difference -0.0519 -0.0519 -0.0735 -0.0735 [0.0473] [0.0473] [0.0773] [0.0773] Age 0.379*** 0.379*** 0.723 0.723 [0.0725] [0.0725] [0.478] [0.478] Age Squared -0.0174*** -0.0174*** -0.0278* -0.0278* [0.00372] [0.00372] [0.0168] [0.0168] Gender 0.0477** 0.0477** -0.0118 -0.0118 [0.0197] [0.0197] [0.0304] [0.0304]
Whether HH head = female 0.00159 0.00159 0.0105 0.0105
[0.0207] [0.0207] [0.0325] [0.0325] Household size -0.0118* -0.0118* -0.0153 -0.0153 [0.00618] [0.00618] [0.0104] [0.0104] Dependency ratio 0.0237* 0.0237* 0.00137 0.00137 [0.0139] [0.0139] [0.0384] [0.0384] Education of HH head -0.00157 -0.00157 -0.00157 -0.00157 [0.00366] [0.00366] [0.00576] [0.00576]
Total Livestock Units 0.0775* 0.0775* 0.0676 0.0676
[0.0432] [0.0432] [0.0489] [0.0489]
Log of Total Asset Value 0.0609*** 0.0609*** 0.0545** 0.0545**
[0.0149] [0.0149] [0.0221] [0.0221]
House ownership -0.0152 -0.0152 0.0437 0.0437
[0.0210] [0.0210] [0.0352] [0.0352]
Regional controls included? Yes Yes Yes Yes
Constant -1.609*** -1.609*** -4.202 -4.202
[0.376] [0.376] [3.373] [3.373]
Observations 1,214 1,214 532 532
R-squared 0.113 0.113 0.109 0.109
Source: Impact Evaluation Data Concern Worldwide Rwanda, Cohort 2, 2012. Notes: Asterisks (*, **) indicate statistical significance at 5% and 1% level, respectively. Robust standard errors in brackets.
34 Figures
Figure 1: Kernel Density of Propensity Score: Households in Beneficiary versus Control Group
Source: Impact Evaluation Data Concern Worldwide Rwanda, Cohort 2, 2012.
0 2 4 6 8 .6 .7 .8 .9 1 .6 .7 .8 .9 1 control beneficiary Density kdensity scoret1 D e n si ty
Estimated propensity score
35
Figure 2: Proportion of children with school uniforms by beneficiary/control households
Source: Impact Evaluation Data Concern Worldwide Rwanda, Cohort 2, 2012. 0.31 0.68 0.71 0.35 0.25 0.49 0 0.1 0.2 0.3 0.4 0.5 0.6 0.7 0.8
Baseline 2012 12 months 36 months
Children in beneficiary households
Children in control group households