NBER WORKING PAPER SERIES
CHILD CARE AND THE WELFARE TO WORK TRANSITION
Robert J. Lemke Ann Dryden Witte
Magaly Queralt Robert Witt
Working Paper 7583
http://www.nber.org/papers/w7583
NATIONAL BUREAU OF ECONOMIC RESEARCH 1050 Massachusetts Avenue
Cambridge, MA 02138 March 2000
This study is a product of the Wellesley Child Care Policy Research Partnership and the Child Care Bureau's Child Care Policy Research Consortium. Our work was supported by Wellesley College under Grant #90YE0006 from the Child Care Bureau, Administration for Children and Families (ACF), Department of Human Services (DHHS). The support of these organizations in no way implies their concurrence with our results. All errors are our own. The views expressed herein are those of the authors and are not necessarily those of the National Bureau of Economic Research.
© 2000 by Robert J. Lemke, Ann Dryden Witte, Magaly Queralt, and Robert Witt. All rights reserved. Short sections of text, not to exceed two paragraphs, may be quoted without explicit permission provided that full credit, including © notice, is given to the source.
Child Care and the Welfare to Work Transition
Robert J. Lemke, Ann Dryden Witte, Magaly Queralt and Robert Witt NBER Working Paper No. 7583
March 2000
JEL No. H24, I38, J22
ABSTRACT
We assess the role of child care in the welfare to work transition using an unusually large and comprehensive data base. Our data are for Massachusetts, a state that began welfare reform in 1995 under a federal waiver, for the period July 1996 through August 1997. We find that both the nature of the child care market and the availability of subsidized care and early education affect the probability that current and former welfare recipients will work. Regarding the child care market, we find that the cost, stability and quality of care matter. We also find that child care subsidies and some types of early education serve to increase employment. To be more specific, we find that increased funding for child care subsidies and the availability of full day kindergarten significantly increase the probability the current and former welfare recipients work.
Robert J. Lemke Ann Dryden Witte
Department of Economics Department of Economics
Florida International University Florida International University
Miami, FL 33199 155 Ocean Lane Dr., #812
lemker@fiu.edu Miami, FL 33149
and NBER
awitte@wellesley.edu
Magaly Queralt Robert Witt
Wellesley Child Care Research Partnership Department of Economics 155 Ocean Lane Dr, West Bldg. STE 812 University of Surrey
Miami, FL. 33149 Guildford
mqueralt@wellesley.edu Surrey GU2 5XH
United Kingdom r.witt@surrey.ac.uk
1. Introduction
In this paper, we consider the impacts of the child care market, child care subsidies and early childhood education programs on the probability of employment and the hours of work of current and former welfare recipients. Our work builds on previous work examining the impact of child care costs. We extend this work in a number of ways. First, we specifically consider the role of child care in welfare reform. Second, we expand the aspects of child care considered beyond costs to include quality and availability. Third, we consider the impacts of a broad range of child care programs designed to care for and educate low-income children. To be specific, we consider the roll of child care subsidies, Head Start and early education programs.
There is a large literature showing that the cost of child care plays a major role in the labor market decisions of women with children (e.g., see Averett, et al., 1997; Berger and Blank, 1992; Connelly, 1992; Johansen, et al., 1996; Kimmel, 1992, 1995, 1998; Myers and Heintze, 1999; and Ribar, 1992, 1995). However, paucity of data has not allowed assessment of the impact of other aspects of the child care market. Child care is a heterogeneous product and, as such, assessment of impacts requires measures of both the cost and the quality of care. Child care is also a location-specific good and so the availability of care in specific local areas may impact labor market decisions. Using previously unexploited data, we are able to consider the impact of the price, quality and availability of child care on the labor market decisions of the current and former welfare recipients in our sample.
It is widely believed that child care and early childhood education programs play a major role in welfare reform. Indeed, federal welfare reform legislation substantially revised and expanded funding for child care subsidies at the same time that it imposed work requirements and eliminated the entitlement to cash assistance. Since welfare reform, most state governments have not only expanded funding for child care subsidies but have also increased funding for early education programs. As far as we are aware, there is, at present, no published work that
considers simultaneously the impact of all of these varied programs.
We use a unique data set for Massachusetts, a state that began welfare reform in 1995 under a federal waiver, for the period July 1996 through August 1997 to carry out our analyses. The data set contains information from monthly interviews on almost 14 thousand current and former welfare recipients. We have added detailed information on the availability, price and quality of child care for each township using resource and referral agency data. We have
incorporated information on the availability, funding level and administration of both state and federal child care subsidy and early education programs. We have incorporated variables to control for other major policies (e.g., EITC, economic development), for the nature of local labor markets and community characteristics.
To briefly preview our results, we find that, as in previous work, increases in the costs of child care significantly decrease the probability that women with children will work. However, we find that the stability and quality of child care have much larger effects on the probability of work than do costs.
Consistent with recent work, we find that increased funding for child care subsidies is associated with increased probabilities that current and former welfare recipients will work. We also find that current and former welfare recipients living in areas with full-day kindergartens are more likely to work than recipients living in areas with part-day or no kindergarten. The
availability of typically part-day, part-year Head Start and Pre-K programs is associated with a decreased probability that the current and former recipients in our sample will work and a concomitant increase in the probability that they will be involved in training and education, which is more compatible with a part-day, part-year schedule.
The outline of the paper is as follows. In the next section, we describe welfare reform in Massachusetts. The two sections that follow describe our estimation techniques and the data we use. In Section 5, we describe our results and the final section contains our conclusions.
2. Massachusetts’ Welfare Reform
In April of 1995, the Commonwealth of Massachusetts requested a welfare reform waiver from the federal government. Massachusetts’ plan included job training, a work requirement, time limits, medical assistance, and centralization of the public assistance system. The waiver was granted except for time limits. Overseen by the newly formed Department of Transitional Assistance (replacing the Massachusetts Department of Public Welfare as of July 1, 1995), these reforms were initiated on November 1, 1995. In the following year, President Clinton signed the Personal Responsibility and Work Opportunity Reconciliation Act (PRWORA). PRWORA changed the landscape of the welfare system. PRWORA replaced the previous AFDC program with block grants from the federal government to the states and granted the states greater
Needy Families). Although some restrictions were placed on who is eligible to receive monies from the TANF block grants, states were given considerable leeway in setting up their eligibility requirements for assistance as well as the system used to determine the level of each family’s benefits. Two novel components of PRWORA are work requirements and time limits.
Massachusetts met the work requirements of PRWORA, and, with its passage, the state was also able (and now required for federal funding) to implement their previously requested time limits.1 In Massachusetts, anyone subject to the time limit is permitted to receive TAFDC (as the TANF program is called in Massachusetts) funds for a maximum of 24 months in any
consecutive 60 months. Anyone subject to work requirements must, within 60 days of receiving TAFDC funds, be actively involved in some type of work for at least 20 hours per week. If the person fails to find a job, she is required to perform 20 hours of community service per week. Although there are some other exceptions (mainly for the disabled and for teenaged parents), the Massachusetts program is straightforward. A TAFDC recipient is exempt from the time limits and the work requirement if her youngest child is under the age of two. The clock on time limits starts ticking on the youngest child’s 2nd birthday. The recipient remains work exempt, however, until her youngest child is six years old. It is important to note that these are separate
requirements. If one receives benefits while the youngest child is two and three, thus exhausting the time limits, the time limit deadline comes into effect and benefits are terminated even though the recipient would otherwise remain classified as work exempt for the next two years as her youngest child passes through the ages of four and five.
Massachusetts’ job training and education program, the Employment Services Program (ESP), is available to all TAFDC recipients. Participation in the ESP is voluntary if one is exempt from the work requirement and mandatory for those not exempt; however, all recipients are strongly encouraged to participate in the ESP. The program includes on-the-job training, job skill development, education, and a “structured job search” program. The structured job search portion of ESP, though originally state run, was completely privatized by the fall of 1998.
It is important to understand how the work requirement affects participation in the ESP. First, as long as the adult TAFDC recipient remains work exempt, she can enter job training and education programs paid for by the ESP. This includes continuing a high school education,
1
Under its waiver authority, the Commonwealth continues to operate other aspects of its TANF program, which in some ways conflict with PRWORA.
obtaining a GED, or even enrolling in a state-funded college for up to two years. Second, the education programs of the ESP are available to all TAFDC clients. However, clients subject to the work requirement must be working at least 20 hours a week within 60 days of receiving assistance. This means that any educational or training programs offered by the ESP must be attended in addition to working. Pursuing schooling (unlike job training or on-the-job training, which are less time intensive), therefore, becomes more difficult once the individual becomes subjected to the work requirement.
In addition to offering the ESP, the Department of Transitional Assistance also offers “state-standard” child care to anyone who is receiving TAFDC monies and is in need of child care; for example, to those employed, in school, actively seeking employment, or in job training. Upon the DTA’s authorization, the recipient receives a child care voucher that can be used to purchase either formal or informal child care. The vouchers are subject to a sliding-fee co-payment that depends on income needs, family size, and the amount of child care used.
Under the Massachusetts system, anyone receiving TAFDC assistance automatically is eligible to receive Medicaid (and vice versa). The DTA also has worked closely with the
regional transportation authorities to offer subsidized public transportation to TAFDC recipients. In addition to subsidizing travel on existing public transportation, the DTA oversaw the re-routing of buses (and the starting of new routes) and the implementation of shuttle systems.
When a TAFDC recipient’s case is closed due to exhaustion of her time limit or employment, she remains eligible to receive temporary medical assistance, (possibly) food stamps, transitional child care, transportation subsidies, and access to the structured job search program for at least one year. After one year of being off the TAFDC rolls, the above-mentioned programs are made available to previous TAFDC clients on an “income-eligible” basis.
3. Empirical Strategy and Estimation
Two questions are addressed in this paper. First, what factors matter in determining whether a welfare recipient works versus participates in training/education programs via the Massachusetts Employment Services Program? Second, what factors matter in determining how many hours are worked each week by those recipients who work? These questions are framed in light of the time limits that were imposed on December 1, 1996. Clearly the regulations promote training and education for those with children under two years old, as these recipients are exempt
from time limits and the work requirement. At the opposite end of the spectrum, it is a “work first” regulation for those with children over five years old, as these recipients are subject to time limits and the work requirement. In between the two extremes the regulations are mixed, i.e., recipients with children between two and five years old are subject to time limits, yet they are work exempt allowing them to pursue training / education if they so choose (a possibly riskier proposition since they will not receive public assistance monies after two years of support).
In addition to investigating the effects of the new welfare regulations, we also study how the child care market enters into the decisions of households. In particular we take into account the availability, cost, and quality of formal child care as well as some features of informal child care via friends and family and the state child care voucher system. We further include variables reflecting the availability of Early Childhood Education Programs (ECEs) such as Head Start, full-day kindergarten, and public grants targeted to caring for disadvantaged three and four year old children.
Our data is described in the next section. For clarity, however, it is useful to understand the sample of individuals for whom we have information. Ultimately we will have a longitudinal data set of almost 14,000 households and over 81,000 monthly observations. The data come from the child care voucher monthly billing records and the Department of Transitional
Assistance’s monthly interviews of social service recipients in Massachusetts. As the data come from both of these sources and are merged using family identifiers, our sample is of current child care voucher recipients who are also current or former TANF recipients. Thus, our results apply directly to this group of people. In particular, to be observed in our data set, the adult child care voucher recipient must be doing something “worthwhile” with her time from the Department of Transitional Assistance’s point of view − working, job training, education, or job search − in order to be currently receiving a child care voucher.
We offer two empirical models. First, because our data is limited to current and former TANF recipients who also receive child care vouchers, we consider a reduced form model of the probability of working vs. job training/education. Second, for those working, we consider a reduced form model of the weekly hours worked. We model working and hours worked as dependent on: human-capital/socio-demographic characteristics of the individual (H), characteristics of the formal market for child care (CC), policy and administrative variables related to the Massachusetts child care voucher system (VS), characteristics of ECEs (EE), other
public policy variables (PP), the costs of working (CW), local labor market conditions (LM), and a community-specific fixed effect (FE). Respectively, the two models can be written as:
(1) Prob. of Work = Probit( β1H +
α
1CC +γ
1VS + φ1EE + δ1PP + ξ1CW +κ
1LM + FE1 +ε
1)and, conditional on working,
(2) Hours Worked = β2H +
α
2CC +γ
2VS + φ2EE + δ2PP + ξ2CW +κ
2LM + FE2 +ε
2.As we observe households over time, the estimation of equations (1) and (2) must reflect unobserved family-specific attributes that may affect the unbiasedness and consistency of the estimation.2 The most commonly used estimators for models using longitudinal data are the fixed-effects and random-effects estimators. The fixed-effects estimator requires that the unobservable family-specific effect be constant over time. Though it requires few other
assumptions, the fixed-effects estimator relies only on deviations from family-specific means to estimate the parameters, and thus is not efficient as it ignores time-invariant information (such as race) as well as the initial values of time-variant information. On the other hand, random-effects estimation utilizes all of the time-invariant information in the data and is therefore more
efficient. Generalizing the results from random-effects estimation also rests of firmer ground than generalizing results from fixed-effects estimation as family-specific effects are assumed to have a distribution (that is estimated) not fixed and, thus, unique to the particular sample utilized. However, the unbiasedness of the random-effects estimator requires that the explanatory
variables be uncorrelated with the family specific random-effect.
The traditional random-effects estimator has also been criticized, because it imposes a constant correlation across all time periods on the unmeasured, family-specific effect. This is equivalent to requiring that unmeasured family-specific behavioral patterns have a constant correlation across all time periods. However, most behavioral models suggest that the degree to which behaviors are correlated declines with time. Liang and Zeger (1986) and Liang, Zeger,
2
This is a well-known problem. See Chamberlain (1984), Greene (1997), and Liang and Zeger (1986) for more detailed discussions of the econometric issues and the techniques employed here to estimate our models using longitudinal data.
and Qaqish (1992) provide for an unstructured random-effects estimator that is free from the restrictive assumption of the traditional random-effects model. To discern the robustness of our results, we estimate equations (1) and (2) using a traditional random-effects estimator, a
generalized random-effects estimator that imposes no structure on the correlation of the family-specific random-effects over time, and a fixed-effects estimator.3
Two final points on estimation are warranted. First, our longitudinal data incorporates unbalanced panels as households are observed for varying lengths of time as they enter and leave the child care voucher program. Thus, we calculate robust standard errors to adjust for the heteroskedasticity imparted by the unbalanced panels of households. Second, to improve the efficiency of our estimates, we reduce our specification to the set of variables by iteratively eliminating variables with t statistics less than 1 in absolute value and that are jointly insignificant with related variables. This is a widely used model selection criterion as emphasized in Leamer (1983).
4. Data
Our primary data come from two Massachusetts state agencies. The Office of Child Care Services (OCCS) provides monthly information on the use of child care vouchers of current and former TAFDC recipients, and the Department of Transitional Assistance (DTA) provides information from the monthly re-determination interviews of social services recipients and for those enrolled in the Employment Services Program. Sequentially assigned family identifiers allow this information to be merged to form a longitudinal data set containing 14 months of data.4
3
To be specific, for the underlying model Yit = Xitβ + αi + εit, the fixed-effects estimator minimizes the
criterion function: |y−xβ|′ Var(y) |y−xβ| where y and x are deviations from family-specific means and Var(y) is a diagonal matrix with element i equal to Var(εit−εi). Similarly, the random-effects estimators
minimize the criterion function: |Y−Xβ|′ Var(Y) |Y−Xβ| where Var(Y) is a block diagonal matrix with symmetric, family-specific Ti x Ti matrices on the diagonal. For the traditional random-effects estimator,
each of these Ti x Ti matrices has constant covariance parameters (Cov(αit,αit′)=ρ for all t≠t′) off the
diagonal and Var(αi+εit) on the diagonal. The unstructured random-effects estimator does not require the
off-diagonal covariance parameters to be the same. Rather, as suggested by many behavioral models, it allows Cov(αit,αit′) to vary as the length of time between time periods t and t′ increases.
4
All information that would allow for any family to be identified (e.g., social security numbers) were eliminated from the data files. Merges were carried out using a sequentially assigned identifier.
We add to this core data set other information that varies either by geographic region or time or both in order to capture local labor market conditions, welfare assistance policies, economic factors, and child care programs/costs. These data are then used to model the labor market outcomes of current and former TAFDC recipients. While not perfect, we believe these data more effectively capture local labor and child care markets than many previous studies. We describe our data (and sources) below. The summary statistics are given according to the unit of observation, e.g., individual, township, zip code, etc. Table A1, following the paper, gives a complete summary of the definitions and sources while Table A2 gives the summary statistics for our final data set of 81,397 monthly snap-shots of current and former TAFDC recipients.
Individual Data
Our individual data are available for 14 months, July 1996 through August 1997. The DTA intake interview gives us information on several non-changing characteristics of the recipient. Table 1A summarizes this information. The voucher recipients tend to be English speaking, single females who have a high school degree or GED but did not have access to health insurance at the time of applying for assistance. A particularly attractive feature of the data is its racial diversity, with Blacks and Hispanics each compromising over 30 percent of the sample.
For as long as the voucher recipient continues to receive public assistance or is enrolled in the Employment Services Program, monthly observations regarding the recipient’s labor
Table 1A. Characteristics of Adult Child Care Voucher Recipients (N=13,823).
Mean Median Min Max
Female Married English Black Hispanic White Other Race
No High School Degree High School Degree or GED Some College
College Degree
Health Insurance at time of Application
.939 .053 .922 .322 .391 .272 .015 .407 .458 .104 .030 .048 1 0 1 0 0 0 0 0 0 0 0 0 0 0 0 0 0 0 0 0 0 0 0 0 1 1 1 1 1 1 1 1 1 1 1 1
market activities are observed from the monthly re-evaluation interviews. Merging this information across sources gives us information on 13,823 families that are current or former TAFDC recipients and current child care voucher recipients. From July 96 through August 97 we have 81,397 monthly “snap-shots” of these families, 75 percent of whom we observe for at least 6 of the possible 14 months.
Table 1B summarizes these monthly snap-shots. Voucher recipients tend to be around the age of 27, have 2 dependents − the youngest of which is 3 years old. OCCS relies on several Child Care Resource Agencies (CCRAs) to help administer the child care voucher program and to provide child care information and referral services. In our sample, the two CCRAs with the most recipients are Child Care Choices of Boston and the PET/New England Farm Workers Council (Springfield and surrounding areas of Hampden County). In just over 60 percent of the monthly interviews, recipients indicate having worked last week. For those working, the median hours worked was 35 hours per week. Finally, most recipients use full-day child care vouchers for center care, are subject to no co-payment, and use their voucher for about 21 days of child care each month.
Table 1B. Characteristics of Adult Child Care Voucher Recipients (N=81,397).
Mean Median Min Max
Age
Number of Dependents Age of Youngest Child
Youngest Child is less than 2-Years Old Youngest Child is 2 to 5 Years Old Youngest Child is 6 to 13 Years Old Child Care Resource Agency
Child Care Choices of Boston Child Care Resource Center Child Care Search
Child Care Works
New England Farm Workers Council Worked Last Week
Hours Worked if Working (N=49,131) Receives Voucher for Full-day Care Uses Voucher for Center Care
Days of Child Care Service Used last Month Daily Child Care Co-Payment
28.0 2.7 3.1 .260 .595 .145 .329 .082 .138 .187 .264 .603 31.8 .873 .598 16.7 1.27 27 2 3 0 1 0 0 0 0 0 0 1 35 1 1 21 0.00 14 1 0 0 0 0 0 0 0 0 0 0 1 0 0 1 0.00 55 11 13 1 1 1 1 1 1 1 1 1 60 1 1 31 22.80
Child Care
Information on the availability, costs, and quality of child care comes from the 1997 Resource and Referral databases and the 1996 state child care licensing list. The data are aggregated over providers to the township level and do not vary over time. Data are available separately for family care (in-home care) and group child care (center care). Further, data for the group care is available for infants, toddlers, pre-kindergarten, and school age children separately. We approximate the availability of care as the number of slots available per 100 children
− for family care, this is taken over the population of kids 0 to 11 years old, whereas for the group care, this is taken over the population of 0 to 1 year olds for infants, 2 to 3 year olds for toddlers, 4 to 5 year olds for preschool and 6 to 11 years old for after school programs.5 Quality of care is captured by the percent of group care centers that are accredited by the National Association for the Education of Young Children (NAEYC). Stability in the market for formal care is proxied by the average days providers have been in operation. Finally, child care costs are measured by the average weekly price for each type of group care in the town of residence.6 For the weekly costs and days in service, we also consider the inter-quartile range (IQR) to capture the variation in costs and quality across child care centers within one’s town.
Table 2 gives the summary statistics with townships providing the unit of observation. In our empirical analysis, we assign the age-specific value of the group care variables to each of our voucher recipients. That is, households with a newborn are associated with the value of infant availability, cost, and quality. See Table A2 for the summary statistics of these variables when they are assigned to each voucher recipient on a monthly basis.
Table 2. Mean Township Child Care Market Variables (N=144).
Family Care Group Care
All Ages Infant Toddler Preschool After School Capacity per 100 Kids in
Age Group 6.4 2.2 5.1 31.6 5.5
Median Days in Service 1679 2840 3802 4711 4507
IQR Days in Service 1882 2579 3254 4716 4094
Percent NAEYC Accredited Na 0.125 0.123 0.121 0.071
Median Weekly Cost Na 151 146 139 139
IQR Weekly Cost Na 37 32 32 35
5
This is the most commonly used measure of availability of child care. For a discussion, see Queralt and Witte (1998a, 1998b).
6
Funding for the Massachusetts child care voucher system and federal and state public assistance monies are, at times, allocated on the basis of a formula that includes the local TAFDC caseload, the child poverty rate, and child neglect rates. To capture the effect of these formulas, they are included in the analysis as well.
The state’s regional daily reimbursement rate for child care also affects the availability and quality of subsidized care. The reimbursement rates are, in effect, a price ceiling on care that providers can charge and expect to receive in total from the state plus the family’s co-payment.7 Table 3 provides the summary statistics for these variables.
Table 3. Policy & Administrative Variables Related to the Child Care Voucher System.
1997 Township Values (N=144) Mean Median Min Max
State & federal child care subsidies per poor child AFDC Caseload per 1,000 Persons
Proportion Children below 185% Poverty Level 1996 Child Neglect/Abuse Cases per 1,000 Kids 1996 Child Neglect/Abuse Cases per 1,000 Kids
447 13.15 .175 35.9 37.6 434 4.33 .116 27.3 28.4 434 0 .004 2.8 3.0 511 565.34 .757 123.5 139.9 1996-97 Average Zip Code Values (N=244)
Median State Daily Reimbursement Rate IQR State Daily Reimbursement Rate
25.69 8.42 27.00 8.84 8.13 0.00 42.50 27.00
Early Education Programs
We incorporate information on the three major early education programs in
Massachusetts − Head Start, Community Partnerships for Children (funded by the state), and publicly provided pre-kindergarten and kindergarten programs.
Head Start8 is a federally funded, locally administered program aimed at economically disadvantaged children. Head Start began as part of the war on poverty to serve disadvantaged 4 and 5 year olds on a part-day, part-year basis. Recently the program has been expanded in some areas to also serve 0 to 3 year olds. We have collected the data from the 1996-97 and 1997-98 Program Information Reports filed by the roughly 30 Head Start delegate agencies in
7
For all population estimates, we start with the 1990 census that reports population numbers at the township and zip code level and by age group (under 1 year old, 1 to 2 years old, 3 to 4 years old, etc.). Populations spanning more than one age are split equally among the ages. We use these numbers to estimate the 1989 proportion of kids in any age group. We then use a 1997 estimate of the total
population by township provided by the Census bureau. We use the proportions designated in the 1990 Census to extrapolate the 1997 township populations by age group. Our estimates of populations by age group by zip code come from Geolytics (1999).
8
Massachusetts. Our analysis takes into account if there is a Head Start program operating in the township of the household and, if so, what type of agency runs the program (i.e., a Community Action Agency (anti-poverty agency) or another type of agency such as a public school or non-profit organization). Using information on when the Head Start programs are in operation, we determine if the household’s youngest child is “Head Start Eligible”. To be Head Start eligible there must be a local Head Start program, it must be currently in operation (not on winter or summer break), and it must serve the age group of the household’s youngest child.9
Starting in the early 1990s, the Massachusetts Department of Education invited grant applications from private organizations, public schools, charities, and others to help care for, educate, stimulate, and protect poor three and four year old children. Each grant recipient (no more than one per township) is called a Community Partnership for Children (CPC). In fiscal year 1993, 172 townships received $13 million through 89 different CPCs. Over the years, the monies have been renewed annually (and frequently increased) and more CPCs have been funded. By fiscal year 1998, 229 townships received almost $60 million through 157 different CPCs. We include in our analysis the township’s annual CPC budget per three and four year old children living in households earning less than 185% of the federal poverty level.10
Finally, the Massachusetts Department of Education provided information on which school districts offer free, full-day kindergarten, each school district’s enrollment in pre-kindergarten and pre-kindergarten programs, and each school district’s age requirement for starting kindergarten for the 1996-97 school year. From these data, we determine the pre-kindergarten, kindergarten, and (elementary) school eligibility of the youngest child in the household. As before, eligibility requires that the youngest child be of the acceptable age for the program and that the program be in operation during the month. We also calculate the percent of four year olds in publicly provided pre-kindergarten programs and the percent of five year olds in publicly provided kindergarten programs. Summary statistics for all of the early childhood education program variables are given in Table 4.
9
Recall that all families in our sample qualify for child care subsidies and so most would be economically eligible for Head Start.
10
From the Department of Education, we know the percent of students living in households that earn less than 185 percent of the federal poverty level (which corresponds to being eligible to receive reduce priced or free lunch) in each school district. This FPL cutoff level is our definition of “poor” throughout the paper and is used to approximate the percent of poor kids at all age levels.
Table 4. Early Childhood Education Programs.
1996-97 Head Start by Township (N=144) Mean Median Min Max
Head Start in Township
If Head Start, run by Community Action Agency If Head Start, run by Non-CAA
.139 .600 .400 0 1 0 0 0 0 1 1 1 Community Partnership for Children by Township
Fiscal Year 1997 Dollars per Poor Child (N=143) Fiscal Year 1998 Dollars per Poor Child (N=144)
1615 2280 1117 1188 0 0 12159 12159 1996-97 School District Variables (N=137)
Offers Full-day Kindergarten
Proportion of 4 Year Olds in Pre-Kindergarten Proportion of 5 Year Olds in Kindergarten
.241 .210 .900 0 .186 .957 0 0 .529 1 1 1 Youngest Child’s School Eligibility by Month (N=81,397)
Head Start Eligible Pre-Kindergarten Eligible Kindergarten Eligible Elementary School Eligible
.098 .074 .039 .067 0 0 0 0 0 0 0 0 1 1 1 1
Other Policy and Administrative Variables
During the time period of our study, the federal government funded an empowerment zone in Boston and enhanced community projects in Lowell and Springfield. These programs target specific Census tracts. A close mapping from Census tract to zip code allows us to determine which households live in these zones. In addition, the Massachusetts Office of Business Development (MOBD) provided tax breaks and other economic incentives and resources on 439 "Certified Projects" throughout the state. Each of these projects is associated with a specific dollar amount to be spent on economic revitalization within a township. We include in the analysis the local total budget of these certified projects per person. As the month that the certified project began is known, this series changes monthly. We also control for whether or not standard operations at the local welfare office consolidate responsibilities across case workers. Table 5 reports the summary statistics for these variables.
Table 5. Other Policy & Administrative Variables.
Township Variation (N=144) Mean Median Min Max
Welfare Office is Consolidated (N=144) .813 1 0 1
Monthly Variation in Township (N=1523)
EDIP Dollars per Worker 226 0 0 8863
Zip Code Variation (N=244)
Costs of Working
To control for the general costs of working, we turn to the 1990 Census. We use the 1-year and 5-1-year inter-zip code moving rate and the 5-1-year inter-county moving rate to control for the family’s access to informal child care via friends and family. We also include the average commute time and the proportion of workers using public transportation. Finally, at the MSA level, we turn to the Bureau of Labor Statistics’ Occupational Wage Survey (OWS) to include the median child care worker wage and to the U.S. Department of Housing and Urban
Development for the 40th percentile of the fair market rent for a 2 bedroom apartment.11 The summary statistics are given in Table 6.
Table 6. Costs of Working.
1990 Census by Zip Code (N=244) Mean Median Min Max
1 Year Household Zip Code Turnover Rate 5 Year Household Zip Code Turnover Rate 5 Year Household County Turnover Rate Average Commute to Work in Minutes Public Transportation is Available
Proportion Workers Using Public Transportation
.154 .408 .189 24.4 .758 .074 .149 .403 .169 24.7 1 .027 .034 .198 .018 15.9 0 0 .443 .847 .775 35.0 1 .433 MSA Characteristics (N=11)
1997 Median Child Care Worker Wage
1996 Fair Market Rate for a 2 Bedroom Apt. (HUD) 1997 Fair Market Rate for a 2 Bedroom Apt. (HUD)
8.02 658 675 7.69 656 675 7.01 552 568 9.81 808 839
Local Labor Market Conditions
The labor market conditions that we account for include each township’s monthly employment growth rate (BLS’s Local Area Unemployment Statistics), the percent of local jobs that are in the service and trade sector as indicated by ES 202 data,12 the median retail sales and cashiers wage in the MSA (OWS), the proportion of workers leaving for work between 4 pm and midnight (1990 Census by zip code),13 and whether or not the township has a Massachusetts Division of Employment and Training Job Center. The summary statistics for the local labor market conditions are given in Table 7.
11
Seven of our 144 townships are not in an MSA. The clients in these 7 towns (which account for only 283 of our 81,397 monthly observations) are assigned to the closest MSA.
12
Most women of the type in our sample are employed in the services and trade sectors. See Witte, Queralt, and Griesinger (1998) for a discussion.
Table 7. Local Labor Market Conditions.
Township Variation (N=144) Mean Median Min Max
Div. of Employ. & Training Job Center Service Jobs per Worker (ES202 data) Trade Jobs per Worker (ES202 Data)
.188 .273 .260 0 .258 .249 0 .026 .057 1 .653 .580 Monthly Variation in Township (N=1523)
Employment Growth Rates x 100 -.001 .003 -.349 .273
Zip Code Variation (N=244)
Prop. Workers Leave for Work b/w 4pm & midnight .061 .060 0 .126 MSA Characteristics (N=11)
1997 Median Retail Sales Wage 1997 Median Cashier Wage
7.79 6.60 7.21 6.54 5.96 6.20 7.87 7.00 Community Characteristics
Finally, we also control for several community characteristics measured at the zip code level. Using estimates of 1998 characteristics by zip code (Geolytics, 1999), we include median household income, proportion Black, and proportion Hispanic. Using the 1990 Census directly we include the proportion of zip code residents who were born in a foreign country. Finally, using yearly data provided by the Massachusetts Department of State Police, we incorporate the number of arrests for drug crimes and Part I criminal offenses per 100,000 people and the proportion of Part I criminal offenses cleared with an arrest by township.14 The summary statistics for the community characteristics are given in Table 8.
Table 8. Community Characteristics.
Geolytics 1998 Estimate by Zip Code (N=244) Mean Median Min Max Median Household Income
Proportion Black Proportion Hispanic 51214 .061 .062 48738 .018 .024 16028 0 .012 112321 .955 .804 1990 Census Data by Zip Code (N=244)
Proportion Foreign Born .100 .024 0 .670
Yearly Variation by Township (N=260) Drug Crimes per 100,000 People
Part I Criminal Offenses per 100,000 People Proportion Part I Offenses Cleared by Arrest
180 515 .155 26 97 .125 0 3 0 5797 26570 .741 13
Child care is much less available at these time. 14
Caring for children in neighborhoods with high crime rates is both more time consuming and more expensive.
5. Results
In this section we present and discuss the results for the probability of working, equation (1), and the weekly hours worked, equation (2), from section 3. Tables A4 and A5 contain estimation results for the probability of working and the weekly hours worked respectively. To assess the robustness of results, these tables contain the estimated coefficients for a traditional random-effects model (i.e., time-constant or structured covariance matrix for the unobserved individual effect), a flexible random-effects model (i.e., a time-varying or unstructured
covariance matrix for the unobserved individual effect), and a fixed-effects model. The results are also given for the full specification and a reduced specification. The reduced specification drops variables that produce t-statistics of less than 1 in absolute value. This process is repeated until all variables remaining satisfy the t-statistic criterion. Exceptions are granted for policy and regulation variables of great interest that do not jointly satisfy this criterion.15 On the surface, for example, whether the mother is Black should be dropped from the reduced specification for hours worked. Jointly testing that “Black”, “Hispanic”, and “Other Race” are all jointly statistically insignificant, however, is rejected, and therefore whether the mother is Black is retained in the specification.
5.1 Working vs. Training
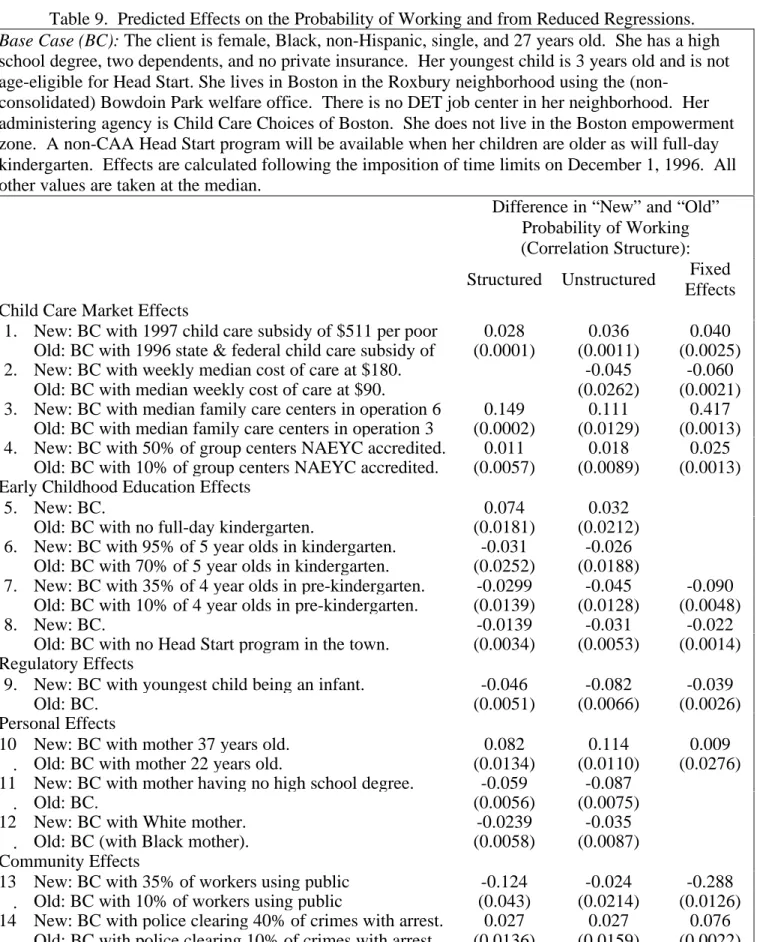
For our sample of child voucher recipients, recall that the alternative to working is to be enrolled in some type of job training or education program. The probit estimates reported in Table A4 are point estimates, thus the sign and statistical significance of each is of interest. In order to make the magnitude of the predicted effects clear, Table 9 (page 18) reports the difference in estimated effects under 14 different scenarios for five general areas of interest − Child Care Market Effects, Early Childhood Education Effects, Regulatory Effects, Personal Effects, and Community Effects. Each of these will be discussed in turn. The top of Table 9 presents the “base case” household for the simulations. For many variables, this household is assigned the median values from the sample. When a variable’s values enter the specification via several indicator variables, however, the base case is associated with a particular value. For example, the base case is for a single, Black, female living in the Roxbury neighborhood of
Boston. Note also that Table 9 reports the estimated effects from the reduced specifications. The following discussion of the predicted effects focuses on the reduced model using the unstructured random-effects estimator.16
Child Care Market Effects
Scenario 1 shows the predicted effect from increased federal and state funding of child care vouchers. Spending on child care vouchers in Massachusetts increased from $434 per poor child in fiscal year 1996 to $511 in fiscal year 1997. The predicted effect from this increase in voucher spending increases the probability of working by 3.6%. These results are similar to results obtained using data for Miami-Dade County, Florida (Queralt, Witte and Griesinger, 1999).
In scenario 2, we see that increasing the median weekly cost of child care from $90 to $180 (approximately the 5th percentile to the 95th percentile) reduces the probability of working by 4.5%.
The third and fourth scenarios concern the quality of child care and are quite revealing about the institutional structure of the child care market and the transition from welfare to work. Scenario 3 shows that increasing the median time in operation for family child care providers from 3 to 6 years increases the probability of working by 11.1%. The fixed-effects model suggests the increase is over 40%, which seems unreasonably high to us. Increasing the quality of care (as measured by accreditation) also significantly increases the probability that a welfare recipient works, but the effect is much smaller than the effect of greater stability of family child care providers. To be more specific, increasing the number of NAEYC accredited group child care centers from 10% to 50% increases the probability of working by at most a couple of
percentage points. Thus, quality matters when quality means having a well-developed and stable child care market. The effect from having more centers being nationally accredited, however, appears to play a significant but much smaller roll.
15
The first few rounds of eliminating variables removed only those townships, welfare offices, Boston neighborhoods, and SMSAs that failed the criterion. Once the model was reduced in this dimension, then the policy and socio-demographic variables were considered for removal.
16
The correlation matrix strongly supports using the varying correlation matrix in place of the time-invariant matrix assumed by the traditional random-effects estimator.
Table 9. Predicted Effects on the Probability of Working and from Reduced Regressions. Base Case (BC): The client is female, Black, non-Hispanic, single, and 27 years old. She has a high school degree, two dependents, and no private insurance. Her youngest child is 3 years old and is not age-eligible for Head Start. She lives in Boston in the Roxbury neighborhood using the
(non-consolidated) Bowdoin Park welfare office. There is no DET job center in her neighborhood. Her administering agency is Child Care Choices of Boston. She does not live in the Boston empowerment zone. A non-CAA Head Start program will be available when her children are older as will full-day kindergarten. Effects are calculated following the imposition of time limits on December 1, 1996. All other values are taken at the median.
Difference in “New” and “Old” Probability of Working (Correlation Structure): Structured Unstructured Fixed
Effects Child Care Market Effects
New: BC with 1997 child care subsidy of $511 per poor 0.028 0.036 0.040 1.
Old: BC with 1996 state & federal child care subsidy of (0.0001) (0.0011) (0.0025)
New: BC with weekly median cost of care at $180. -0.045 -0.060
2.
Old: BC with median weekly cost of care at $90. (0.0262) (0.0021)
New: BC with median family care centers in operation 6 0.149 0.111 0.417 3.
Old: BC with median family care centers in operation 3 (0.0002) (0.0129) (0.0013) New: BC with 50% of group centers NAEYC accredited. 0.011 0.018 0.025 4.
Old: BC with 10% of group centers NAEYC accredited. (0.0057) (0.0089) (0.0013) Early Childhood Education Effects
New: BC. 0.074 0.032
5.
Old: BC with no full-day kindergarten. (0.0181) (0.0212)
New: BC with 95% of 5 year olds in kindergarten. -0.031 -0.026 6.
Old: BC with 70% of 5 year olds in kindergarten. (0.0252) (0.0188)
New: BC with 35% of 4 year olds in pre-kindergarten. -0.0299 -0.045 -0.090 7.
Old: BC with 10% of 4 year olds in pre-kindergarten. (0.0139) (0.0128) (0.0048)
New: BC. -0.0139 -0.031 -0.022
8.
Old: BC with no Head Start program in the town. (0.0034) (0.0053) (0.0014) Regulatory Effects
New: BC with youngest child being an infant. -0.046 -0.082 -0.039
9.
Old: BC. (0.0051) (0.0066) (0.0026)
Personal Effects
New: BC with mother 37 years old. 0.082 0.114 0.009
10
. Old: BC with mother 22 years old. (0.0134) (0.0110) (0.0276)
New: BC with mother having no high school degree. -0.059 -0.087 11
. Old: BC. (0.0056) (0.0075)
New: BC with White mother. -0.0239 -0.035
12
. Old: BC (with Black mother). (0.0058) (0.0087)
Community Effects
New: BC with 35% of workers using public -0.124 -0.024 -0.288
13
. Old: BC with 10% of workers using public (0.043) (0.0214) (0.0126)
New: BC with police clearing 40% of crimes with arrest. 0.027 0.027 0.076 14
. Old: BC with police clearing 10% of crimes with arrest. (0.0136) (0.0159) (0.0022) Note: The standard error of the difference in predictions is in parentheses.
Early Childhood Education Effects
Scenario 5 shows that the probability of working is higher by 3.2% in townships that offer full-day kindergarten programs. Scenarios 6 and 7 show the effect of having generally high enrollment rates in kindergarten and pre-kindergarten programs. Whereas full-day kindergarten programs are more conducive to working full-time, the results suggest that part-day kindergarten (76% of all kindergarten programs), Pre-K, and Head Start programs are more conducive to continuing education, which is easier to do on a part-time basis. As seen in scenarios 6 and 7, increasing the proportion of five year olds in kindergarten from 70% to 95% or increasing the proportion of four year olds in pre-kindergarten from 10% to 35% reduces the probability of working by 2.6% and 4.5% respectively. The 8th scenario similarly shows that the presence of a Head Start program is associated with a 3.1% lower chance of working.
Regulatory Effects
Given how the time limits and work requirement rules in Massachusetts focus almost exclusively on the age of the youngest child, we have a strong interest in knowing how these rules affect behavior. Scenario 9 shows, as one would expect, the strong behavioral response to working (versus training) when one’s youngest child is under the age of two compared to when the child is two to five years old. Having a child under the age of two (as compared to having a 3 year old) increases the probability of choosing more education or job training by as much as 8.2%. This is exactly as one would expect as time limits are imposed beginning on the child’s second birthday. A similar behavioral response is expected between the ages of five and six, the threshold age for the work requirement. The coefficient on “youngest child is 2 to 5 years old” indicator variable, though consistently negative, is repeatedly insignificant in Table 4A. The expected effects from this age-threshold legislation, however, may be coming through elementary school eligibility. In particular, Table A4 associates a (usually statistically significant) positive effect on the probability of working from having one’s youngest child elementary school eligible. Thus, regardless of time limits, the probability of working increases when the work requirement affects the choice set of the household.
Finally, it should be noted that, economically, there was no discernable effect from the imposition of the time limits and work requirements on December 1, 1996. This may be because the behavioral response from the regulation comes entirely though the age of the mother's
youngest child. It is also possible that welfare recipients were aware of the changes that were going to be made in the rules (the rule changes were announced in September of 1996 and discussed in welfare office visits), and changed their behavior to account for the new regulations prior to the official December 1, 1996 effective date of the legislation.
Personal Effects
The predicted effects from changes in personal characteristics are quite substantial. Scenario 10 points to the probability of working increasing with age. A 37 year-old mother has an 11.4% greater chance of working than a 22 year-old mother. Similarly, the probability of working is about 9% lower if one does not have a high school diploma. Both of these results probably stem from mothers without a high school degree being more willing to pursue a GED the younger they are. Finally, White mothers have a 3.5% greater chance of pursuing job training or education than Black mothers.17
Community Characteristics
Lastly we consider the major community effects, of which there are two. First, an
increase in the proportion of workers using public transportation, from 10% to 35%, is associated with a decline in the probability of working by 2.4%. There are many possible interpretations of this result. The Boston metropolitan area has a far more extensive and widely used public transportation system than the rest of the state (particularly rural areas in the western part of the state). The Boston area also has a much more extensive job training and education system than the rest of the state. Thus the result may simply reflect this greater availability of training and education. Finally, the probability of working increases by roughly 2.7% when the local police clear 40% of crimes with an arrest compared to when the clearing rate is only 10% - possibly indicating that single mothers are more willing to leave their children and venture off to work in safer communities.
17
There is no economical or statistical difference between the work vs. training decision of Blacks and Hispanics.
5.2 Weekly Hours Worked
We now discuss the results for hours worked. Although the point estimates are now easily interpretable, we again focus attention on Table 10 (page 22), which is identical in interpretation to Table 9. The reader may use Table A5 to examine other results.
Child Care Market Effects
Scenarios 1 through 3 in Table 10 have similar implications. Whether state and federal child care subsidies or the quality of child care increases, the economic effect on weekly hours worked is small (despite statistical significance). In general the noted variables are all positively related to hours worked but the typical differences in the values of the variables observed in the data have less than a single hour effect per week.
The fourth scenario provides insight into the role of state imposed price ceilings on child care. When the reimbursement rate is changed from $20 per day (roughly the 10th percentile) to $30 per day (roughly the 90th percentile), hours worked falls as much as 6 hours per week. Thus, the higher co-payment effect seems primarily concentrated on decreasing hours of care, not necessarily lowing the quality of care.
Early Childhood Education Effects
The only early childhood education variables that are consistently statistically significant are the proportion of five year olds in kindergarten and the proportion of five year olds in pre-kindergarten. Only the proportion of children in kindergarten, however, is practically important. Hours worked increases by as much as nine hours a week when kindergarten enrollment covers 95% of five year olds compared to when only 70% of five year olds are in kindergarten.18 The presence of Head Start programs and pre-kindergarten programs, however, have no significant effect on weekly hours worked. This is unexpected as, intuitively, hours worked should depend greatly on the age (and activities) of the children (and in particular the youngest child) of the household. Scenario 6, however, shows positive correlation between hours worked and having one’s youngest child in elementary school. Again, the effect is somewhat small, translating into less than an additional 15 minutes of work per week.
18
All 3 econometric specifications indicate a positive relationship. For the stated scenario, however, the predicted increase in weekly hours worked ranges from a low of 30 minutes to a high of nine hours.
Table 10. Predicted Effects on Hours Worked from Reduced Regressions.
Base Case (BC): The client is female, Black, non-Hispanic, single, and 27 years old. She has a high school degree, two dependents, and no private insurance. Her youngest child is 3 years old and is not age-eligible for Head Start. She lives in Boston in the Roxbury neighborhood using the
(non-consolidated) Bowdoin Park welfare office. There is no DET job center in her neighborhood. Here administering agency is Child Care Centers of Boston. She does not live in the Boston empowerment zone. A non-CAA Head Start program will be available when her children are older as will full-day kindergarten. Effects are calculated following the imposition of time limits on December 1, 1996. All other values are taken at the median.
Difference in “New” and “Old” Hours Worked
(Correlation Structure): Structured Unstructured Fixed
Effects Child Care Market Effects
New: BC with 1997 child care subsidy of $511 per poor 0.405 0.265 0.243 1.
Old: BC with 1996 state & federal child care subsidy of (0.0856) (0.0779) (0.0857)
New: BC with median family and group centers in 0.976 0.718 3.426
2.
Old: BC with median family and group centers in (0.7098) (0.8046) (0.8073)
New: BC with 50% of group centers NAEYC accredited. 0.437 0.519
3.
Old: BC with 10% of group centers NAEYC accredited. (0.3207) (0.2013) New: BC with state daily reimbursement rate of $30.00. -1.195 -6.071 4.
Old: BC with state daily reimbursement rate of $20.00. (0.7595) (0.7613) Early Childhood Education Effects
New: BC with 95% of 5 year olds in kindergarten. 2.844 0.478 8.790
5.
Old: BC with 70% of 5 year olds in kindergarten. (0.7210) (0.3730) (0.8262) New: BC with 7 year old, elementary school eligible. 0.1886 0.237 0.233 6.
Old: BC with 7 year old, not elementary school eligible. (0.1398) (0.1415) (0.1281) Regulatory Effects
New: BC with youngest child being an infant. -0.215 -0.327 -0.035
7.
Old: BC. (0.1934) (0.1675) (0.1636)
Personal Effects
New: BC with mother 37 years old. 1.435 1.424 -1.042
8.
Old: BC with mother 22 years old. (0.2382) (0.2345) (1.1500)
New: BC with mother having no high school degree. -0.344 -0.389 9.
Old: BC. (0.2018) (0.20431)
New: BC with Hispanic mother. -0.875 -0.763
10
. Old: BC (with Black mother). (0.2912) (0.2799)
Community Effects
New: BC with 30% yearly household moving rate. 6.680 2.415 13.142
11
. Old: BC with 10% yearly household moving rate. (1.3778) (0.5710) (1.2257) New: BC with median retail hourly wage of $7.75. 13.830 9.0934 17.687 12
. Old: BC with median retail hourly wage of $6.00. (2.6724) (4.7635) (9.7026) Note: The standard error of the difference in predictions is in parentheses.
Regulatory Effects
The ex ante regulatory effects of hours worked are arguably unclear. Mothers with infants are not subject to time limits or work requirements, and thus do not otherwise need to be working to collect benefits. Thus, these mothers may tend to work less as they do not need to work to receive public assistance. On the other hand, as these mothers have chosen to work, they may work as much as mothers with older children. Moreover, although younger recipients are more likely to pursue training in place of working, for those who actually work, obtaining
training on the side may be quite difficult as this would keep them away from their children even more. Thus, it is possible that mothers with older children have greater flexibility to tradeoff a few hours of work every week to pursue training. Scenario 7 shows a slight tendency for mothers with younger children to work less each week, but the effect is less than 20 minutes a week.
Personal Effects
As expected, Scenario 8 in Table 10 shows that older mothers tend to work more hours. A 37 year old works, on average, just short of one and a half more hours a week than a 22 year old. Further, those with high school degrees work roughly one-third of an hour more each week than those without a high school degree. And Hispanics work almost a full hour less each week compared to Blacks or Whites.
Community Characteristics
Of all of the predicted effects reported in Table 10, none are as striking as the community characteristics. Scenario 11 points to the significant role played by moving rates. Hours worked each week are almost 7 hours higher in zip codes with a 30% annual moving rate (approximately the 95th percentile) compared to zip codes with a 10% annual moving rate (approximately the 5th percentile). One interpretation of this finding is that people are moving for jobs. A second interpretation is that the families remaining in zip codes are the more steady/reliable/better treated workers, and thus tend to work longer hours. The average wage level also plays a key role in hours worked. Scenario 12 shows the effect raising the median retail sales wage from $6.00 per hour to $7.75 per hour. This $1.75 per hour increases is associated with an additional 9 to 18 hours of work per week.
6. Conclusions
In this paper, we provide a preliminary assessment of the impacts of the child care market and the availability of subsidized child care and education on the probability of work and hours of work of current and former welfare recipients. We find that both the child care market and availability of subsidized care and education impacts the probability of work more than it impacts hours of work.
Building upon previous work that mainly considers the impact of child care costs on the probability of work, we assess the impact of the cost of care, but are careful to include measures of the quality and availability of care. Child care is a heterogeneous and location specific product. Thus, full assessment of its impact requires incorporation of what has been called the “child care trilogy” - availability, cost and quality. As has been found in previous work, we find that increases in the costs of child care significantly decreases the probability that women with children will work. However, we find that the stability and quality of child care have much larger effects on the probability of work than does cost. Our results are for low-income women. It would be useful to assess the impacts of the quality and stability for more general population groups.
Previous work on the impact of child care subsidies and early childhood education have generally consider a single program (e.g., Head Start). The world of early care and education is complex. Public schools and other entities provide pre-kindergarten programs, Head Start provides comprehensive services for poor children and their families and the federal government and state governments jointly fund child care subsidy programs for the low-income families. In this paper, we have tried to assess a broader array of child care subsidy and early education programs. Like previous work, we find that increased funding for child care subsidies is
associated with increased probabilities that current and former welfare recipients will work. We also find that current and former welfare recipients living in areas with full-day kindergartens are more likely to work than recipients living in areas with part-day or no kindergarten. The
availability of (typically) part-day, part-year Head Start and Pre-K programs is associated with a decreased probability that the current and former recipients in our sample will work and a concomitant increase in the probability that they will be involved in training and education, which is more compatible with a part-day, part-year schedule.
We hope that our work will stimulate further efforts to assess the impacts of aspects of child care markets in addition to costs. The quality and costs of child care are interrelated and assessment of one in the absence of the other may lead to biased results. We also hope that our work will stimulate others studying low-income families to consider the effect the broad array of child care subsidies and early education programs available has not only on the probability that low-income women will work, but also on the well-being of low-income children.
REFERENCES
Averett, S. L., H. E. Peters, and D. M. Waldman (1997). “Tax Credits, Labor Supply, and Child Care,” Review of Economics and Statistics, 79: 125-135, February.
Berger, M. C. and D. A. Black (1992). “Child Care Subsidies, Quality of Care, and the Labor Supply of Low-Income, Single Mothers,” Review of Economics and Statistics, 74: 635-642, November.
Connelly, R. (1992). “The Effect of Child Care Costs on Married Women’s Labor Force Participation,” Review of Economics and Statistics, 74: 83-90, February.
Chamberlain, G. (1983). “Panel Data,” in Zvi Griliches and Michael Intrilligator (eds), Handbook of Econometrics, Vol. II, Amsterdam: North-Holland, 1247-1317. Geolytics, Inc. (1999). Census CD+Mapgs, East Brunswick, New Jersey.
Greene, W., (1997). Econometric Analysis, 3rd ed., Upper Saddle River, NJ: Prentice Hall. Johansen, A. S., A. Leibowitz, and L. J. Waite (1996). “The Importance of Child-Care
Characteristics to Choice of Care,” Journal of Marriage and the Family, 58: 759-772, August.
Kimmel, J. (1992). “Child Care and the Employment Behavior of Single and Married Mothers,” W.E. UpJohn Institute for Employment Research, Working Paper 92-14.
Kimmel, J. (1995). “The Effectiveness of Child Care Subsidies in Encouraging the Welfare-to-Work Transition of Low-Income Single Mothers,” American Economic Review, 85: 271-275, May.
Kimmel, J. (1998). “Child Care Costs as a Barrier to Employment for Single and Married Mothers,” Review of Economics and Statistics, 79: 287-299, February.
Leamer, E. (1983), "Model Choice and Specification Analysis,' in Zvi Griliches and Michael Intrilligator (eds), Handbook of Econometrics, Vol. III, Amsterdam: North Holland, 286-330.
Liang, K.-Y. and S. Zeger (1986). “Longitudinal Data Analysis using Generalized Linear Models,” Biometrika, 73: 13-22, April.
Liang, K.-Y., S. Zeger, and B. Qaqish (1992). “Multivariate Regression Analyses for Categorical Data,” Journal of the Royal Statistical Society, Series B, 54: 3-24.
Meyers, M. K. and T. Heintze (1999). “The Performance of the Child-Care Subsidy System,” Social Service Review, 73: 37-64, March.
Ribar, D. C. (1995). “A Structural Model of Child Care and the Labor Supply of Married Women,” Journal of Labor Economics, 13: 558-597, July.
Ribar, D. C. (1992). “Child Care and the Labor Supply of Married Women: Reduced Form Evidence,” Journal of Human Resources, 27: 134-165, Winter.
Witte, A. D., M. Queralt, T. Chipty and H. Griesinger (1998). “Unintended Consequences: Welfare Reform and the Earnings of the Working Poor,” with support of the U.S. Department of Health and Human Services, NBER Working Paper 6798,
Table A1. Definition of Variables and Sources. THEORETICAL CONSTRUCT EMPIRICAL MEASURE DATA SOURCE Dependent Variables
Hourly Wage Client's hourly wage last month.
Hours Worked Hours per week the client worked last month. Working Client worked 1 or more hours last month.
DTA Monthly Files and Employment Services Program Monthly Files Explanatory Variables
Characteristics of Adult Child Care Voucher Clients who are also Current or Former TAFDC Recipients
Sex Binary=1 if the client is female.
Marital Status Binary=1 if married at time of DTA entry. Language Binary=1 if the family language is English.
Race Binaries for race (Black, Hispanic, or other). Age Age of the client (and age squared).
Education Binaries for client’s highest level of education. Number of Dependents Client’s number of dependents.
Age of Youngest Child Age of the client’s youngest child.
DTA Monthly Files
Characteristics of Formal Child Care
Availability Full-time capacity in family day care and in group
care per 100 kids in age group in township. 1996 Licensing Lists; CB Percent of slots in NAEYC accredited centers.
Quality
Median and IQR days provider has been licensed.
NAEYC Accreditation list; Licensing data bases Cost
Median and inter-quartile range of weekly prices for full-time center care in town for age of youngest child.
1994 MA Market Rate Survey and 1997 Resource
and Referral data bases
Policy & Administrative Variables Related to the Child Care Voucher System
State and fed. subsidy funding per eligible child. OCCS budget allocation Monthly AFDC cases per 1000 pop. in zip code. DTA, US Census Yearly number of reported child neglect/abuse
cases in township per 1,000 kids.
Department of Social Services, US Census Funding for
State / Federal Child Care Subsidies
Proportion of children eligible for free or reduced lunch in elementary school district.
MA Department of Education Reimbursement Rates Median and IQR of state full-time daily child care
reimbursement rate in zip code.
OCCS Monthly Billing Files
Administration Binaries for subsidy administering agency (CCRAs).
OCCS Monthly Billing Files
Policy & Administrative Variables Related to Early Childhood Education Programs
Head Start
Binary=1 if there is a Head Start program in town and it is in operation. Binary=1 if a Community Action Committee runs the program.
Head Start 1996 & 1997 Program Information
Reports. Community
Partnerships for Children
Town’s Community Partnership for Children
budget per eligible 3 and 4 year old kids. DOE, 1990 Census Binary=1 if public elementary school offers free
full-day kindergarten.
Proportion of 5 year olds in township in kindergarten.
Kindergarten & Pre-Kindergarten
Proportion of 4 year olds in township in pre-k.
THEORETICAL CONSTRUCT EMPIRICAL MEASURE DATA SOURCE Binary=1 if the youngest child is age-eligible for
first grade or higher on 9/1/96 (=0 in summer). Binary=1 if the youngest child is age-eligible for kindergarten on 9/1/96 (=0 in summer months) Binary=1 if the youngest child is age-eligible for pre-school on 9/1/96 (=0 in summer months).
DTA monthly files; DOE Early Childhood
Education Eligibility
Binary=1 if the youngest child is age eligible for Head Start on 9/1/96(=0 when Head Start is not in session).
DTA monthly files; PIR
Other Policy and Administrative Variables
Minimum Wage Increase & Federal Employer Tax Credits
change to WOTC
Binary=1 after September 30, 1996. 1996 Tax Code (IRS) Welfare Reform:
24/60 Time Limit Imposed
Binary=1 after November 30, 1996. DTA
Binary=1 if local welfare office is consolidated. Welfare Office
Binaries for welfare offices. DTA
EITC Income at which phase out of EITC begins. 1996 & 1997 Tax Code (IRS)
Binary=1 if located in zip code of a federally funded empowerment zone or enhanced community.
Boston Empowerment Center, Lowell & Springfield Enhanced
Community Centers Employer Tax Credits
Dollars per worker for “Certified Projects” in township authorized by MA Office of Business Development.
MA Office of Business and Development Medical Insurance Binary=1 if the client had access to medical
insurance at time of DTA entry. DTA Monthly Files Binary=1 if the youngest child is under 2 (time
limit & work exempt). Child’s Age Effect of
Time Limits & the
Work Requirement Binary=1 if the youngest child is between 2 and 5 years old (work exempt, subject to time limits).
DTA Monthly Files
Costs of Working
1 and 5 year housing turnover rate in zip code Availability of
Informal Care Proportion of the zip code’s population aged 5 or older living in the county for 5 years or more.
1990 Census Average commute time to work.
Public transportation is available in the zip code. Transportation Costs
Proportion of workers using public transportation.
1990 Census
MSA 1997 median child care worker wage. 1997 BLS Occupational Employ. & Wage Survey Costs of Child Care
THEORETICAL CONSTRUCT EMPIRICAL MEASURE DATA SOURCE
Local Labor Market Conditions
Proportion of local jobs in the service sector.
Proportion of local jobs in the trades sector. 1996 & 1997 ES202 Data Availability of
Low-Skill Jobs
Monthly township employment growth rate. LAUS Statistics (BLS) Wages of Low-Skill
Jobs MSA 1997 median retail sales and cashier wages. 1997 BLS OEWS Working Hours Proportion of workers who leave for work
between 4:00pm and midnight. 1990 Census
Information MA Division of Employment & Training operates a job center in township.
MA Division of Employment & Training
Community Characteristics
Est. 1997 median household income in zip code. Estimated 1997 proportion Black in zip code. Estimated 1997 proportion Hispanic in zip code.
1997 Geolytics Proportion foreign born in zip code. 1990 Census Drug crimes per 100,000 people in township.
Part I offenses per 100,000 people in township. Proportion offenses cleared by arrest in township.
MA Department of State Police
Community Characteristics
Binaries for townships, MSAs, & Boston neighborhoods.
DTA Monthly Files, Boston Redevelopment