Linking social network analysis with the
analytic hierarchy process for knowledge
mapping in organizations
Jay Liebowitz
Abstract
Purpose– To provide an interesting approach for determining interval measures, through the analytic hierarchy process, for integration with social network analysis for knowledge mapping in organizations.
Design/methodology/approach – In order to develop improved organizational and business processes through knowledge management, a knowledge audit should be conducted to better understand the knowledge flows in the organization. An important technique to visualize these knowledge flows is the use of a knowledge map. Social network analysis can be applied to develop this knowledge map. Interval measures should be used in the social network analysis in order to determine the strength of the connections between individuals or departments in the organization. This paper applies the analytic hierarchy process to develop these interval measures, and integrates the values within the social network analysis to produce a meaningful knowledge map.
Findings– The analytic hierarchy process, when coupled with social network analysis, can be a useful technique for developing interval measures for knowledge-mapping purposes.
Research limitations/implications – The analytic hierarchy process may become tedious and arduous for use in large social network maps. More research needs to be conducted in this area for scalability.
Practical implications – As social network analysis is gaining more prominence in the knowledge management community, the analytic hierarchy process may be able to provide more valuable measures to determine the strengths of relationships between actors than simply using ordinal numbers.
Originality/value – Coupling the analytic hierarchy process with social network analysis provides a novel approach for future knowledge-mapping activities.
KeywordsSocial networks, Analytical hierarchy process, Auditing
Paper typeResearch paper
1. Introduction
Why are organizations so enamored with knowledge management? One important reason is that organizations are hoping that knowledge management processes will allow the creation of knowledge to take place for increasing innovation in the organization (Chauvel and Despres, 2002; Earl, 2001). Innovation may be in the form of improved organizational business processes, new products or services, or better ways for customer relationship management. For example, JD Edwards applied knowledge management to their customer relationship management by developing knowledge management for internal sales support first, taking the lessons learned and successes into a second stage, and extending ‘‘the knowledge garden’’ to its business partners and integrators (Harriset al., 2003).
Knowledge management can be in the form of idea management systems that allow employee ideas and suggestions to be captured and shared online. These idea management systems, such as Imaginatik’s Idea Central (Pluskowski, 2002), allow the capture and sharing of ideas across the organization, and provides an efficient review process to evaluate the ideas. Increased socialization encouraged by this approach can lead to the impromptu formation of communities of practitioners who discover people with similar interests from the ideas and the ensuring interactions (Pluskowski, 2002). These interactions can hopefully lead to innovations in the organization.
Jay Liebowitz is in the Department of Information Technology, Graduate Division of Business and Management, Johns Hopkins University, Rockville, Maryland, USA ([email protected]).
To enhance the knowledge flows between people to stimulate innovative thinking, organizations should first conduct a knowledge audit and develop a knowledge map of the sources, sinks, and flows of knowledge in the organization. In other words, whom do people go to in the organization for answers to questions or how are departments in the organization interacting within and between each other? To help develop the knowledge map, social network analysis (SNA) and associated visualization tools can be used to aid in the analysis of this information. One way to improve the current state-of-the-art in SNA is to develop new ways to produce interval/ratio measures of relations between the various individuals in the organization to determine the strength of their ties. This paper discusses a novel approach in applying the analytic hierarchy process (AHP) to generate the ratio scores for the valued graphs to be used in SNA in order to develop a knowledge map of the organization.
This paper will first discuss knowledge mapping and then describe SNA. Then, the AHP will be explained and linked with SNA to produce valued graphs used for knowledge mapping.
2. Knowledge mapping
A key part of knowledge management (KM) is performing a knowledge audit to determine knowledge flows within an organization. Specifically, the knowledge audit process involves (Liebowitzet al., 2000):
(1) Identify what knowledge currently exists in the targeted area (typically select a core competency that is cross-departmental/functional):
B determine existing and potential sinks, sources, flows, and constraints in the targeted
area, including environmental factors that could influence the targeted area;
B identify and locate explicit and tacit knowledge in the targeted area; and
B build a knowledge map of the taxonomy and flow of knowledge in the organization in
the targeted area. The knowledge map relates topics, people, documents, ideas, and links to external resources, in respective densities, in ways that allow individuals to find the knowledge they need quickly.
(2) Identify what knowledge is missing in the targeted area:
B perform a gap analysis to determine what knowledge is missing to achieve the
business goals; and
B determine who needs the missing knowledge.
(3) Provide recommendations from the knowledge audit to management regarding the status quo and possible improvements to the knowledge management activities in the targeted area.
An essential output of the knowledge audit process is the knowledge map for providing insight for improving business and organizational processes. A knowledge map portrays the sources, flows, constraints, and sinks (losses or stopping points) of knowledge within an organization. Well-developed knowledge maps help identify intellectual capital (Liebowitz, 2003), socialize new members, and enhance organizational learning (Wexler, 2001). Knowledge maps have been used for a variety of applications, even for developing a
knowledge map of knowledge management software tools (Noll et al., 2002). An
organization should map its knowledge to (Grey, 1999):
‘‘
A knowledge map portrays the sources, flows, constraints,
and sinks (losses or stopping points) of knowledge within an
organization.
’’
B encourage re-use and prevent re-invention, saving search time and acquisition costs; B highlight islands of expertise and suggest ways to build bridges to increase knowledge
sharing;
B discover effective and emergent communities of practice where learning is happening; B provide a baseline for measuring progress with KM projects; and
B reduce the burden on experts by helping staff find critical information/knowledge quickly.
Some of the key principles in knowledge mapping are establish boundaries and respect personal disclosures, recognize and locate knowledge in a wide variety of forms, and locate knowledge in processes, relationships, policies, people, documents, conversations, suppliers, competitors, and customers. The types of questions asked to develop a knowledge map include (Grey, 1999):
B What type of knowledge is needed to do your work?
B Who provides it, where do you get it, how does it arrive?
B What do you do, how do you add value, what are the critical issues?
B What happens when you are finished?
B How can the knowledge flow be improved, what is preventing you doing more, better,
faster?
B What would make your work easier?
B Who do you go to when there is a problem?
Typically, information is collected for the knowledge map by using the following methods (Grey, 1999):
B conduct surveys, interviews, and focus groups;
B observe the work in progress;
B obtain network traffic logs, policy documents, org charts, process documentation; B explore the common and individual file structures;
B concentrate on formal and informal gatherings, communications, and activities; B gather from internal/external sources; and
B move across multiple levels (individual, team, department, organization).
To help develop a knowledge map, SNA can be used. The next section will address SNA techniques and tools.
3. Social network analysis techniques and tools
According to Hanneman (2002), SNA is the mapping and measuring of relationships and flows between people, groups, organizations, computers or other information/knowledge processing entities. SNA involves actors (seeing how actors are located or ‘‘embedded’’ in the overall network) and relations (seeing how the whole pattern of individual choices gives rise to more holistic patterns). SNA has been used in sociology, anthropology, information systems, organizational behavior, and many other disciplines. For example, Crosset al. (2001) used SNA to partly determine if employees of the acquired firm are socializing and seeking answers to questions from those of the acquiring firm. Related link analysis has also been used in such applications as developing socio-spatial knowledge networks for chronic
‘‘
A key part of KM is performing a knowledge audit to determine
knowledge flows within an organization.
’’
disease prevention (Craveyet al., 2001) and developing academic networks and expertise in British higher education (Eldridge and Wilson, 2003).
The basic idea of SNA is that individual people are nested within networks of face-to-face relations with other persons. Families, neighborhoods, school districts, communities, and even societies are, to varying degrees, social entities in and of themselves (Hanneman, 2002). The social network analyst is interested in how the individual is embedded within a structure and how the structure emerges from the micro-relations between individual parts (Hanneman, 2002). This could then be applied at an organizational level to see how the ‘‘actors’’ (e.g. employees, departments, etc.) relate to each other via their interactions. Through SNA, a knowledge map could be generated to aid in the knowledge audit process. Within SNA, there are a variety of strategies used to collect measurements on the relations among the set of actors. One method is called ‘‘full network methods’’ whereby information about each actor’s ties with all other actors is collected. One major limitation of this technique is that it may be costly and difficult to collect full network data. A second group of methods is called the ‘‘snowball methods’’ whereby the analyst begins with a focal actor or set of actors. Then, each of these actors is asked to name some or all of their ties to other actors. Then, these ‘‘other actors’’ are asked for some or all of their ties, and the snowball effect continues until no new actors are identified (or until some stopping rule is determined). The limitations with this method are that those who are ‘‘isolated’’ may not be identified and it may be unclear as to where to start the snowball rolling. The third major strategy used in SNA is the use of egocentric networks. With this approach, one would begin with a selection of focal nodes (egos) and identify the nodes to which they are connected. Then, one would determine which of the nodes identified in the first stage are connected to one another. Egocentric methods focus on the individual, rather than on the network, as a whole (Hanneman, 2002).
In order to measure the information collected about ties between actors, there are nominal, ordinal, and interval/ratio levels of measurement. The zero-one binary scale is an example of a nominal scale and would show if ties are absent (zero) or present (one). The multiple-category nominal measures of relations is similar to multiple choice versus the true-false binary representation. The ordinal measures of relations are similar to a Likert scale and can determine the ‘‘strength’’ of ties. However, the third class of measures of relations, namely the interval/ratio method, is the most advanced level of measurement that allows the actors to discriminate among relations (e.g. this tie is three times as strong as that tie) (Hanneman, 2002).
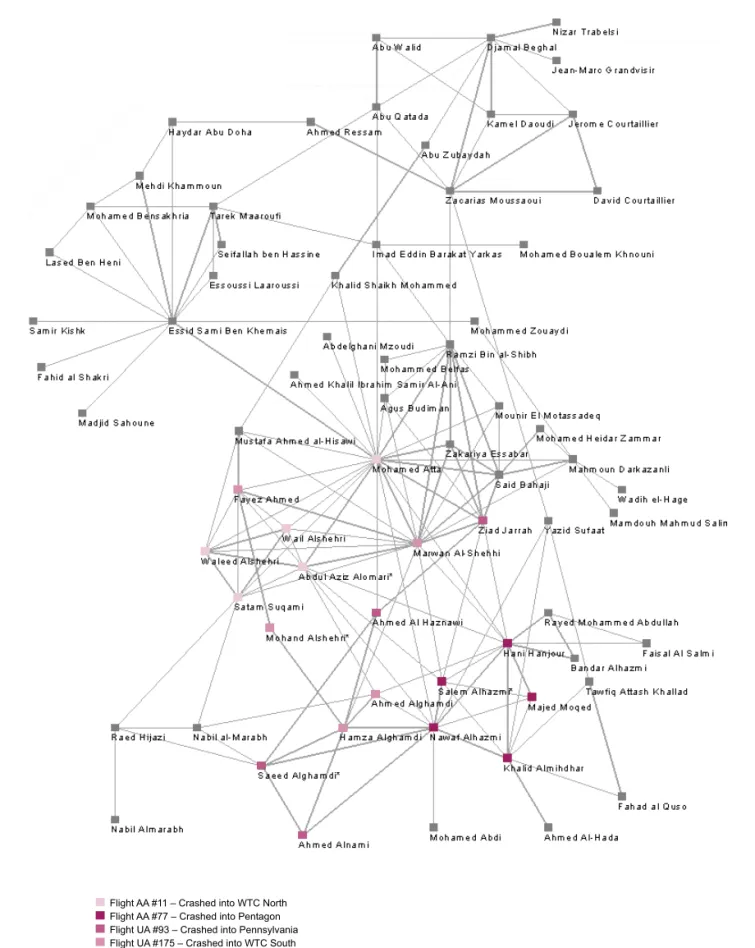
Examples of social networks are shown in Figures 1-3.
3.1 Social network analysis tools
There are a variety of SNA tools that are available for developing and visualizing social networks. The International Network of Social Network Analysis (www.sfu.ca/,insna/) is an excellent site that provides access to these various tools. Some of the leading SNA software is:
B Agna (www.geocities.com/imbenta/agna/index.htm);
B Analytic Technologies (Ucinet, Krackplot, Netdraw, Anthropac etc.) (www.analytictech.
com/);
B Classroom Sociometrics software (www.classroomsociometrics.com/);
B Fatcat (www.sfu.ca/,richards/Pages/fatcat.htm);
B InFlow (www.orgnet.com/index.html);
‘‘
To help develop the knowledge map, SNA and associated
B Java for Social Networks (www.public.asu.edu/,corman/jsocnet/); B MultiNet (www.sfu.ca/,richards/Multinet/Pages/multinet.htm);
B Negopy (www.sfu.ca/,richards/Pages/negopy4.html);
B NetMiner (www.netminer.com/NetMiner/home_01.jsp);
B Pajek (http://vlado.fmf.uni-lj.si/pub/networks/pajek/default.htm); B Siena (http://stat.gamma.rug.nl/snijders/siena.html);
B SocioMetrica LinkAlyzer (www.md-logic.com/id142.htm);
B STOCNET (http://stat.gamma.rug.nl/stocnet/); and
B Visone (www.visone.de/).
InFlow, Krackplot, and NetMiner are three of the leading SNA tools. InFlow was developed by Valdis Krebs and has been used for a myriad of applications ranging from analyzing
Figure 2 Social network analysis of individuals within an IT department (using InFlow software) (www.orgnet.com)
patterns of e-mail usage to discovering book buying behaviors at Amazon.com (Johnson, 2003). InFlow performs network analysis and network visualization in one integrated package (www.orgnet.com). Krackplot, originally developed by David Krackhardt and now distributed by Analytic Technologies, is a social network visualization program. NetMiner also is a network analysis and visualization tool that includes 15 analysis tools commonly used in SNA research.
4. The analytic hierarchy process
An important part of SNA is being able to provide the measures of relations (i.e. strengths of the ties) between the actors. We previously indicated that the interval/ratio method is preferred for determining the measures of relations. One technique that has not been applied to SNA to calculate the interval/ratio measures is the AHP.
AHP was developed by Thomas Saaty (1980) at the University of Pittsburgh to aid decision makers in the evaluation process. It quantifies subjective judgments used in decision-making, and has been applied in numerous applications throughout the world (Saaty, 1982). AHP uses pairwise comparisons in order to determine relative levels of importance or preference. Expert Choice is a software package that automates the use of AHP on a PC.
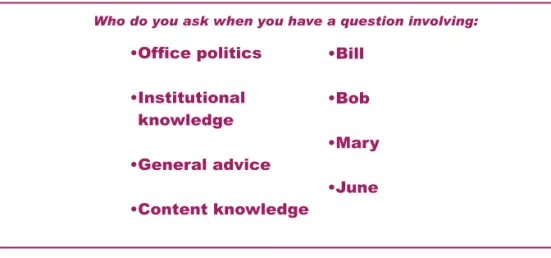
Let us take an example using AHP for use in SNA. The first step is to construct a tree hierarchy to show the goal at the top, then criteria in the next level, and then alternatives at the lowest level. If we are trying to develop a knowledge map using SNA, then we would like to determine knowledge flows between individuals in the organizations. Thus, we might want to ask Jay (an employee in the organization) the question ‘‘who do you ask when you have a question involving . . . ’’ to be the goal at the top of the hierarchy, as shown in Figure 4.
The criteria might be: office politics, institutional knowledge, general advice, and content knowledge. The alternatives might be Bill, Bob, Mary, and June (of course, you should
Figure 3 Social network analysis (www.orgnet.com) – org. mapping depicting departments
include all the necessary individuals as pertinent to the application). Then, Jay can start to enter his verbal judgments to weight the criteria and then weight the alternatives versus each criterion, using AHP/Expert Choice, as follows: With respect to the goal, are ‘‘office politics’’ more important than ‘‘institutional knowledge’’, and if so, how much more important? A scale of relative importance developed by Saaty is applied to translate the verbal judgments into numeric values:
(1) Equal importance.
(3) Moderate importance.
(5) Strong importance.
(7) Very strong importance.
(9) Extreme importance.
The values of 2, 4, 6, and 8 are intermediate values. Jay would then enter all the pairwise comparisons for the criteria, which would result in weighted criteria that add up to one. In this example, Jay’s preferences on his criteria, with respect to the goal, are shown in Table I. Now, the overall weight that Jay is assigning to each criterion must be determined. It is calculated by taking each entry and dividing by the sum of the column where it appears (http://mat.gsia.cmu.edu/mstc/multiple/node4.html). For example, the (office politics, office politics) entry would end up as 1=ð1þ1=3þ1þ3Þ ¼0:188. The other entries are shown in Table II.
The average weights on the criteria suggest that the most important criteria, in order, according to Jay are content knowledge (about 39 percent), general advice (about 29 percent), office politics (about 22 percent), and institutional knowledge (about 10 percent). Note that the percentages should add up to 100 percent.
The next step is to weight the alternatives versus each criterion using pairwise comparisons. The same procedure is conducted. The relative scores for each of the alternatives versus the criteria are shown in Table III.
Table I Jay’s preferences on his criteria
Office politics Institutional knowledge General advice Content knowledge
Office politics 1 3 1 1/3
Institutional knowledge 1/3 1 1/3 1/3
General advice 1 3 1 1
Content knowledge 3 3 1 1
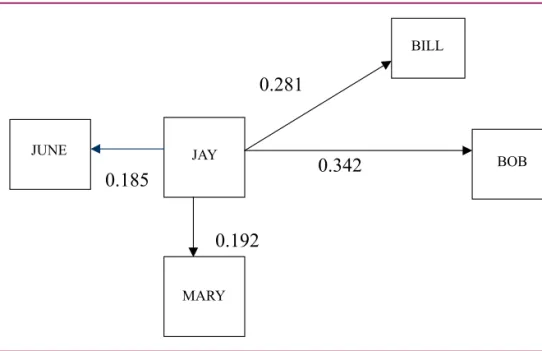
In terms of whom Jay should ask for getting answers to his questions about office politics, Bill would be the best person to provide advice (due to the highest weight (0.433) for Bill versus that for Bob, Mary, and June). Referring back to our overall weights, we can now get an overall value for each alternative. This is called the synthesis step. For example, the overall value for Bill is calculated as:
ð0:223Þð0:433Þ þ ð0:096Þð0:250Þ þ ð0:287Þð0:357Þ þ ð0:394Þð0:147Þ ¼0:281:
Again, these weights should total one. Based on the synthesis, Bob has the highest weight (0.342), then Bill (0.281), Mary (0.192) and lastly June (0.185), as shown in Figure 5. This suggests, for example, that Jay seeks out Bill’s help the most when it comes to getting answers to Jay’s questions on office politics and general advice, and Bob’s help the most
Table III The relative scores for each of the alternatives versus the criteria
Bill Bob Mary June
Office politics 0.433 0.238 0.169 0.161
Institutional knowledge 0.250 0.250 0.250 0.250
General advice 0.357 0.172 0.235 0.235
Content knowledge 0.147 0.548 0.158 0.147
Table II The overall weight of Jay’s entries
Office politics Institutional knowledge General advice Content knowledge Average
Office politics 0.188 0.333 0.300 0.124 0.223
Institutional knowledge 0.062 0.100 0.100 0.124 0.096
General advice 0.188 0.333 0.300 0.375 0.287
Content knowledge 0.563 0.333 0.300 0.375 0.394
Figure 5 Synthesis using AHP/expert choice
when Jay has content knowledge-related questions. We could then use these values to be the ‘‘strengths of the ties’’ between Jay and the other individuals. Thus, a valued graph as shown in Figure 6 can be developed using these ratio values. These could then be integrated within the SNA to help develop the knowledge map.
Integrating AHP with SNA can be a novel approach. However, there is a possible drawback. If there are many individuals in the organization, it may become laborious and tedious to apply the pairwise comparisons as there will be a tremendous number of comparisons to be made. But, if the focus of study is on interactions within a specific department or between departments in the organization, then this approach may be quite feasible.
5. Summary
This paper introduces the integrated use of the AHP with SNA to produce interval/ratio measures for use in an organization’s knowledge map. This approach has wider implications in the knowledge management field than just knowledge mapping. For example, Weber and Aha (2002) indicate that about 70 percent of the lessons learned systems are ineffective. A major reason given is the lack of an active or ‘‘push’’ feature for analysis and dissemination of the lessons. In order to determine what lessons would be appropriate to ‘‘push’’ to users, a user profile could be developed. Here, AHP could be applied in building the profile to determine the relative preferences on which topics of interest are relatively more important than others to the user in order to receive lessons learned in these areas. SNA could then be used to develop the valued graphs used in a knowledge map for depicting, for example, the different types of lessons received.
Developing AHP weightings on nodes should enhance the typical SNA algorithms for things like centrality, betweenness, and others. We could also use the weightings to do a more fine-grained filtering of the maps (e.g. remove weak links). Additionally, SNA maps may be used to annotate an AHP decision hierarchy. For example, when traversing the decision hierarchy, we might be able to understand how a particular weighting was achieved by referencing across to the people making the judgments to see how they might be related in a social network sense (e.g. tightly clustered or quite disparate).
This paper hopefully encourages others to apply AHP or other methods to determine the ratio measures of relations used in SNA for knowledge mapping. In this manner, knowledge maps could become more meaningful in depicting the strength of relationships for organizational business process improvement.
References
Chauvel, D. and Despres, C. (2002), ‘‘A review of survey research in knowledge management: 1997-2001’’,Journal of Knowledge Management, Vol. 6 No. 3, pp. 207-23.
Cravey, A., Washburn, S., Gesler, W., Arcury, T. and Skelly, A. (2001), ‘‘Developing socio-spatial knowledge networks: a qualitative methodology for chronic disease prevention’’,Social Science and Medicine Journal, Vol. 52 No. 12, pp. 1763-75.
Cross, R., Borgatti, S. and Parker, A. (2001), ‘‘Beyond answers: dimensions of the advice network’’, Social Networks Journal, Vol. 23 No. 3, pp. 215-35.
Earl, M. (2001), ‘‘Knowledge management strategies: toward a taxonomy’’,Journal of Management Information Systems, Vol. 18 No. 1, pp. 215-33.
Eldridge, D. and Wilson, E. (2003), ‘‘Nurturing knowledge: the UK higher education links scheme’’, Public Administration and Development Journal, Vol. 23 No. 2, pp. 125-209.
Grey, D. (1999), ‘‘Knowledge mapping:a practical overview’’, available at: www.it-consultancy.com/ extern/sws/knowmap.html (accessed March).
Hanneman, R. (2002), ‘‘Introduction to social network methods’’, available at: www.faculty.ucr.edu/ ,hanneman/
Harris, K., Kolsky, E. and Lundy, J. (2003), ‘‘The case for knowledge management in CRM’’,Gartner Research Note, Stamford, CT, April 21.
Johnson, S. (2003), ‘‘Who loves ya, baby?’’,Discover, Vol. 24 No. 4.
Liebowitz, J. (2003),Addressing the Human Capital Crisis in the Federal Government: A Knowledge Management Perspective, Butterworth-Heinemann/Elsevier, Oxford.
Liebowitz, J., Montano, B., McCaw, D., Buchwalter, J., Browning, C., Newman, B. and Rebeck, K. (2000), ‘‘The knowledge audit’’,Journal of Knowledge and Process Management, Vol. 7 No. 1. Noll, M., Frohlich, D. and Schiebel, E. (2002), ‘‘Knowledge maps of knowledge management tools: information visualization with BibTechMon’’, in Karagiannis, D. and Reimer, U. (Eds),Practical Applications of Knowledge Management 2002 Conference Proceedings, Springer-Verlag, New York, NY.
Pluskowski, B. (2002), ‘‘Dynamic knowledge systems’’, White Paper, Imaginatik Research, Boston, MA, June, available at: www.imaginatik.com
Saaty, T. (1980),The Analytic Hierarchy Process, McGraw Hill, New York, NY. Saaty, T. (1982),Decision Makers for Leaders, Wadsworth Publishing, Belmont, CA.
Weber, R. and Aha, D. (2002), ‘‘Intelligent delivery of military lessons learned’’, Decision Support Systems Journal, Vol. 34, pp. 287-304.
Wexler, M. (2001), ‘‘The who, what, and why of knowledge mapping’’,Journal of Knowledge Management, Vol. 5 No. 3, pp. 249-64.