Data-Driven Thermal Efficiency Modeling and
Optimization for Multi-fuel Boiler
Jian-GuoWang,aJia-Lin Kang,bShyan-ShuShieh,c Shi-Shang Jang,b David Shan-Hill Wongb
a
School of Mechatronical Engineering and Automation, Shanghai University,Shanghai Key Lab of Power Station Automation Technology,Shanghai 200072, China
b
Department of Chemical Engineering, National Tsing-Hua University,Hsin-Chu 30013, Taiwan
c
Department of Occupational Safety and Health, Chang Jung Christian University,Tainan 71101, Taiwan
Abstract
A data-driven modeling and optimization scheme for thermal efficiency is developed based on the real operation data from a multi-fuel boiler. The plant input variables are transformed into the derived variables, which are physically and statistically meaningful for modeling. Then, this study proposed an adaptive modeling approach by employing nonnegative garrote variable selection and auto-regression integrated moving average correction. The high accuracy of the proposed modeling approaches makes the implementation of the model-based control of ratio of air to fuel for improving boiler’s efficiency readily practicable.
Keywords: Multi-fuel boiler; thermal efficiency; nonnegative garrote; variable
selection; data-driven; statistics analysis
1.Introduction
BFG is the byproduct of manufacturing process in large-scale iron and steel plant, which is a typical low-heating-value gaseous fuel with low flame temperature and weak radiative heat-transfer capability. The supply of BFG is unstable in terms of flow rate and heating value in the batch-type production process. To maintain stable operation of the boiler, the flow rate of coal is adjusted to cope with varying supply of self-produced gases. In fact, the challenge to operate a co-firing boiler in an efficient way in the presence of gases fuel has attracted attention of many researchers from different fields for more than a decade (Hou et al.,2011; Shieh et al., 2011).
Artificial neural networks and evolutionary computation can be used to handle nonlinearity, but these methods are operated in a black-box fashion and thus inevitably suffer from over fitting and vague interpretability. Though PCR/PLS/CVA can suppress the sensor variables into a few key latent variables(Jackson, 1991; Höskuldsson, 1988; Shi et al., 2000), they may still include contributions from a large number of predictor variables. This is highly undesirable because operators would fail to understand the physical meanings of the input-output relation and focus on a manageable number of key factors.
Some studies reported that the combustion model built by a selected subset of input variables make more accurate predictions of combustion efficiency than the whole set of variables in the coal-fired boiler. Recently, shrinkage methods, which conduct variable
selection by shrinking or setting some coefficients of a “greedy” model to zero, receive much attention. One of popular forms of these methods is the non-negative garrote (NNG) (Breiman, 1995). This study developed a data-driven modeling and optimization scheme utilizing NNG for thermal efficiency of BFG/coal co-firing boiler.
The rest of the paper is organized as follows. In the next section, system description is introduced. In Section 3, the formation of derived variables and justification of their significance are illustrated. In Section 4, the theoretical framework of an adaptive modeling is presented. The application of the proposed modeling approach is demonstrated in Section 5. A model-based control strategy is given and applied to the efficiency improvement in Section 6. Some remarks are concluded in the last section.
2.System Background description
The studied subject is one of twelve boilers and eight turbines with 410 MW overall rated capacity in a large iron and steel plant in Taiwan. The fluctuating heating value of BFG, as well as its flow rate poses challenges to operate BFG/coal co-firing boilers in an efficient way. The data used in this study were collected from the studied subject from April17 to May11, 2007.The operation data are taken every minute. After removing the abnormal samples, 15000 samples remained.
Among the most relevant input and output parameters of the BFG/coal co-firing boiler, the eight input parameters can be partitioned into three parts, i.e. (1) feed water related: flow rate , temperature before the economizer , temperature after economizer , and pressure ; (2) fuel related: coal flow rate , flow rate , and heating value ; (3) air related: air flow rate . The boiler output parameters include two parts, i.e. (1) main steam related: flow rate , temperature , and pressure ; (2) flue gases related: oxygen concentration in flue gas and carbon monoxide concentration in flue gas .
3.Formation and Incorporation of Derived Variables
3.1. Incorporation of three derived variables and LDA analysis
As mentioned in the previous section, the steam production in the boiler is regulated to serve the varying process demand. Among the boiler input parameters, four variables are loading directly related, namely, , , and . The total input energy provided by coal and BFG, denoted as , is also related to boiler loading.
To address the influence of loading variation, two ratio parameters and
are derived. Moreover, it is obvious that the ratio of providing energy to total fuel is related to boiler’s efficiency. Hence the ratio parameter is incorporated. Replacing the four loading related variables, the three derived variables and the other four boiler input variables are considered to develop thermal efficiency model.
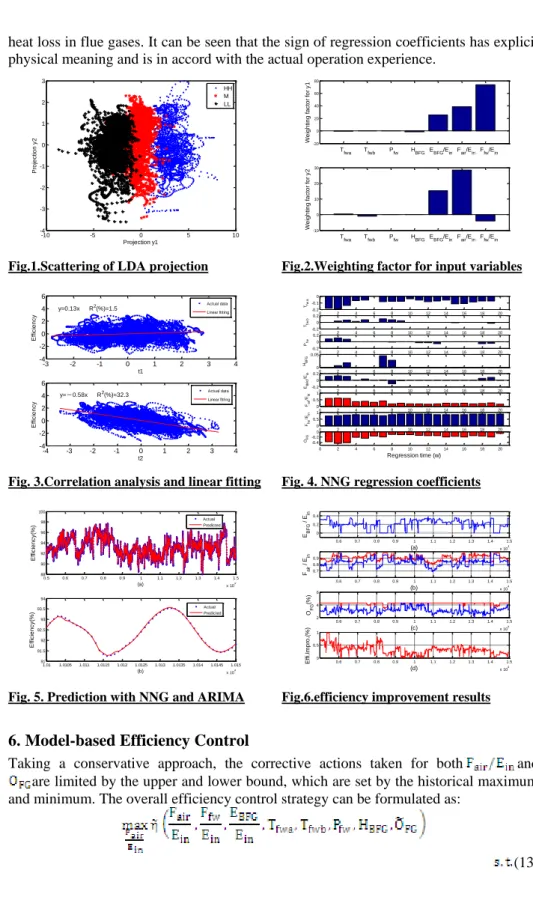
Linear discriminant analysis (LDA) is utilized to verify whether these three derived variables take important roles in determining efficiency levels. All the data are partitioned into five groups according to their efficiency levels. With descending order, five efficiency levels are denoted as HH, H, M, L, and LL. LDA analysis is conducted on three groups of data with levels of HH, M, and LL. The scattering of LDA projection for these efficiency levels and the weighting factor for all input variables composing projection y1 and y2are shown in Fig.1 and Fig.2 respectively. The figures reveal that three groups are clearly differentiated by LDA projection and the three most significant variables are the derived variables.
3.2. Incorporation of and PCA Analysis
The oxygen concentration in flue gases is long recognized as an index related to thermal efficiency. Correlation analysis are conducted to investigate relationship for efficiency to and . The results indicates poor linear relationship, with of between efficiency and , and of between efficiency and . However, from the experience, we know that could not be irrelevant to thermal efficiency. Principal component analysis(PCA) is further conducted to investigate the relationship of thermal efficiency to and . The results of correlation analysis and linear fitting of efficiency to 1st and 2nd PC are shown in Fig.3.
Note that the score of the 1stPCexplains of variations in and , but it can only explains of variations in thermal efficiency. In contrast, the score of the 2nd PC only accounts for of total variations in and , but it can only explains 32.3% of variations in thermal efficiency. The results indicate that the linear combination of and taking opposite signs is strongly related to the thermal efficiency of the boiler. Hence, the variable cannot be excluded in building thermal efficiency models and the efficiency model can be given as
(1)
4.Adaptive Modeling Using NNG and ARIMA
4.1. NNG variable selection
The NNG method can be generalized into a two-stage shrinkage method. In the first stage the sign for each variable is determined using ordinary least square (OLS) procedure and in the second stage the corresponding magnitudes are computed by solving a series of constrained quadratic programming.
Suppose being given a set of observation data , where is the input matrix whose columns represent the measured candidate variables, and is the corresponding vector of response data. Suppose that and have been normalized to zero-mean and unitary standard deviation. Let be a set of the ordinary least square estimates of the coefficients of the following linear model
(2) The second stage shrinkage can be formulated as the following optimization problem:
(3) As is decreased and the non-negative garrote is tightened and thus more of the become zero and the remaining nonzero coefficients are shrunken. A solution path exists with on which the appropriate shrinkage can be selected. The optimal selection can be determined with v-fold cross-validation(Zhang, 1993).
The overall coefficients can be determined by solving the optimization problem: (4) NNG regression coefficient can be given as
(5)
4.2. ARIMA model correction
Given set of measured input data , the prediction of , can be obtained
(6) Although the NNG prediction accuracy has been enough for ordinary usage, it is not satisfactory for efficiency improvement. When conducting time series correlation analysis for the NNG prediction error of efficiency and , denoted as ,
it is discovered that there is high correlation between and and the time series of prediction error is non-stationary. Hence, ARIMA(1,1,1) model is adopted to improve the prediction accuracy as follows
(7) where is back shift operator, is a zero mean white noise with variance , and are two coefficients to be identified. The following two equations are obtained:
(8) (9) Given and corresponding NNG prediction with length ,the coefficients and can be estimated by minimizing the objective function
(10) After the ARIMA(1,1,1) model is obtained, the new prediction can be given as
(11) Adaptive strategy is often used to deal with time-varying characteristics of industrial processes. In this paper, the NNG regression and ARIMA correction methods is implemented in moving window manner.
It should be noted that adaptive modeling and prediction should be conducted for both efficiency and to implement efficiency control.
5.Efficiency and Modeling and Prediction
5.1. Efficiency modeling and prediction
Setting the length of observation window as 5000 and the length of prediction horizon 500, hence there are 20 observation windows for modeling and 20 prediction horizons. The adaptive modeling method with NNG and ARIMA was applied to thermal efficiency modeling and prediction. Fig. 4 shows the NNG regression coefficients of the eight variables in modeling for each of 20 observation windows. The average in 20 NNG regressions is and the root-mean-square of prediction error (RMSE) is . However, the model is considered to be too rough to be incorporated to the model-based control in the case of boiler operation. To further improve modeling reliability, ARIMA(1,1,1) model was adopted. Fig. 5 shows the prediction results for interval [5000 15000], a large scale, and [10100 10150], a close look. The RMSE of the prediction error throughout the whole prediction horizon is .
5.2. modeling and prediction
As given in equation (1), is treated as one of model inputs in building the thermal efficiency model. model is constructed as follows
(12) The same adaptive modeling method was applied to . It is found that all the coefficients of have positive sign, which accord with the fact that the increase of air supply will result in the higher .Note that all the signs of regression coefficients of variable are positive in Fig. 4.The positive coefficients mean that we can increase to improve boiler efficiency. In contrast, all the signs of regression coefficients of variable are negative, which mean that when being increased, the boiler efficiency will degrade. Hence, the effect of boiler efficiency improvement from the increase of is constrained, since the increase of
heat loss in flue gases. It can be seen that the sign of regression coefficients has explicit physical meaning and is in accord with the actual operation experience.
-10 -5 0 5 10 -4 -3 -2 -1 0 1 2 3 Projection y1 P ro je c ti o n y 2 HH M LL
Fig.1.Scattering of LDA projection
-20 0 20 40 60 80 Tfwa Tfwb Pfw HBFG EBFG/Ein Fair/Ein Ffw/Ein W e ig h ti n g f a c to r fo r y 1 -10 0 10 20 30 Tfwa Tfwb Pfw HBFG EBFG/Ein Fair/Ein Ffw/Ein W e ig h ti n g f a c to r fo r y 2
Fig.2.Weighting factor for input variables
-3 -2 -1 0 1 2 3 4 -4 -2 0 2 4 6 t1 E ff ic ie n c y y=0.13x R2 (%)=1.5 -4 -3 -2 -1 0 1 2 3 4 -4 -2 0 2 4 6 t2 E ff ic ie n c y y=-0.58x R2 (%)=32.3 Actual data Linear fitting Actual data Linear fitting
Fig. 3.Correlation analysis and linear fitting
0 2 4 6 8 10 12 14 16 18 20 -0.2 -0.1 0 Tfw a 0 2 4 6 8 10 12 14 16 18 20 -0.2 0 0.2 Tfw b 0 2 4 6 8 10 12 14 16 18 20 -0.2 0 0.2 Pfw 0 2 4 6 8 10 12 14 16 18 20 0 0.05 HB FG 0 2 4 6 8 10 12 14 16 18 20 -0.2 0 0.2 EBF G /Ein 0 2 4 6 8 10 12 14 16 18 20 0 0.5 1 Fair /E in 0 2 4 6 8 10 12 14 16 18 20 0 0.5 1 Ffw /E in 0 2 4 6 8 10 12 14 16 18 20 -0.4 -0.2 0 Regression time (w) OF G
Fig. 4. NNG regression coefficients
0.5 0.6 0.7 0.8 0.9 1 1.1 1.2 1.3 1.4 1.5 x 10⁴ 88 90 92 94 96 98 100 (a) E ff ic ie n c y (% ) 1.01 1.0105 1.011 1.0115 1.012 1.0125 1.013 1.0135 1.014 1.0145 1.015 x 10⁴ 91 91.5 92 92.5 93 93.5 94 (b) E ff ic ie n c y (% ) ActualPredicted Actual Predicted
Fig. 5. Prediction with NNG and ARIMA
0.6 0.7 0.8 0.9 1 1.1 1.2 1.3 1.4 1.5 x 10⁴ 0 0.2 0.4 (a) EBF G / E in 0.6 0.7 0.8 0.9 1 1.1 1.2 1.3 1.4 1.5 x 10⁴ 0.7 0.8 0.9 (b) Fa ir / E in 0.6 0.7 0.8 0.9 1 1.1 1.2 1.3 1.4 1.5 x 10⁴ 2 4 6 (c) OFG (% ) 0.6 0.7 0.8 0.9 1 1.1 1.2 1.3 1.4 1.5 x 10⁴ 0 0.5 1 (d) E ff i. Im p ro .( % )
Fig.6.efficiency improvement results
6.Model-based Efficiency Control
Taking a conservative approach, the corrective actions taken for both and are limited by the upper and lower bound, which are set by the historical maximum and minimum. The overall efficiency control strategy can be formulated as:
Apply the efficiency control strategy to determine the optimal . In the same moving window manner as in modeling and prediction, the efficiency in interval [5001 15000] could be controlled based on the obtained model. Fig.6 shows the results after implementing the model-based control for the thermal efficiency. The original operation data of , and are indicated in blue color, while the adjusted
, and the improvement in thermal efficiency in the red color.
The actual operation curves shown revealed that the more BFG share was in fuel, the less is needed. The trend is in accord with the combustion theory that coal as the solid fuel needs more amount of air to achieve complete combustion than BFG in term of unit heating value. Comparing the data of between the real operation and the proposed adjustment, the actions taken by the operator were correct, but were not accurate enough to reach optimal air supply. The results revealed that higher throughout the interval is needed to improve thermal efficiency in our studied case, especially in the case of high BFG input.
The increase of on average is , and the improvement of thermal efficiency averages at . The benefit/cost ratio is significant enough when considering almost no fixed cost is needed in the implementation of model-based control in this case for any real boiler operation.
7.Conclusion
A data-drivenscheme of thermal efficiency modeling and optimization fora BFG/coal co-firing boiler was investigated based on thereal operation data. The derived variables are found more physical meaningful than some plain variables in constructing the model of thermal efficiency in the case of the co-firing boiler. The models of thermal efficiency and oxygen concentration in the flue gas were built by the proposed adaptive algorithm based on NNGvariable selection and ARIMAcorrection.The implementation of model-based control was virtually studied based on the real operation data of a BFG/coal co-firing boiler. The arriving of the high accuracy prediction models would convince the operator to shift the present practice to model-based control and explore the room for energy conservation with high benefit/cost ratio.
References
A.Höskuldsson, 1988, PLS regression methods, Journal of Chemometrics, 2, 211-228. J. E.Jackson, 1991, A User’s Guide to Principal Components, New York, Wiley.
L. Breiman,1995, Better subset regression using the nonnegative garrote, Technometrics, 37, 373-384.
R. J. Shi, J. F.Macgregor, 2000, Modeling of dynamic systems using latent variable and subspace methods. Journal of Chemometrics, 14, 423-439.
S. S.Hou, C. H.Chen, C. Y.Chang, C. W.Wu,J. J.Ou , T. H.Lin,2011, Firing blast furnace gas without support fuel in steel mill boilers, Energy Conversion and Management, 52, 2758-2767.
S. S.Shieh, Y. H.Chang, S. S.Jang, M. D.Ma, T. S.Huang, 2011, Statistical key variable analysis and model-based control for the improvement of thermal efficiency of a multi-fuel boiler,Fuel, 89,1141-1149.
Zhang, P. (1993). Model selection via multifold cross validation. The Annals of Statistics , 21, pp. 299-313.