Volume 21 Volume 21, 2016 Article 3 2016
Getting Lucky: How Guessing Threatens the Validity of
Getting Lucky: How Guessing Threatens the Validity of
Performance Classifications
Performance Classifications
Brett P. FoleyFollow this and additional works at: https://scholarworks.umass.edu/pare Recommended Citation
Recommended Citation
Foley, Brett P. (2016) "Getting Lucky: How Guessing Threatens the Validity of Performance Classifications," Practical Assessment, Research, and Evaluation: Vol. 21 , Article 3. DOI: https://doi.org/10.7275/1g6p-4y79
Available at: https://scholarworks.umass.edu/pare/vol21/iss1/3
This Article is brought to you for free and open access by ScholarWorks@UMass Amherst. It has been accepted for inclusion in Practical Assessment, Research, and Evaluation by an authorized editor of ScholarWorks@UMass Amherst. For more information, please contact [email protected].
A peer-reviewed electronic journal.
Copyright is retained by the first or sole author, who grants right of first publication to Practical Assessment, Research & Evaluation. Permission is granted to distribute this article for nonprofit, educational purposes if it is copied in its entirety and the journal is credited. PARE has the right to authorize third party reproduction of this article in print, electronic and database forms.
Volume 21, Number 3, February 2016 ISSN 1531-7714
Getting Lucky: How Guessing Threatens the Validity of
Performance Classifications
Brett P. Foley, Alpine Testing Solutions, Inc.
There is always a chance that examinees will answer multiple choice (MC) items correctly by guessing. Design choices in some modern exams have created situations where guessing at random through the full exam—rather than only for a subset of items where the examinee does not know the answer— can be an effective strategy to pass the exam. This paper describes two case studies to illustrate this problem, discusses test development decisions that can help address the situation, and provides recommendations to testing professionals to help identify when guessing at random can be an effective strategy to pass the exam.
When an exam includes multiple choice (MC) items, there is always a chance that examinees will answer items correctly by guessing. Historically, there has been a great deal of research on the effects of guessing on reliability and validity, as well as various methods to correct for guessing behavior (e.g., Diamond & Evans, 1973; Frary, 1969). In current practice, and in some theoretical measurement models, it is often assumed that the effects of guessing are negligible. Some scholars have described the threat of guessing as “overrated” (Haladyna, 2004, p. 113). However, design choices in some modern exams have created situations where guessing at random through the full exam—rather than only for a subset of items where the examinee does not know the answer— can be an effective strategy to pass the exam. Obviously, such a situation calls into question the utility of the exam and the validity of any content-based interpretations of the exam results.
This article begins with a definition of the problem of extensively guessing throughout an exam and describes means to calculate guessing probabilities. Next, we discuss current assessment design decisions that can create situations where guessing at random can be an effective strategy to pass exams, thus lowering the
validity of content-based interpretations of the exam results. This discussion is followed by two case studies that show real-world examples of how guessing through the full exam can be a viable strategy. We then discuss strategies to address guessing behavior at various stages in the test development process and conclude with a brief discussion of policy considerations related to these test development decisions.
Defining the Problem
As mentioned previously, the extensive body of research on guessing on MC exams goes back decades (e.g., Hamilton, 1950; Wood, 1976; Zimmerman & Williams, 1965). However, the majority of this research assumes examinees take the exam seriously by answering items they know and guessing only when they do not know an answer. In contrast, the type of guessing that this paper is concerned with is pervasive, where the examinee randomly guesses on most or all of the items on an exam. We will refer to this type of guessing as full-exam random guessing (hereafter, FERG). On its face, FERG appears to be a terrible test-taking strategy that no examinee would seriously consider using. However, examines could benefit from this strategy in specific testing situations. For example, consider an exam given
in English to an English Language Learner (ELL) who has very low English proficiency or a mathematics exam with lengthy story problems given to a student with only minimal reading ability. If examinees do not understand the language on the exam, they may have no other recourse than FERG.
As higher stakes for students and teachers are attached to assessments, the pressure to raise exam scores increases, sometimes through unethical means. Consider a situation where a teacher is administering an oral MC exam to students of very low ability. In practice, MC item writers are instructed to write distractors that are plausible and would be attractive to those who lack the necessary knowledge to answer the item correctly (Haladyna, 2004). With this in mind, it may be a reasonable (though unethical) decision for the teacher to instruct the students to adopt FERG, rather than attempting items and being drawn to attractive, but incorrect, response options.
To put it more bluntly, in this era of growing resistance to standardize testing (e.g., Eichenwald, 2015; Gorski, 2014), a newspaper report that one can get out of the bottom category in a testing program by random guessing just looks bad. Regardless of how many psychometricians say it is unlikely, public disclosure that a testing program is susceptible to FERG might result in a substantial erosion in the face validity and public buy-in for the program. Even though buy-in many cases it is unlikely that most examines would use FERG, putting forth an assessment design where FERG could be effective is an unnecessary risk.
Estimating the Probability of Success When Using FERG
Clearly, exams should be constructed to minimize the probability of someone passing (or reaching some other performance threshold) by using FERG. But before those design decisions can be made, one needs to understand how to calculate the likelihoods of achieving various scores through FERG, and to determine an operational definition of “unlikely.”
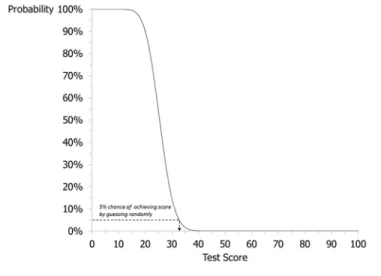
Consider a 100-item exam consisting of 4-option MC items. When asked what score an examinee likely would obtain by using FERG on this exam, many would correctly reply “25” (a 0.25 chance of guessing each question correctly multiplied by 100 items). However, 25 is only the average score one would obtain across many repeated FERG attempts. Approximately half of the
time examinees would score higher than 25, and about 15% of the time examinees would score 30 or higher. Theoretically, there is a miniscule, but non-zero, chance that the examinee could score 100% correct.
If an exam is being used to classify examinees (e.g., pass/fail, below basic/basic/proficient/advanced, master/non-master), the cut score necessary for entrance into the lowest meaningful performance category beyond the minimum performance category (i.e., the “minimum classification threshold”) should be set at a score that one would be unlikely to achieve with FERG. Because any score on the exam is theoretically possible when using FERG, it is necessary to choose an operational definition of “unlikely.” Although any definition will be necessarily arbitrary, there is some precedent for using 5% as a cutoff. Specifically, 5% frequently is used as the cutoff for the value of alpha (i.e., the probability of a type I error) in many statistical tests and is adopted as a threshold by some publications. As in other statistical situations, it would be prudent to adopt a more stringent threshold (e.g., 1%) for a very high-stakes decision, or a less stringent threshold (e.g., 10%) for a low-stakes decision. For simplicity, we will adopt 5% as the operational definition of “unlikely” for the remainder of this paper.
Applying the 5% threshold to the above example, we can see in Figure 1 that the minimum classification threshold should be set at or above 33 points. In other words, with a 100-item, 4-option MC exam, the minimum cut score should be set at 33 points (or more) in order for examinees to have a less than 5% chance of achieving the minimum classification threshold by using FERG. The probabilities shown in the figure are calculated using the cumulative binomial distribution. Instructions to calculate these values for different testing situations using Microsoft Excel are included in Appendix A. Appendix B includes SAS code to estimate these probabilities for exams that consist of items with a variety of guessing probabilities (e.g., a combination of 3-, 4-, and 5-option MC items).
Figure 1. The probability of achieving various scores using a FERG strategy on a 100‐item, 4‐option MC exam.
Design Decisions that Make Guessing More Attractive
Giving multiple retake opportunities, removing response options, and reducing exam lengths have all been put forth as reasonable and examinee-friendly assessment design choices. However, each of these decisions can have an effect on the attractiveness of FERG as a test-taking strategy.
When high stakes are associated with exam performance, examinees are typically allowed retake opportunities. The Standards for Educational and Psychological Testing specifically call for retake opportunities to be provided when tests affect student promotion or graduation decisions (APA, AERA, and NCME, 2014, Standard 12.9). These retake opportunities increase the likelihood of achieving a minimum classification threshold due to chance. For example, consider an assessment where the minimum classification threshold has been set so that there is a 5% chance of an examinee achieving the threshold when using FERG. If the testing program allows up to 4 administrations of the exam (i.e., the original exam plus 3 retake opportunities) there is an 18.5% chance of an examinee achieving the threshold on at least 1 administration of the exam when using a FERG strategy on each attempt. Referring back to the earlier example, in a 100-item, 4-option MC exam, applying the 5% threshold required the minimum classification threshold to be set at or above 33 points. If 3 retake opportunities were allowed for the assessment, minimum classification
threshold should be set at or above 36 points in order to maintain the same 5% probability of achieving the minimum classification threshold using the FERG strategy (see Figure 2). Appendix A provides instructions for how to calculate the probabilities of achieving various minimum classification thresholds in Microsoft Excel when retakes are allowed and the FERG strategy is applied for each attempt.
Figure 2. The probability of achieving various scores using a FERG strategy on a 100‐item, 4‐ option MC exam with 3 retake opportunities.
Researchers have noted that removing response options can make assessments more accessible to students with disabilities and ELLs (Beddow, Elliott, & Kettler, 2009; Beddow, Kettler, & Elliott, 2008; Beddow, Kurx, & Frey, 2011). Additionally, there is an emerging consensus in the psychometric literature that supports the use of 3-option MC items (Rodriguez, 2005). However, as the number of response options decreases, the likelihood of success due to guessing increases. For example, for a 175-item exam, the minimum classification threshold when using 5-option MC items should be set to at least 58; when using 3-option MC items, the minimum classification threshold should be at least 70 in order to avoid examinees reaching the minimum classification threshold by using FERG.
Reducing exam length to decrease testing burden and giving multiple retake opportunities on high-stakes exams have both been put forth as reasonable assessment design choices. In K-12 testing, shorter exams can help to assuage the concerns of those worried about too much classroom time taken up by accountability testing. Similarly, shorter credentialing
exams require less seat time and may therefore result in lower administration costs.
Although the necessary values for the minimum classification threshold is proportional to exam length, short exams present additional problems, especially when multiple cut scores need to be set. For example, on a 40-item, 4-option MC exam, the minimum classification threshold should be at least 16. If 3 cut scores were set on such an exam, they would all be compressed into the 17-40 range. Because the cut scores in this situation would only differ by a few points, the classification consistency would likely be poor. Figure 3 shows how exam length, MC item type, and retake opportunities interact when identifying the minimal value for minimum classification thresholds
Figure 3. Minimum classification thresholds in order to have a 5% (or less) chance of achieving the threshold using FERG, for various exam lengths, retake policies, and MC item formats.
Case Studies
At this point, the discussion of FERG as a strategy has been hypothetical and the chances of it becoming an effective strategy for test takers may seem far-fetched. However, the following two case studies present large-scale, real-world assessments where FERG could be used effectively.
Case Study #1
This case is based on a set of recently delivered statewide K-12 accountability assessments for students with severe cognitive disabilities. Each exam was individually administered (i.e., one student assessed at a
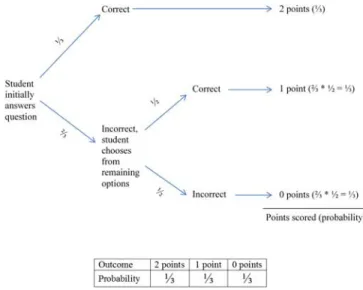
time as opposed to group administered) and consisted of 15, 3-option MC items. If the student answered the item correctly, the student received 2 points. If the student answered the item incorrectly, the student was allowed to choose again from the remaining two options. If the student answered the item correctly on the second try, the student received 1 point. If the student answered the item incorrectly on the second try, the students received 0 points for that item. Therefore, the total possible score ranged from 0 to 30 for each exam.
Given the scoring procedure for these exams, when a student guesses on an item, his/her expected score for that item is 1 (see Figure 4). This makes achieving high scores by using FERG very likely. For example, a student has an approximately 26% chance of scoring 20 or higher using FERG. The effect of guessing is even more pronounced at lower score points: a student has an approximately 80% chance of scoring 10 or higher when guessing. The probabilities of achieving various scores on these exams are shown in Figure 5.
Figure 4. Visual explanation of the probabilistic outcomes for a given item if a student used the FERG strategy.
In order to set a minimum classification thresholds where examinees have a 5% (or less) chance of achieving the threshold using FERG, the threshold needs to be set at 27 out of 30 (or higher). In other words, if we were setting multiple cut scores for this exam, the lowest cut score should not be less than 27 if we want to avoid
having people score above the cut score by randomly guessing through the whole exam. This issue could be somewhat remediated if the scoring rules were amended to remove the “second chance” option (see Figure 5). Without the second chance option (where the examinee gets to try to choose a correct answer from among the remaining options) the lowest cut score could be set as low as 18 points. Figure 5. Probability of getting an exam score (or higher) using the FERG strategy, given the Case #1 test design, with and without the second chance option. Case Study #2
This case is based on a recently administered educational assessment for adults that was delivered nationally. This program classifies adults into 1 of 7 performance categories. There are three different versions of the operational exam, each targeted at a different ability range (i.e., low, moderate, high). Each version of the operational exam is 38, 3-option MC items. A shorter locator exam is used to determine which version of the operational exam is administered. If an examinee scores very low on the operational exam, the examinee is not placed into a performance category and instead receives a “no score.”
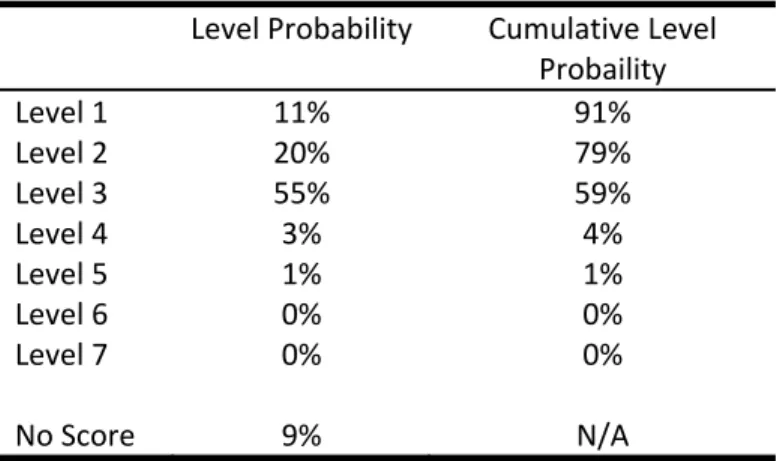
Using the cut scores for the locator exam and the operational exams, the probabilities of being placed into each performance category when using FERG were calculated (see Table 1). Ideally, one would want an examinee who guessed randomly all the way through the locator exam and then through the operational exam that they were assigned to score in the lowest performance level (or receive a “no score”). However, the actual
results from FERG are much different: there is a greater-than-a-coin-flip (55%) probability of being classified at Level 3, and overall there is a 79% chance of being classified at Level 2 or higher when using FERG.
Table 1. Probabilities of Being Placed into Each Performance Level on the Case Study #2 Exam by Using the FERG Strategy Level Probability Cumulative Level Probaility Level 1 11% 91% Level 2 20% 79% Level 3 55% 59% Level 4 3% 4% Level 5 1% 1% Level 6 0% 0% Level 7 0% 0% No Score 9% N/A
Although it is very unlikely that an examinee can use FERG to be placed into one of the highest performance categories, these results raise serious questions about the utility and meaning of the lowest performance categories. In order to reduce the probability of being classified into a level greater than Level 1 when using the FERG strategy, the operational exam lengths would need to be extended to greater than 50, while maintaining the same cut scores.
Strategies to Combat FERG
In many educational and credentialing assessment programs, cut scores are set using criterion-referenced performance standards. These performance standards are based on the absolute (as opposed to relative/normative) levels of performance as defined by performance level descriptors (education) or descriptions of the knowledge, skills, and abilities of a minimally qualified candidate (credentialing). Clearly, as seen in the case studies, these criterion-referenced decisions can result in the placement of one or more cut scores at score points where, based on the design of the assessment and the question formats, an examinee may achieve these scores using the FERG strategy. The following sections identify different phases of the assessment development process where steps can be taken to minimize the effectiveness of FERG.
Early in the Assessment Development
Process
Choosing item types
Steps taken early in the assessment development process may be some of the most effective in limiting the effectiveness of FERG. One solution would be to use constructed response (CR) items in lieu of MC items. However, while CR items are less susceptible to guessing, they also have some disadvantages (e.g., high scoring costs). Alternatively, choosing MC varieties that are less susceptible to guessing may be helpful. Figure 3 shows how 5-option MC items are less susceptible to FERG than are 3-option MC items. Alternatively, dichotomously scored multiple-select MC items can reduce the effectiveness of FERG. For example, a 4-option multiple-select MC where the examinee selects 2 correct options has a .167 chance of being guessed correctly (as opposed to a traditional 4-option MC item, which has a .250 chance of being guessed correctly). One downside of some of the MC item variations is the increased difficulty in writing additional effective distractors (see Item Development and Review section below).
Choosing administration designs
The choice of administration design may be an effective method to protect against FERG. Computerized adaptive test (CAT) designs dynamically assign items to examinees based on the examinee’s ability (as estimated by the items that they have completed to that point in the test). CAT designs can protect against FERG in two ways. First, because examinees are presented items that are well-matched to their ability level, they are less likely to resort to guessing in the first place (Wainer & Mislevy, 2000). Second, in CAT models that are based on an IRT model that includes a pseudo-guessing parameter, guessing may not need to be accounted for because the scores “…are adjusted for guessing in a much more sophisticated way than are conventional formula scores” (Dorans, 2000, p. 141). One drawback of the CAT designs is that they require large item banks and large examinee volumes in order to have accurate item statistics for making appropriate item selections.
Designing the test blueprint
FERG can be especially problematic when exams are difficult (or have items with very homogeneous levels
of difficulty) and have multiple cut points. For this type of exam, standard setting panelists working from a criterion-referenced performance definition may choose a cut score that is near the low end of the scale. From a content perspective, the cut score may be defensible, but if it is so low that examinees can pass using FERG, any content-based interpretation of the performance classification associated with that cut point will be suspect. The cut score cannot be arbitrarily raised to nullify the effect of guessing without also increasing performance expectations. One way around this problem is to add a sufficient number of low-difficulty items to the test blueprint in order to allow standard setting panelists to set cut scores high enough that examinees would be extremely unlikely to pass by guessing alone. In this way, the cut score does not increase (in terms of performance expectations) so much as the test scale is extended downward. The content of the easier items must still be relevant and fit under of the umbrella of the construct that the test was designed to measure. One disadvantage of this method is that it will increase the length of the test (though this may also result in increased reliability). Additionally, it may introduce some inefficiency to the measurement. That is, for examinations with important decision points (e.g., transitions between performance categories) targeting most items to have difficulty levels near the associated decision points can maximize the accuracy of the test scores around that decision point. In cases with these important decision points, adding easy items is inefficient in that it will likely do little to improve measurement precision around the cut points. However, it will help prevent examines from passing by using FERG.
Reducing the number of performance
categories/adding graded forms
Once initial assessment design decisions have been made (e.g., exam lengths, item types, whether or not to allow retake opportunities and how many), the program will have enough information to estimate the lowest score for the minimum classification threshold that would be susceptible to FERG (see Appendix A and Appendix B; for sophisticated scoring designs, computer simulation may be necessary). Upon calculating these probabilities, the program may learn that the assessment, as designed, will not support the required number of performance categories. One solution would be to reduce the number of performance categories. Another
would be to create multiple, graded exam forms (e.g., a high ability form and a low ability form with a locator test to determine which form an examinee takes) that each support a subset of the performance categories. However, the utility of these solutions may be limited by policy constraints. That is, the number of performance categories may be dictated by regulations. Similarly, policy considerations may require administering the same exam (or multiple forms parallel in content and difficulty) to all examinees, rendering the graded form solution unfeasible.
During Item Writing and Review
Because the number of response options has a large effect on the impact of FERG (see Figure 2), it is essential to continuously remind item writers and reviewers of the importance of including high-quality, plausible distractors. Effective item writing training is also crucial because, “Writing plausible distractors … is the most difficult part of MC item writing” (Haladyna, 2004, p. 120). Four-option MC items may not have a benefit over (and may function more like) 3-option MC items if the items include poor-performing, throw-away distractors.
During Scoring
Adjusting scores for guessing
There is an extensive literature on adjusting MC exam scores to account for guessing. (e.g., Budescu & Bar-Hillel, 1993; Little 1966; Lord, 1963; Mattson; 1965; Zimmerman & Williams, 2003). A summary of the standard correction for guessing is shown in Appendix C. While many discussions about corrections for guessing are based on classical test theory (CTT), there have also been correction methods developed for IRT (see Chiu, 2010) and models designed for the explicit modeling of guessing (e.g., Park, Pituch, Kim, Dodd, & Chung, 2015). Lesage, Valcke, and Sabbe (2013) provided a summary of some newly developed alternatives to traditional guessing adjustment methods. Although there are several guessing adjustment methodologies to choose from, there is not a consensus in the psychometric field as to which the best is, nor whether or not corrections for guessing should be applied. A primary downside of correcting for guessing during scoring is that examinees must be made aware of the methodology being used; the appropriate test-taking strategy will vary based on the type of guessing adjustments (Lesage et al., 2013). Similarly, when
guessing adjustments are to be applied, it is essential that such adjustments are clearly explained in the instructions to examinees. Another potential problem (for scoring adjustments and other means of accounting for guessing) is that assumptions must be made about examinees’ guessing behaviors that may not universally apply (e.g., risk aversion may be a confounding factor). Finally, for the most part, these adjustments assume that examinees answer items correctly when they know the right answer. With FERG, the examinee does not attempt to answer items, so the effectiveness of some of these procedures in addressing FERG does not have as extensive a research base (though it stands to reason that the effectiveness of the adjustments may generalize to FERG).
Identifying aberrant response patterns
FERG is clearly an aberrant response pattern. As such, it can be identified through statistical means. Smith (1993) recommends using fit statistics to identify randomly guessing examinees when using the Rasch model. Karabasos (2003; also working with the Rasch model), reviewed 36 person-fit indices and found several that were effective in identifying examinees who used FERG. Additional detection methods based on classical statistics are also discussed in Rogers (1997). A primary drawback of these methods is that while they can provide evidence that an examinee was using FERG, they do not prove it. Therefore, it is unclear how to treat examinees who are flagged using these methods (e.g., cancelling their scores). As in cheating investigations, testing programs will need to develop clear, defensible policies to deal with flagged candidates if such a course of action is adopted. An additional limitation of these methods is that as the proportion of examinees with aberrant response patterns increases, these aberrancies become more difficult to detect (Karabasos, 2003). (This is likely less of a problem because in most cases only a small percentage of examinees will use FERG.)
During Standard Setting
In some cases it may be possible to adjust for guessing during the standard setting process. For example, Plake and Cizek (2012) described three ways of adjusting the cut scores obtained when using the Yes/No variation of the Angoff standard setting method (Impara & Plake, 1997). A variation of this adjustment is shown in Appendix D. When using this adjustment, the standard setting panelists are instructed to make judgments based on the underlying question,
“Would the borderline examinee likely get the question right because they know the right answer.” In this type of standard setting activity, panelists typically are provided with additional statistics to inform their decisions. Often these statistics include p-values (the proportion of examinees who answered each question correctly) and impact data (the proportion of examinees in each performance category based on the panel’s recommendations).
Although not noted in Plake and Cizek (2012), this statistical information also should be adjusted for guessing if guessing adjustments are to be applied to the recommended cut scores. If the p-values and impact data are not adjusted, they will be too high (i.e., inflated due to guessing) and may bias the standard setting panel’s recommendations. An illustration of how to adjust p-values is shown in Appendix E (see also, Davis, 1951; Lindquist & Hoover, 2015). Scores can be adjusted to calculate impact data using the method listed in Appendix C or through some other adjustment for guessing.
A downside of adjusting standard setting results for guessing is that the process requires making similar assumptions about guessing behavior as those made when calculating guessing adjustments during scoring. That is, fairness issues may be associated with these adjustments. If adjusting the cut scores can be viewed as a post-hoc penalty for guessing, some would argue that candidates should be told about it in advance in order to adjust their test taking strategies (e.g., do not leave any items unanswered).
Discussion
It is the responsibility of researchers, test developers, and users to ensure that placing examinees into a performance level on a test indicates that the examinee has demonstrated the requisite knowledge, skills, and abilities, as opposed to succeeded through random guessing. Testing situations where guessing at random can be an effective strategy for passing the exam harm the validity of content-based interpretations of the exam results. As illustrated in the case studies shown here, guessing on assessments is not a theoretical problem, but a real challenge that must be taken into account and balanced against competing goals when developing assessments.
The information presented here about the potential effects of FERG leads to a specific recommendation: Testing programs should estimate the probability
of achieving the minimum classification threshold when using FERG early in the assessment development process. Appendices A and B provide two methods to calculate these probabilities. For programs using sophisticated scaling methodologies, statistical simulations may be necessary to calculate these probabilities. The earlier a program identifies FERG as a potential threat, the greater the range of available remediation tools. Alternatively, if a program does not find out that FERG is a threat until after the exam is administered, potential means of remediation may be very limited. For example, standard setting adjustments may be the only possible solution because scoring changes may not be feasible. That is, if examinees were not informed of the guessing adjustment prior to taking the exam and allowed to modify their test taking strategy appropriately, it would be unfair to adopt certain guessing adjustments.
Some may argue that it seems unrealistic to assume that test takers would ever view FERG as a legitimate strategy. However, the case studies presented here illustrate that some existing large-scale testing programs are susceptible to this strategy, which raises doubts about the validity of performance classifications based on these exams (and subsequent decisions based on those classifications). Testing programs may need to alter their assessment designs in order to ensure that examinees are placed in performance categories based on what they know rather than how well they can guess.
References
American Educational Research Association, American Psychological Association, and National Council on Measurement in Education (2014). Standards for educational and psychological testing. Washington, DC: American Educational Research Association.
Beddow, P. A., Elliott, S. N., & Kettler, R. J. (2009). TAMI accessibility rating matrix. Nashville, TN: Vanderbilt University.
Beddow, P.A., Kettler, R. J., & Elliott, S. N. (2008). Test accessibility and modification inventory. Nashville, TN: Vanderbilt University.
Beddow, P. A., Kurz, A., & Frey, J. R. (2011). Accessibility theory: Guiding the science and practice of test item design with the test-taker in mind. In S. N. Elliott, R. J. Kettler, P. A. Beddow, & A. Kruz (Eds.), Handbook of accessible achievement tests for all students (pp. 201-216). New York, NY: Springer.
Budescu, D., & Bar-Hillel, M. (1993). To guess or not to guess: A decision theoretic view of formula scoring.
Journal of Educational Measurement, 30(4), 277-291. Chiu, T. (2010). Correction for guessing in the framework of
the 3PL item response theory. Unpublished Ph.D., Rutgers, The State University of New Jersey, New Brunswick, NJ.
Davis, F. B. (1951). Item selection techniques. In E. F. Lindquist (Ed.), Educational measurement (pp. 266-328). Washington, DC: American Council on Education. Diamond, J., & Evans, W. (1973). The correction for
guessing. Review of Education Research, 43(2), 181-191. Doras, N. J. (2000). Scaling and Equating. In H. Wainer
(Ed.), Computerized adaptive testing: A primer (2nd ed., pp. 135-158). Mahwah, NJ: Lawrence Erlbaum Associates.
Eichenwald, K. (2015, March 10). The ugly civil war in American medicine. Newsweek. Retrieved from http://www.newsweek.com/2015/03/27/ugly-civil-war-american-medicine-312662.html
Frary, R. B. (1969). Elimination of the guessing component of multiple-choice test scores: Effect on reliability and validity. Educational and Psychological Measurement, 29, 665-680.
Gorski, E. (2014, November 14). Thousands of Colorado high school students refuse to take state tests. The Denver Post. Retrieved from
http://www.denverpost.com/news/ci_26930017/thou sands-of-colorado-high-school-students-refuse-to-take-state-tests?source=infinite
Haladyna, T. M. (2004). Developing and validating multiple-choice test items (3rd ed.). Mahwah, NJ: Lawrence Erlbaum Associates.
Hamilton, C. H. (1950). Bias and error in multiple-choice tests. Psychometrica, 15, 151-168.
Impara, J. C. & Plake, B. S. (1997). Standard setting: An alternative approach. Journal of Educational Measurement, 34(4), 353-366.
Karabatsos, G. (2003). Comparing the aberrant response detection of thirty-six person-fit statistics. Applied Measurement in Education, 16(4), 277-298.
Lesage, E., Valcke, M., & Elien, S. (2013). Scoring methods for multiple choice assessment in higher education – Is it still a matter of number right scoring or negative marking? Studies in Educational Evaluation, 39, 188-193.
Lindquist, E. F., & Hoover, H. D. (2015). Some notes on corrections for guessing and related problems.
Educational Measurement: Issues and Practice, 34(2), 15-19. Little, E. B. (1966). Overcorrection and undercorrection in multiple-choice test scoring. The Journal of Experimental Education, 35(1), 44-47.
Lord, F. M. (1963). Formula scoring and validity. Educational and Psychological Measurement, 23(4), 663-672.
Mattson, D. (1965). The effects of guessing on the standard error of measurement and the reliability of test scores.
Educational and Psychological Measurement, 25(3), 727-730. Park, R., Pituch, K. A., Kim, J., Dodd, B. G., & Chung, H.
(2015). Marginalized maximum likelihood estimation for the 1PL-AG IRT model. Applied Psychological Measurement, 39, 448-464.
Plake, B. S., & Cizek, G. J. (2012). Variations on a theme: The Modified Angoff, Extended Angoff, and Yes/No standard setting methods. In G. J. Cizek (Ed.), Setting performance standards (2nd ed., pp. 181-199). New York, NY: Routledge.
Rodgers, H. J (1997). Guessing in multiple choice tests. In J. P. Keeves (Ed.), Educational research, methodology, and measurement: An international handbook (2nd ed., pp 766-771). Tarrytown, NY: Elsevier Science Inc. Rodriguez, M. C. (2005). Three options are optimal for
multiple-choice items: A meta-analysis of 80 years of research. Educational Measurement: Issues and Practice, 24(2), 3-13.
Smith, R. M. (1993). Guessing and the Rasch model. Rasch Measurement Transactions, 6(4), 262-263.
Wainer, H., & Mislevy, R. J. (2000). Item response theory, item calibration, and proficiency estimation. In H. Wainer (Ed.), Computerized adaptive testing: A primer (2nd ed., pp. 61-100). Mahwah, NJ: Lawrence Erlbaum Associates.
Wood, R. (1976). Inhibiting blind guessing: The effect of instructions. Journal of Educational Measurement, 13(4), 297-307.
Zimmerman, D. W., & Williams, R. H. (1965). Effect of chance success due to guessing on error of
measurement in multiple-choice tests. Psychological Reports, 16, 1193-1196.
Zimmerman, D. W., & Williams, R. H. (2003). A new look at the influence of guessing on the reliability of multiple-choice tests. Applied Psychological Measurement, 27(5), 357-371.
Appendix A. Using Microsoft Excel to Estimate the Probability of Scoring at or
Above a Given Score by Randomly Guessing When Each Exam Item has the
Same Chance Probability
1For a Single Administration
The probability is estimated using the binomial distribution function in Excel. Values that are needed:
A = the score to be checked
B = the exam length (i.e., number of scored items)
C = the probability of getting an item correct when randomly guessing (usually, 1 divided by the number of response options2 )
Enter the following equation into an empty cell in an Excel spreadsheet. Replace the A, B, and C, values with the actual values of interest. D is the resulting probability.
D = (1 - BINOM.DIST(A,B,C,TRUE)) + BINOM.DIST(A,B,C,,FALSE)
The result is the probability of an examinee getting the score of interest (or higher) by randomly guessing during a single administration.
When Retakes are Allowed
This calculation is needed to answer a slightly different question that is of interest when retakes are allowed: “What is the probability of an examinee getting the score of interest (or higher) on at least one test administration by randomly guessing?”
Values that are needed:
D = the probability calculated in the previous step
E = the number of possible administrations (e.g., original administration + 3 retake opportunities = 4 possible administrations)
Enter the following equation into an empty cell in an Excel spreadsheet. Replace the D value with the probability calculated above and E with the value of interest.
=1 - BINOM.DIST(0,E,D,FALSE)
1 If items have different probabilities of success when randomly guessing (e.g., the exam contains a combination of 3-, 4-, and 5-option MC
items), the average probability of success across items can be used with the equations shown to approximate the probabilities. For more accurate results, use the SAS code in Appendix B.
2 If multiple-select MC items are used, the COMBIN function in Excel can be used to estimate the chance probability of success when
randomly guessing on an item. For example, if the exam items each have 5 response options from which the examinee selects the best two (and the item is scored with no partial credit), the chance probability of success can be calculated by entering the following equation into an empty cell in an Excel spreadsheet
=1/COMBIN(5,2)
The result, in this case, is 0.1. That is, with 5 options, 10 unique pairs of 2 items can be created, so randomly guessing two options would have a 1/10 = 0.1 probability of resulting in a correct response.
Appendix B. Using SAS to Estimate the Probability of Scoring at or Above a
Given Score by Randomly Guessing When Exam Items Have Different Chance
Probabilities
*************************************************************** * Directions: * * * * Enter the guessing probabilities for each item below the * * term 'datalines,' one per line, and run the full program. * * * * Explanations for the various steps are provided below. * * * * The program takes about 2 minutes to run under the default * * settings for a 100-item test. Run times will also vary with * * computer processing power * * * ***************************************************************;
data probabilities; input guess_prob; datalines;
ENTER PROBABILITIES HERE, ONE PER LINE (REMOVE THIS LINE OF TEXT) ;
run;
*************************************************************** * This section estimates performance on the exam for a sample * * of examinees using the probabilities entered above. * * * * The program estimates the performance for 100,000 examinees * * randomly guessing their way through the test * * * * If more/fewer examinees are desired, replace the 100000 * * value in the “do" statement below with the desired sample * * size. Larger sample sizes provide more precise results, but * * will take longer to analyze. * * * * The value "90210" below is a seed for random number * * generation and can be replaced with any number you choose. * ***************************************************************; data examinee_outcomes; set probabilities; do examinee = 1 to 100000; guess_outcome = ranbin(90210,1,guess_prob); output; end; run;
*************************************************************** * This section calculates total score for each examinee * ***************************************************************;
proc sort; by examinee; run;
proc univariate data=examinee_outcomes noprint; by examinee;
var guess_outcome;
output out=examinee_scores sum=score; run;
*************************************************************** * This section calculates and prints the score distribution * * for randomly guessing examinees. The resulting cumulative * * frequency values indicate the percent of examinees scoring * * at or above a given value. * ***************************************************************;
proc sort data=examinee_scores; by descending score; run;
proc freq data=examinee_scores order=data noprint; table score/out=frequency_table outcum;
run;
proc sort data=frequency_table; by score; run;
proc print data=frequency_table; run;
Appendix C. Estimating the Number of Items Where the Examinee Knows the
Answer, Accounting for Skipping Behavior
Let
the number of items on the test
the observed number of correct responses
′ the observed number of incorrect responses
Assumption 1: The test is scored dichotomously, where the examinee receives one point for a correct answer and zero points for an incorrect answer.
Assumption 2: Skipped items are scored as incorrect. Therefore, based on Assumptions 1 and 2,
′ (C1)
Let
the number of items where the examinee knows the answer
the number of items where the examinee does not know the answer
Assumption 3: Examinees respond correctly to the questions where they know the answer.
Assumption 4: When examinees don’t know the answer, they either guess at random or skip the item. Therefore, based on assumptions 1-4,
(C2)
Let
the number of items where the examinee guesses the number of items where the examinee guesses correctly the number of items where the examinee guesses incorrectly the number of items where the examinee skipped the item Therefore
(C3) (C4) Solving Equation C3 for and solving Equation C4 for gives
(C5) (C6)
Given the above assumptions, the observed number of correct ( ) and incorrect ( ′ ) responses for an examinee can be expressed as
1 ∗ 1 ∗ 0 ∗ 0 ∗ , (C7)
′ 0 ∗ 0 ∗ 1 ∗ 1 ∗ , (C8)
Solving Equation C7 for and solving Equation C8 for gives
(C9)
′ (C10)
Let
the probability of guessing a given item correctly the probability of guessing a given item incorrectly
Based on Assumption 1
1 (C11)
Assumption 5: It is possible to obtain an estimate of the probability of guessing correctly for each item. Based on Assumptions 1-5, can be estimated as
∗ (C12)
Substituting from Equation C5 and simplifying gives
∗ (C13)
∗ ∗ (C14)
Solving Equation C14 for gives
∗
(C15) Substituting the value of from Equation C15 into Equation C6 gives
∗
(C16) Substituting the value of from Equation C16 into Equation C9 gives
∗
(C17)
Substituting the value of from Equation C10 into Equation C17 gives
∗
(C18) Using algebra, Equation C18 can be re-written as
1 1
(C19)
By substituting from equation C11 and reorganizing
(C20)
In other words, the number of items to which the examinee knew the answer can be estimated using the observed number of correct answers, the observed number of incorrect answers, the observed number of skipped items, and the probability of randomly guessing correctly/incorrectly. For very low observed scores, the estimated number of questions could be less than zero; in these cases it should be set to zero. Equation C20 is mathematically equivalent to the classic correction for guessing formula (see Lindquist & Hoover, 2015).
Appendix D. Adjusting a Cut Score to Account for Guessing, Accounting for
Skipping Behavior
Assumption 1: The exam is scored dichotomously, where the examinee receives one point for a correct answer and zero points for an incorrect answer.
Assumption 2: Skipped items are scored as incorrect.
Assumption 3: Examinees respond correctly to the questions where they know the answer.
Assumption 4: When examinees don’t know the answer, they either guess at random or skip the item. Assumption 5: It is possible to obtain an estimate of the probability of guessing correctly for each item. Assumption 6: Standard setting panelists were instructed to make judgments without regard for guessing. For example, standard setting panelists were instructed to estimate the likelihood of a borderline candidate getting the question correct because the candidate knew the correct answer.
Let
= the unadjusted passing score = the adjusted passing score
= the maximum possible score on the test (i.e., the total number of items) _ = the number of items where the examinee does not know the answer
For someone at the passing score (based on Assumption 6),
_ (D1)
Let
the number of items where the examinee guesses
_ the number of items where the examinee guesses correctly the number of items where the examinee answers incorrectly the probability of guessing a given item correctly
the probability that an examinee will guess item when they don’t know the answer
To account for guessing, we should adjust the passing score upward by the number of points (i.e., items) that we would expect the candidate at the passing score to not know but guess correctly:
_ (D2)
We can estimate the number of items where the candidate at the passing score will guess:
∗ _ (D3)
We can also estimate the number of items the examine will guess correctly
_ ∗ (D4)
Substituting the value of from Equation D3 into Equation D4 gives
_ ∗ ∗ _ (D5)
And substituting the value of _ from Equation D5 into Equation D2 gives
Xadj = Xraw + ∗ ∗Xdon’t_know (D6)
Finally substituting the value of Xdon’t_knowfrom Equation D1 into Equation D6 gives
∗ ∗ (D7)
is known from the standard setting study
is known based on the number of items on the test
can be estimated based on the number of response options (i.e., for a 3-option MC item, = .3333) is unknown.
In order to determine we must determine a reasonable estimate of . One way to estimate would be to use operational testing data and the calculations shown in Appendix C:
1. For each examinee, identify: a. the number of skipped items
b. the estimated number of items where the examinee did not know the answer (calculate using , as defined in the previous appendix)
2. Divide (a) the number of skipped items by (b) the estimated number of items where the examinee did not know the answer
3. Subtract the value from 1
4. Average the results across all examines to obtain an estimate of L
5. Plug the estimate of L into Equation D7 and solve to determine the Adjusted Cut Score
If examinees always skip the items for which they don’t know the answer, then L will equal zero and If examinees always answer every question, then L will equal 1 and Equation D7 will reduce to
∗ (D8)
Note that equation D8 is equivalent to the “1/A Guessing Adjustment” method described in Plake and Cizek (2012, pp. 196-197).
Example:
• (i.e., raw passing score) = 18 • (i.e., test length) = 38 • ≈ .3333 (three-option MC)
• ≈ .60 (this means that, on average, examinees guessed on an estimated 60% of items where they didn’t know the answer)
Adjusted passing score = 18 + [.3333 * .60 * (38-18)] = 18 + [4]
= 22
Appendix E. Estimating the Proportion of Examinees Who Know the Answer to
an Item, Accounting for Skipping Behavior
Let
the number of test takers
the number of test takers who provided correct responses
′ the number of test takers who provided correct responses
Assumption 1: The exam is scored dichotomously, where the examinee receives one point for a correct answer and zero points for an incorrect answer.
Assumption 2: Skipped items are scored as incorrect. Therefore, based on Assumptions 1 and 2,
′ (E1)
Let
the number of examinees who know the answer to the item the number of examinees who do not know the answer to the item
Assumption 3: Examinees respond correctly the questions where they know the answer.
Assumption 4: When examinees don’t know the answer, they either guess at random or skip the item. Therefore, based on assumptions 1-4,
(E2) Let
the number of examinees who guess on the item the number of examinees who guess correctly on the item the number of examinees who guess incorrectly on the item
the number of examinees who skip the item Therefore
(E3) (E4) Solving Equation E3 for and solving Equation E4 for gives
(E5) (E6)
Given the above assumptions, the observed number of people who provided correct ( ) and incorrect
( ′ ) responses for the item can be expressed as
1 ∗ 1 ∗ 0 ∗ 0 ∗ , (E7)
′ 0 ∗ 0 ∗ 1 ∗ 1 ∗ , (E8)
Solving Equation E7 for and solving Equation E8 for gives
(E9)
′ (E10)
Let
the probability of guessing the item correctly the probability of guessing the item incorrectly Based on Assumption 1
1 (E11)
Assumption 5: It is possible to obtain an estimate of the probability of guessing correctly the each item. Based on Assumptions 1-5, can be estimated as
∗ (E12)
Substituting from Equation E5 and simplifying gives
∗ (E13)
∗ ∗ (E14)
Solving Equation E14 for gives
∗
(E15)
Substituting the value of from Equation E15 into Equation E6 gives
∗
(E16)
Substituting the value of muc from Equation M16 into Equation E9 gives
∗
(E17)
Substituting the value of from Equation E10 into Equation E17 gives
∗
(E18)
Using algebra, Equation E18 can be re-written as
1 1
(E19)
By substituting from equation E11 and reorganizing
(E20)
Note: is the odds of guessing an item correctly.
Then, the obtain the proportion of examinees who know the correct answer to the item simply divide by
.
In other words, the proportion of examinees who knew the correct answer to an item can be estimated using the observed number of examinees who answered the question correctly, the observed number of examinees who answered the question incorrectly, the observed number of examinees skipped the question, and the probability of randomly guessing correctly/incorrectly.
Note: If very few examinees answer the question correctly, the estimated proportion could be less than zero. In these cases it should be set to zero.
Example:
• 1000 examinees are a given a 3-option MC test item ( ≈ .3333, ≈ .6667) • 700 answer the item correctly.
• 300 do not answer the item correctly (200 answer the item incorrectly, 100 skip the item). The traditional p-value estimate of item difficulty would be
700
1000 .70
To estimate the number of examinees who know the answer, we do the following:
700 . 3333
. 6667 300 100 600
Therefore, the adjusted p-value will be
600
1000 .60
Acknowledgement:
An early version of this paper was presented at the National Council on Measurement in Education Annual Conference.
The author would like to thank Drs. Amanda Wolkowitz, Susan Davis-Becker, and Andrew Wiley for their feedback on early versions of this paper. The author would also like to thank Jennifer Paine for her skillful editing. The paper was much improved thanks to these talented folks. Fault for any remaining errors or omissions lies with the author.
Citation:
Foley, Brett P. (2016). Getting Lucky: How Guessing Threatens the Validity of Performance Classifications. Practical Assessment, Research & Evaluation, 21(3). Available online: http://pareonline.net/getvn.asp?v=21&n=3
Author
Brett P. Foley
Professional Credentialing Practice Lead and Psychometrician Alpine Testing Solutions, Inc.