Institute of Economic Studies, Faculty of Social Sciences Charles University in Prague
Research & Development
and Long-Term Economic
Growth: A Bayesian Model
Averaging Analysis
Roman Horváth
Institute of Economic Studies,
Faculty of Social Sciences,
Charles University in Prague
[UK FSV – IES]
Opletalova 26
CZ-110 00, Prague
E-mail : [email protected]
http://ies.fsv.cuni.cz
Institut ekonomických studií
Fakulta sociálních v
ě
d
Univerzita Karlova v Praze
Opletalova 26
110 00
Praha 1
E-mail : [email protected]
http://ies.fsv.cuni.cz
Disclaimer: The IES Working Papers is an online paper series for works by the faculty and
students of the Institute of Economic Studies, Faculty of Social Sciences, Charles University in
Prague, Czech Republic. The papers are peer reviewed, but they are
not
edited or formatted by
the editors. The views expressed in documents served by this site do not reflect the views of the
IES or any other Charles University Department. They are the sole property of the respective
authors. Additional info at:
[email protected]
Copyright Notice: Although all documents published by the IES are provided without charge,
they are licensed for personal, academic or educational use. All rights are reserved by the authors.
Citations: All references to documents served by this site must be appropriately cited.
Bibliographic information:
Horváth, R. (2011). “Research & Development and Long-Term Economic Growth: A
Bayesian Model Averaging Analysis” IES Working Paper 19/2011. IES FSV. Charles University.
Research & Development and
Long-Term Economic Growth: A Bayesian
Model Averaging Analysis
Roman Horváth
#
#
Czech National Bank and
IES, Charles University Prague
E-mail: [email protected]
June 2011
Abstract:
We examine the effect of research and development (R&D) on long-term economic
growth using the Bayesian model averaging (BMA) to deal rigorously with model
uncertainty. Previous empirical studies investigated the effect of dozens of
regressors on long-term growth, but they did not examine the effect of R&D due to
data unavailability. We extend these studies by proposing to capture the R&D
intensity by the number of Nobel prizes in science. Using our indicator, our
estimates show that R&D exerts a positive effect on long-term growth with
posterior inclusion probability of 0.25 using our preferred parameter and model
priors.
Keywords: research and development, economic growth, Bayesian model averaging.
JEL:
O30, O32, O10.
Acknowledgements:
The support from the Czech Science Foundation research grant no. 402/09/0965 is
gratefully acknowledged. We appreciate the use of Matlab toolbox for Bayesian
model averaging developed by Martin Feldkircher and Stefan Zeugner.
1 Introduction
The positive eect of research and development of long-term economic growth is well established in economics literature and numerous endogenous growth theory models put forward that research and development is a key for growth (Barro and Sala-i-Martin, 1995). However, the empirical evidence is more scant and available either for a single country or a limited group of developed countries (Hasan and Tucci, 2010). The underlying reason is that more comprehensive R&D data has become available for a wider set of countries only recently (for example, R&D expenditures from about mid-1990s) and R&D is likely to in-uence the economic growth in the long-term. From empirical perspective, this poses challenges to identify the eect of R&D on long-term growth.
The current empirical literature on long-term growth has emphasized the role of model uncertainty (e.g. the uncertainty about correct model specication). The number of potential determinants of long-term growth is plentiful and many earlier studies have chosen the set of regressors in growth regression in ad hoc way, to a large extent. To deal with model uncertainty formally, Bayesian model averaging (BMA) techniques have recently gained popularity to study the determinants of long-term growth (Fernandez et al. (2001a), Durlauf et al. (2008), Ley and Steel (2009) or Eicher et al. (2011)). BMA has also been recently introduced to political science by Montgomery and Nyhan (2010) and is well established statistical technique also in natural sciences.
In principle, BMA is employed to cross-country growth linear regression. It is noteworthy that BMA oers several advantages. First, the number of regressors is limited only by the number of countries included in the regression analysis and in consequence a large number of regressors can be examined (for example, Fernandez et al. (2001a) and Eicher et al. (2011) examine 41 regressors). In consequence, this decreases omitted variable bias and many competing theories can be put in test jointly. Second, BMA introduces a rigorous way how to average across the models and thus, examine the robustness of results more systematically. Third, BMA gives a so-called posterior inclusion probability, i.e. an estimate of probability that given regressor is included in correct model.
As noted above, the set of regressors included in regression analysis in previ-ous studies is large. Nevertheless, neither any of previprevi-ous studies on long-term growth using BMA include the R&D indicators due to data unavailability. To acknowledge the endogeneity in growth regressions in a full manner, previous studies explain the long-term growth (more specically, typically growth from
1960s to present) using the regressors that are exogenous and therefore mostly based on the data before 1960 (or are exogenous by denition such as Asian dummy or access to coast). In consequence, the data on R&D are omitted, as they are very scarce for the aforementioned period.
This paper proposes to proxy the eorts various countries put in the research and development by the number of Nobel prizes received by the laureates from specic countries. Nobel prizes are the most reputable awards in science and it is very likely that the laureates will be aliated with institutions in countries that devote more resources on R&D. First, we show the number of Nobel prizes are correlated with the research and development expenditures in the long-term. Second, we include our R&D indicator in the dataset employed rst by Fernandez et al. (2001a) and subsequently by a number of other studies (more on this below), and examine its eect on economic growth.
Subject to various sensitivity tests, our results show that the research and development exhibits a positive eect on long-term economic growth. The pos-terior inclusion probability for our preferred prior structure is 0.25, which is not high, but comparable to variables such as exchange rate distortions, the share of primary exports or wars.
The paper is organized as follows. Section 2 briey introduces the Bayesian model averaging. Section 3 presents the data. The results are available in section 4. Conclusions are provided in section 5. Appendix with additional results follows.
2 Bayesian Model Averaging
This section gives a brief introduction to the Bayesian model averaging. We heavily follow Eicher et al. (2011). Other excellent treatments of BMA are available in Koop (2003), Koop et al. (2007), Feldkircher and Zeugner (2009), Ley and Steel (2009) or Montgemery and Nyhan (2010) to name few.
Suppose we have a dependent variable Y (long-term GDP growth in our
context) with a number of observationsn (the number of countries) andk
re-gressors X1...Xk. The standard procedure would be to estimate one model
Y =α1X1+..+αkXk+e,wheree∼N(0, σ2I)(assume thatX1is a constant).
However, in many applications there is a substantial uncertainty, which of
pos-sibly plentifulX's should be included. In principle, there arel= 2k subsets of
ex-amined. Let us denote the vector of parameter ofi-th model asθi= (α, σ).The
likelihood function ofi-th model,pr(D|θi, Mi)summarizes all the information
aboutθi based on available data D. The marginal likelihood, the probability
density of the data,D, conditonal onMi can be written as follows
pr(D|Mi) = ˆ
pr(D|θi, Mi)pr(θi|Mi)dθi, (1)
e.g. the marginal likelihod is a product of the likelihood function and prior
densitypr(θi|Mi)integrated over parameter space. Usingpr(D|Mi)one can
derive the prior probability thatMiis a correct model, this is denoted aspr(Mi).
Bayes's theorem gives the posterior model probability ofMi,pr(Mi|D),
pr(Mi|D) =
pr(D|θi, Mi)pr(Mi) Pi
l=1pr(D|Ml)pr(Ml)
(2)
the posterior inclusion probability of given regressor,pr(αj6= 0|D), is then
received by taking a sum of posterior model probabilities across those models that include the regressor. Posterior inclusion probability is of primary impor-tance here, since it indicates what is the probability that given regressor has an eect on dependent variable (long-term economic growth). This approach has been recently generalized to panel data setting to explicitly account for unobserved heterogeneity among countries (Benito, 2011).
It is computantionally prohibitive to evaluate all the posible models -242 in
our case and we use MC3to reduce the computational requirements (Madigan
and York, 1995). approximates the posterior distribution of model space by simulting a sample from it. We take 1 000 000 burn-ins and 3 000 000 draws,
which leads to a suciently high correlation between exact and MC3posterior
model probablities(about 0.99).
2.1 Parameter priors
Parameter priors have to be specied in order to implement BMA. In general, priors specify researcher's information or beliefs before seeing the actual data.
Since the degree of belief is not particularly high in the growth context, uninfor-mative priors are typically employed.The priors aect the marginal likelihood in (1) and there is a discussion in literature, which parameter priors (as well as model priors, more on this below) are preferable (Eicher et al. (2011) and Ley and Steel (2009)). This is examined by evaluating predictive performance of the model. For example, among 12 candidate parameter priors, Eicher et al. (2011) nd that the Unit Information Prior (UIP) with uniform model prior tend to provide more accurate predictions than the other considered priors. On
the other hand, Feldkircher and Zeugner (2009) prefer hyperg-priors. To deal
with the issue, we carry out the estimations using several parameter priors (as well as model priors) to shed light on the robustness of results.
The rst prior is dened as follows.
pr(D|Mi)≈c−1/2BICi, (3) where BICi=nlog 1−R2i +pilog (n) (4) In (3) and (4), c is a constnant, R2
i stands the coecient of determination
andpifor the number of regressors. This prior is typically labelled as UIP.This
prior is typically labelled as UIP. This prior depends on data and it has been questioned, whether this commonly used prior is valid for Bayesian analysis.
Next, we consider the following prior, so-calledg-prior, proposed by Fernandez
et al. (2001b): pr(α1|Mi)∝1, (5) pr(σ|Mi)∝1, (6) prα(k)|σ, Mi ∼N 0,gkZ(k) 0 Z(k) −1 , (7)
where Z(k) denote the matrix of size n×pk with pk demeaned regressors
included in Mi. It is noteworthy that the values of g close to zero imply less
informative prior and g = 1 gives the same weight to the information
con-tained in data and in prior. Two dierent values of g are examined. First,
g = 1/max N, k2
is the one preferred by Fernandez et al. (2001b) called
BRIC. Second, g = 1/(lnN)3 corresponds to Hannah-Quinn criterion. The
third commonly employedg-prior set g= 1/k2 (Foster and George, 1994), but
this is in our setting identical tog= 1/max N, k2.
Next, we also use parameter priors not employed previously in the growth
literature (except Feldkircher and Zeugner, 2009), the so-called hyper-g prior
(Liang et al, 2008).
π(g) = a
a−2(1 +g)
a/2, (8)
We use two dierent hyper-g priors. The rst one sets the prior expected
value of shrinkage factor to correspond to UIP, the second one sets it to conform to BRIC. All in all, this makes ve dierent parameter priors that we employ for the empirical investigation of long-term economic growth.
2.2 Model priors
Two dierent model priors - uniform and random binomial - are investigated. We start with uniform model prior, which gives equal prior probability to all
modelsMi. In consequence,pr(Mi) =1/Lfor eachi. Next, more general model
prior is employed. pr(Mi) = Π p j=1π δkj j (1−πj) 1−δkj, (9)
where δkj = 1, if Xj is included inMi, and0otherwise and πis treated as
random variable drawn fromBeta 1,1−ππdistribution (Ley and Steel (2009)).
3 Data
We use the data from Fernandez et al. (2001a). The benet of using this dataset is that it has been analyzed by a number of researchers afterwards (Koop (2003),
Koop et al. (2007), Ley and Steel (2009) or Eicher et al. (2011)) and substantial sensitivity analysis is thus available. The original dataset contains 41 regressors from 72 countries leading to a total of 241 models (more than 2 trillion).
The dataset is representative, there are both developed and developing coun-tries and the regressors include various economic, political, geographical, de-mographic social or cultural variables considered to be important by previous literature. The list of countries and regressors is available in the Appendix. The dependent variable, economic growth, is dened as the change in the growth in 1960-1992.
Since ordinary least squares model enters into the BMA, it is important that the regressors are exogenous (e.g. are not correlated with the error term). Some regressors such as geographical variables are clearly exogenous to economic growth, while for others exogeneity is assured by using the data before 1960 or at worst from 1960s-1970s, where applicable. Comprehensive R&D data such as the ratio of expenditures on R&D to GDP is not available for this period and in fact these data are available for a sucient number of countries only from mid-1990s onwards. Therefore, we propose to proxy the R&D intensity with the number of Nobel prizes in science by countries. We use the prizes in 1945-1975 to have sucient time coverage as well as heterogeneity. We believe that our indicator of R&D intensity is exogenous to economic growth in 1960-1992, since the prizes are given with a substantial lag typically of more than two decades after the scientic discovery.
Our R&D indicator, RD, is calculated as follows:
RDj = 4 X i=1 1975 X t=1945 1 n i,t (10)
whereistands for the scientic eld in which the laureate received the prize
(physics, chemistry, medicine and economics) and t represents the year in which
the laureate were honored. nstands for the number of laureates that was given
the prize in particular eld and given year. For example, if three laureates
shared the prize in physics in year t, then 1/n = 1/3. RDj for country j is
obtained by summing up1/nover all the years and elds. It is noteworthy that
the aliation of laureate in the year the prize was given (and not citizenship or
the place of birth) determines to which country the value of1/nis assigned (the
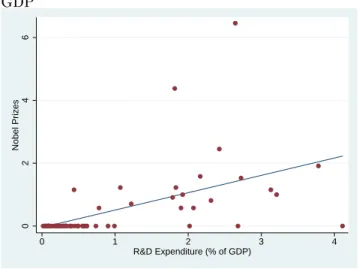
Figure 1: R&D Indicator based on Nobel Prizes and the R&D Expenditures to GDP 0 2 4 6 Nobel Prizes 0 1 2 3 4 R&D Expenditure (% of GDP)
This is so, as we believe that aliation most closely captures which country invests more in its R&D. Alternatively, we calculated the R&D indicator not adjusting for the fact that prizes are often shared, but the regression results remained largely unchanged and are available upon request.
To motivate the use of our R&D indicator based on Nobel prizes, Figure
1 gives the scatter plot of R&D indicator (p
RDj) and the average share of
R&D expenditures to GDP in 1996-2007. Visual inspection suggests that the link between these two variables is clearly positive. Two outliers are evidently present (US and UK) and we re-estimate our model without US and UK to shed light on the extent these outliers are eventually driving the results on the estimated eect of R&D on long-term economic growth.
4 Results
This section present the results of BMA analysis of long-term economic growth and discusses the eect of R&D indicator on growth. First, some baseline esti-mates are provided and substantial sensitivity analysis follows. The results are obtained in a chain of 2 million recorded draws (after 1 million burn-ins) and
1576409 models are visited (e.g. 3.6e-05% of model space)."UIP" hyperg-prior
and random binomial model prior is used as baseline and the results are avail-able in Tavail-able 1. The baseline choice is motivated by the simulations availavail-able
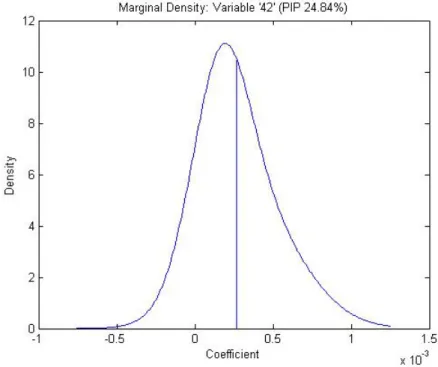
Figure 2: R&D Indicator based on Nobel Prizes and the R&D Expenditures to GDP
in Feldkircher and Zeugner (2009), who show that hyperg-prior is preferable in
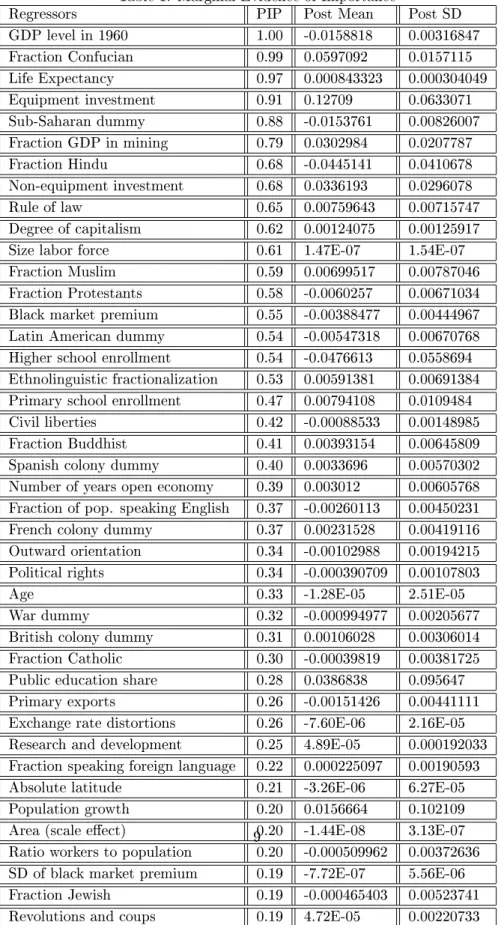
terms of the risk of mispecication and predictive ability. Table 1 contains the posterior inclusion probability (PIP) as well as the posterior mean and standard deviation for each regressor.
Our results are largely in line with Fernandez et al. (2001a) both in terms of the ranking as well as the value of PIPs (with some exemption such as the variable "no. of years open economy" and Spanish colony dummy). The results suggest that the R&D indicator, although with rather lower posterior inclusion probability of 0.25, exerts a positive eect on long-term growth. We hypothesize that the lower PIP can be related to lower variability of our R&D indicator, as only 19 countries out of 72 received Nobel prizes, but comparing all regressors according to the coecient of variation suggest that R&D indicator exhibits more variability than many regressors. Figure 2 shows the posterior density of the coecient on R&D indicator.
Next, we examine the sensitivity of the R&D indicator eect on economic growth on dierent parameters and models prior structures. Combining all prior
Table 1: Marginal Evidence of Importance
Regressors PIP Post Mean Post SD
GDP level in 1960 1.00 -0.0158818 0.00316847 Fraction Confucian 0.99 0.0597092 0.0157115 Life Expectancy 0.97 0.000843323 0.000304049 Equipment investment 0.91 0.12709 0.0633071 Sub-Saharan dummy 0.88 -0.0153761 0.00826007 Fraction GDP in mining 0.79 0.0302984 0.0207787 Fraction Hindu 0.68 -0.0445141 0.0410678 Non-equipment investment 0.68 0.0336193 0.0296078 Rule of law 0.65 0.00759643 0.00715747 Degree of capitalism 0.62 0.00124075 0.00125917
Size labor force 0.61 1.47E-07 1.54E-07
Fraction Muslim 0.59 0.00699517 0.00787046
Fraction Protestants 0.58 -0.0060257 0.00671034
Black market premium 0.55 -0.00388477 0.00444967
Latin American dummy 0.54 -0.00547318 0.00670768
Higher school enrollment 0.54 -0.0476613 0.0558694
Ethnolinguistic fractionalization 0.53 0.00591381 0.00691384
Primary school enrollment 0.47 0.00794108 0.0109484
Civil liberties 0.42 -0.00088533 0.00148985
Fraction Buddhist 0.41 0.00393154 0.00645809
Spanish colony dummy 0.40 0.0033696 0.00570302
Number of years open economy 0.39 0.003012 0.00605768
Fraction of pop. speaking English 0.37 -0.00260113 0.00450231
French colony dummy 0.37 0.00231528 0.00419116
Outward orientation 0.34 -0.00102988 0.00194215
Political rights 0.34 -0.000390709 0.00107803
Age 0.33 -1.28E-05 2.51E-05
War dummy 0.32 -0.000994977 0.00205677
British colony dummy 0.31 0.00106028 0.00306014
Fraction Catholic 0.30 -0.00039819 0.00381725
Public education share 0.28 0.0386838 0.095647
Primary exports 0.26 -0.00151426 0.00441111
Exchange rate distortions 0.26 -7.60E-06 2.16E-05
Research and development 0.25 4.89E-05 0.000192033
Fraction speaking foreign language 0.22 0.000225097 0.00190593
Absolute latitude 0.21 -3.26E-06 6.27E-05
Population growth 0.20 0.0156664 0.102109
Area (scale eect) 0.20 -1.44E-08 3.13E-07
Ratio workers to population 0.20 -0.000509962 0.00372636
SD of black market premium 0.19 -7.72E-07 5.56E-06
Fraction Jewish 0.19 -0.000465403 0.00523741
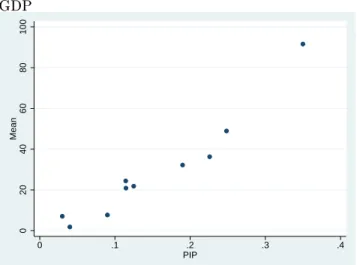
Figure 3: R&D Indicator based on Nobel Prizes and the R&D Expenditures to GDP 0 20 40 60 80 100 Mean 0 .1 .2 .3 .4 PIP
Note: PIP stands for posterior inclusion probability and Mean denotes posterior mean of the R&D indicator eect on economic growth. For convenience, the posterior mean multiplied by 106.
structures gives ten dierent estimates of PIP and posterior mean. The results are given in Figure 3. The results show that irrespective of prior structures the R&D indicator exerts a positive eect on long-term economic growth and PIPs vary from 0.03 to 0.35. Clearly, as has been pointed out above, some prior structures are preferable to the others, so these results should not be overemphasized even though suggest the positive eect of R&D in all cases.
Further sensitivity analysis has been carried out by 1) we excluding the US and UK, which can be classied as outliers according to Figure 1, 2) including only 50 countries with with highest economic growth, 3) adjusting the formula in (10) for the calculation of the R&D indicator, as explained in the data section
and 4) redengRDjas a dummy variable with four categories, with the following
values: 0, for the countries without any Nobel prize (e.g. RDj = 0), 1 for the
countries with RDj < 1, 2 for the countries with RDj > 1 , but except the
US and UK, and 4 for the US and UK. The results indicate that the eect of R&D indicator is positive with the posterior inclusion probability between 0.1 and 0.25 depending on parameter and model prior structures, e.g. largely in line with the analysis above. These results are available upon request.
5 Concluding Remarks
We apply Bayesian model averaging technique to examine the role of research and development for long-term economic growth. We use the dataset of Fer-nandez et al. (2001a) that has been commonly employed to investigate the determinants of long-term growth using Bayesian techniques, but additionally include the indicator assessing the research and development intensity.
Even though, the previous studies examined the eect of dozens of regressors on long-term economic growth, R&D remianed untouched due to data unavail-ability. This is because the data on R&D with satisfactory time and country coverage became available mostly in 1990s, which is rather insucient for cross-country growth regressions. We propose to overcome this issue by constructing the R&D indicator based on the number of Nobel prizes in science. We show that our indicator is correlated with recent data on R&D expenditures.
In terms of results, it is noteworthy that we use several parameter prior and model prior structures to shed light on the robustness of results. Subject to extensive sensitivity analysis, our results show that R&D exerts a positive eect of long-term growth.
References
[0] Barro, R. 1991. Economic Growth in a Cross Section of Countries. Quar-terly Journal of Economics 106(2): 407-443.
[1] Benito, M. 2011. Determinants of Economic Growth: A Bayesian Panel Data Approach. Review of Economics and Statistics, forthcoming.
[2] Barro, R. and X. Sala-i-Martin. 1995. Economic Growth, New York: McGraw-Hill.
[3] Durlauf, S.N., A. Kourtelos and C.-M. Tan. 2008. Are Any Growth Theories Robust?. Economic Journal 118: 329-346.
[4] Eicher, T., Papageorgiou, C. and A. E. Raftery. 2011. Default Priors and Predictive Performance in Bayesian Model Averaging, with Application to Growth Determinants. Journal of Applied Econometrics 26(1): 30-55. [5] Feldkircher, M. and S. Zeugner. 2009. Benchmark Priors Revisited: On
Adaptive Shrinkage and the Supermodel Eect in Bayesian Model Averag-ing. IMF Working Paper 09-202.
[6] Fernandez, C., Ley, E. and M. Steel. 2001a. Model Uncertainty in Cross-Country Growth Regressions. Journal of Applied Econometrics 16(5): 563-576.
[7] Fernandez, C., Ley, E. and M. Steel. 2001b. Benchmark Priors for Bayesian Model Averaging. Journal of Econometrics 16(5): 563-576.
[8] Foster, D.P. and E.I. George. 1984. The Risk Ination Criterion for Multiple Regressions. The Annals of Statistics 22: 1947-1975.
[9] Hasan, I. and C. L. Tucci. 2010. The Innovation-Economic Growth Nexus: Global Evidence. Research Policy 1264-1276.
[10] Koop, G. 2003. Bayesian Econometrics. Wiley, Chicester, UK.
[11] Koop, G., D.J. Poirier and J. Tobias. 2007. Bayesian Econometric Methods. Cambridge University Press.
[12] Ley, E. and M. Steel. 2009. On the Eect of Prior Assumptions in Bayesian Model Averaging with Applications to Growth Regression. Journal of Ap-plied Econometrics 24(4): 651-674.
[13] Liang, F., Rui, P., German, M., Clyde, M., and J. Berger. 2008. Mixtures of g-priors for Bayesian Model Selection. Journal of the American Statistical Association 89: 1535-46.
[14] Madigan, D. and J. York. 1995. Bayesian Graphical Models for Discrete Data. International Statistical Review 63: 1023-1036.
[15] Montgomery, J.M. and B. Nyhan. 2010. Bayesian Model Averaging: The-oretical Developments and Practical Applications. Political Analysis 18: 245-270.
[16] Raftery, A.E., Madigan, D. and J.A. Hoering. 1997. Bayesian Model Av-eraging for Linear Regression Models. Journal of the American Statistical Association. 83: 1023-1036.
[17] Sala-i-Martin, X., Doppelhofer, G. and R. Miller. 2004. Determinants of Long-Term Growth: A Bayesian Averaging of Classical Estimates (BACE) Approach. American Economic Review 94(4): 814-835.
6 Appendix
Fernandez et al. (2001) dataset
The list of countries: Algeria, Argentina, Australia, Austria, Belgium, Bo-livia, Botswana, Brazil, Cameroon, Canada, Chile, Colombia, Congo, Costa Rica, Cyprus, Denmark, Dominican Rep., Ecuador, El Salvador, Ethiopia, Fin-land, France, Germany West, Ghana, Greece, Guatemala, Haiti, Honduras, Hong Kong, India, Ireland, Israel, Italy, Jamaica, Japan, Jordan, Kenya, Ko-rea, Madagascar, Malawi, Malaysia, Mexico, Morocco, Netherlands, Nicaragua, Nigeria, Norway, Pakistan, Panama, Paraguay, Peru, Philippines, Portugal, Senegal, Singapore, Spain, Sri Lanka, Sweden, Switzerland, Taiwan, Tanzania, Thailand, Tunisia, Turkey, Uganda, United Kingdom, United States, Uruguay, Venezuela, Zaire, Zambia, Zimbabwe.
The list of regressors: GDP level in 1960, Fraction Confucian, Life Ex-pectancy, Equipment investment, Sub-Saharan dummy, Fraction GDP in min-ing, Fraction Hindu, Non-equipment investment, Rule of law, Degree of capi-talism, Size labor force, Fraction Muslim, Fraction Protestants, Black market premium, Latin American dummy, Higher school enrollment, Ethnolinguistic fractionalization, Primary school enrollment, Civil liberties, Fraction Buddhist, Spanish colony dummy, Number of years open economy, Fraction of pop. speak-ing English, French colony dummy, Outward orientation, Political rights, Age, War dummy, British colony dummy, Fraction Catholic, Public education share, Primary exports, Exchange rate distortions, Research and development, Frac-tion speaking foreign language, Absolute latitude, PopulaFrac-tion growth, Area, (scale eect), Ratio workers to population, SD of black market premium, Frac-tion Jewish, RevoluFrac-tions and coups
IES Working Paper Series
2011
1.
Roman Horváth, Jakub Mat
ě
j
ů
: How Are Inflation Targets Set?
2.
Jana Procházková, Lenka Š
ť
astná : Efficiency of Hospitals in the Czech Republic
3.
Terezie Výprachtická :
The Golden Rule of Public Finance and the Productivity of Public
Capital
4.
Martina Mysíková :
Income Inequalities within Couples in the Czech Republic and
European Countries
5.
Veronika Holá, Petr Jakubík :
Dopady zm
ě
n parametr
ů
pojišt
ě
ní vklad
ů
v roce 2008
6.
Vladimír Bená
č
ek, Eva Michalíková :
The Factors of Growth of Small Family Businesses:
A Robust Estimation of the Behavioral Consistency in the Panel Data Models
7.
Aleš Maršál :
The Term Structure of Interest Rates in Small Open Economy DSGE Model
8.
Robert Flasza, Milan Rippel, Jan Šolc :
Modelling Long-Term Electricity Contracts at EEX
9.
Jan Hlavá
č
:
Financial performance of the Czech private pension scheme: Its current
position and the comparison with other CEE countries
10.
Tomáš Havránek, Zuzana Iršová, Karel Janda :
Demand for Gasoline Is More
Price-Inelastic than Commonly Thought
11.
Martina Mysíková :
Personal Earnings Inequality in the Czech Republic
12.
Ond
ř
ej Lopušník :
Reflections on the reconciliation problem
13.
Martin Gregor, Lenka Š
ť
astná :
The Decentralization Tradeoff for Complementary
Spillovers
14.
Lenka Š
ť
astná, Martin Gregor :
Local Government Efficiency: Evidence from the Czech
Municipalities
15.
Andrea Klimešová, Tomáš Václavík :
Pricing of Gas Swing Options using Monte Carlo
Methods
16.
António Afonso, Jaromír Baxa, Michal Slavík :
Fiscal developments and financial stress: a
threshold VAR analysis
17.
Karel Bá
ť
a :
Equity Home Bias Among Czech Investors: Experimental Approach
18.
Karel Janda :
Credit Guarantees and Subsidies when Lender has a Market Power
19.
Roman Horváth :
Research & Development and Long-Term Economic Growth: A
Bayesian Model Averaging Analysis
All papers can be downloaded at:
http://ies.fsv.cuni.cz
Univerzita Karlova v Praze, Fakulta sociálních věd
Institut ekonomických studií [UK FSV – IES] Praha 1, Opletalova 26