Episodes in Parkinson’s Disease
Based on Accelerometers
Juli`a Camps1(B), Albert Sam`a1, Mario Mart´ın2, Daniel Rodr´ıguez-Mart´ın1, Carlos P´erez-L´opez1, Sheila Alcaine3, Berta Mestre3, Anna Prats3, M. Cruz Crespo3, Joan Cabestany1, `Angels Bay´es3, and Andreu Catal`a1
1 Technical Research Centre for Dependency Care and Autonomous Living,
CETPD, Universitat Polit`ecnica de Catalunya, Barcelona Tech., Rambla de l’Exposici´o 59-69, 08800 Vilanova i la Geltr´u, Spain
2 Knowledge Engineering and Machine Learning Group,
Universitat Polit`ecnica de Catalunya, Barcelona Tech., C/ Jordi Girona 1-3, 08034 Barcelona, Spain
3 Unidad de Parkinson y trastornos del movimiento (UParkinson), Barcelona, Spain
Abstract. Freezing of gait (FOG) is one of the most incapacitating symptoms among the motor alterations of Parkinson’s disease (PD). Manifesting FOG episodes reduce patients’ quality of life and their autonomy to perform daily living activities, while it may provoke falls. Accurate ambulatory FOG assessment would enable non-pharmacologic support based on cues and would provide relevant information to neu-rologists on the disease evolution.
This paper presents a method for FOG detection based on deep learn-ing and signal processlearn-ing techniques. This is, to the best of our knowl-edge, the first time that FOG detection is addressed with deep learning. The evaluation of the model has been done based on the data from 15 PD patients who manifested FOG. An inertial measurement unit placed at the left side of the waist recorded tri-axial accelerometer, gyroscope and magnetometer signals. Our approach achieved comparable results to the state-of-the-art, reaching validation performances of 88.6% and 78% for sensitivity and specificity respectively.
Keywords: Freezing of gait
·
Parkinson’s disease·
Deep learning·
Signal processing·
Inertial measurement unit1
Introduction
Parkinson’s disease (PD), with a prevalence of approximately 1% among peo-ple of age above 65, is the second most common neurodegenerative disorder [15,16,23,26]. PD patients manifest several motor and non-motor symptoms. Accurate automatic symptoms detection in PD patients’ provides relevant indi-cators about their condition [4]. Clinicians by disposing of these indicators can
To appear in Lecture Notes in Computer Science (including subseries Lecture Notes in Artificial Intelligence and Lecture Notes in Bioinformatics) 10306 LNCS
maintain an updated assessment over the patient’s regimen, which permits to improve the patient’s quality of life.
Freezing of gait (FOG) is a symptom associated with PD condition. FOG is usually manifested in episodes shorter than 10 s [20]. Suffering FOG episodes may provoke falling accidents when patients are willing to perform walking related actions [3]. According to Nieuwboer and Giladi [14], FOG might be defined as an inability to deal with concurrent cognitive, limbic, and motor inputs, causing an interruption of locomotion. Many medical research studies have been carried out to discover strategies to combat this symptom. These studies have proved that techniques such as to induce an auditory or visual external a rhythm stimulus to PD patients to improve their walking capacity while minimising FOG’s incisive frequency [2]. Automatic FOG monitoring would permit to provide online support to patients through rhythmic auditory cues, which may significantly enhance the patients’ autonomy during their activities of daily living (ADL) [2,28].
Recently, with the increase of computing power of small devices and the adop-tion of wearable sensors for biomedical research, wearable sensors are increas-ingly becoming a common practice for detecting motor symptoms in PD patients within the research community. The state-of-the-art on algorithms for automatic FOG detection is shallow machine learning (ML) algorithms applied to signals acquired from inertial wearable sensors [12,13,18]. The state-of-the-art perfor-mance for FOG detection is defined by perforperfor-mances within the range [85%,95%] for the geometric mean (GM) between sensitivity and specificity. However, the complexity in designing handcrafted features and the scarcity of data from PD patients collected under real-life-like conditions for developing reliable solutions for monitoring FOG in naturalistic environments, are the major impediments preventing the research community from mastering the problem.
Feature learning is a set of techniques that learns a transformation of raw data input to a representation that can be exploited by ML methods. Deep learning (DL) methods are feature learning methods with multiple levels of rep-resentation. DL models can learn feature extractions that can easily handle mul-timodal data, missing information and high dimensional feature spaces. Thus, when working with DL methods, the manual feature engineering can be obvi-ated, which is otherwise necessary for traditional ML methods. Furthermore, DL models can outperform shallow ML algorithms when enough data to represent the complexity of a target problem are provided adequately.
To the best of our knowledge, this is the first paper to present a DL model for addressing FOG detection in PD patients from inertial sensors data. Our approach implements an 8-layer convolutional neural network (ConvNet), which is composed of: 5 convolutional layers, 2 dense (i.e. fully-connected) layers and an output layer. In the experiments performed, this model achieved compara-ble performances to the state-of-the-art. Concretely, the presented models were able to achieve performances of 88.6% and 78% for sensitivity and specificity respectively. The main contribution of this study is to serve as a basis from which designing DL models capable of mastering FOG detection from inertial data collected in naturalistic environments.
2
Related Work
Automatic FOG detection is an open research issue which has been widely addressed by several combinations of devices and algorithms. This section reviews some of these approaches.
In 2008, Moore et al. [13] presented the Moore-B¨achlin FOG Algorithm (MBFA), a novel method for automatic FOG detection in PD patients that manifest FOG. The MBFA mainly consists of a freeze index (FI) threshold, where FI is defined as the ratio between the power spectral density in the gait freezing band (i.e. 3–8 Hz) and in the locomotion band (i.e. 0.5–3 Hz). This app-roach was able to achieve highly accurate results, considering the simplicity of the method. Concretely, they were able to detect 78% of FOG events correctly. These results were retrieved by a general threshold across all patients data. How-ever, they also proved that calibrating the threshold to each patient increased the method’s performance about an 11%.
In 2012, Mazilu et al. [12] presented a novel approach for monitoring FOG in PD patients, which combines the usage of smartphones and wearable accelerome-ters as devices, while using, for the first time, ML algorithms for the online FOG detection task. Some of the ML algorithms they tested were: random forests (RF), decision trees (C4.5), naive Bayes (NB) and k-nearest neighbours (k-NN). They reported top results of 66.25% and 95.38% for sensitivity and specificity, respectively, using user-independent settings.
In 2016, Rodr´ıguez et al. [18] presented a study aiming at FOG detection in PD patients during their ADL, and adopting the support vector machines (SVMs) for the FOG bi-classification task. They proposed an innovative feature extraction which is designed to be implementable in low-power consumption wearables for online FOG detection. The data, which was composed of iner-tial signal recordings at 40 Hz from a single ineriner-tial measurement unit (IMU) placed at the left side of the waist, was acquired following the same conven-tions reviewed in [13]. However, laboratory data acquisition biases the data with information related to the experiment characteristics as in [12,13]. Thus, they collected the data at the patients’ homes, configuring each test to adapt to the real activities in which the patient would experience FOG, rather than employing homogeneous lab settings to force patients to trigger FOG events. Although they have not reported test error results in this work, they performed a comparative study of the state-of-the-art feature extraction techniques for FOG detection, while reporting cross-validation error when training a model for each combina-tion of ML algorithm (e.g. k-NN, RF, NB and SVM) and feature extraccombina-tion strategy. Furthermore, they considered different window sizes (i.e. ranging from 0.8 to 6.4 s) to maximise the representation power of each configuration. Their results suggested that SVMs with their proposed feature generation are power-ful strategies for FOG detection since the cross-validation performance for this configurations were the most accurate among all regardless of the window size. Concretely, highest results were achieved by using a window duration of 1.6 s, for which they reported 89.77% as the GM between sensitivity and specificity.
Recently, in 2017, Rodr´ıguez et al. [19] presented an extension of [18] and [17]. In this study, they showed performance results for the GM between sensi-tivity and specificity of 76%, which was determined by using an episode-based evaluation strategy, instead of the window-based strategy.
3
Deep Learning for FOG Detection
3.1 Feature Extraction with ConvNets
A ConvNet is a type of feed-forward deep neural network, which typically com-bines convolutional layers with traditional dense layers to reduce the number of weights composing the model. Convolutional layers enforce local connectivity between neurones of adjacent layers to exploit spatially local correlation. Con-cretely, convolutional layers are formed by kernels that share weights and, thus, permit to learn position invariant features from the input data.
Therefore, convolutional layers can extract features from data that have underlying spatial or temporal patterns, such as images or signal data. Fur-thermore, stacking these layers permits to extract progressively more abstract patterns.
While traditional DL models are composed of stacked dense layers, which lead to an overwhelming number of weights, ConvNets implement a powerful and efficient alternative if the target data present underlying spatial patterns.
3.2 Architecture
The presented approach is a one-dimensional ConvNet, which is described as C(16|3)−C(16|3)−C(16|3)−C(16|3)−C(16|3)−D(32)−D(32)−L whereC(x|y) corresponds to a convolutional layer ofxkernels of lengthy,D(z) corresponds to a dense layer ofzneurons, andLis the last layer of the network. FOG events detection was treated as a bi-classification task, such that FOG instances were labelled as positive values (i.e. 1) whereas non-FOG instances were labelled as negative values (i.e. −1). The models, thus, should be able to retrieve negative and positive values. A linear function with L2 weight regular-isation penalty coefficient set to 0.01 was, thus, implemented as the activation function of the last layer, which was set to a dense layer of 1 neurone.
3.3 Data Representation and Augmentation
A common practice to enhance ML models’ training quality is to normalise the data. Data were, thus, normalised by the precomputed sample standard deviation from the overall training dataset.
The most common technique to deal with classification tasks in time-series data is to use a windowing strategy. Windowing consists of splitting the data
into equally-sized consecutive parts to address the classification task window-wisely instead of instance-window-wisely. The classification task was, therefore, addressed window-wisely.
Data augmentation techniques permit to increase the knowledge extracted from data by performing replications on the data that are consistent with the task’s domain. Data augmentation strategies implemented were:
– To randomly shift the window starting points.
– To rotate each windowed signal by simulating a rotation on the waist-sensor through a rotation matrix generated by sampling angles (see Fig.1for the axis reference) over a distribution defined by the following ranges: x-axis: [−30◦, +30◦]; y-axis: [−45◦, +45◦]; and z-axis: [−10◦, 10◦]; which were designed to resemble naturally introduced rotations due to the patient’s waist form and movements.
DL models are powerful feature extractors, however, if being provided with insufficient information, these models would fail to solve the classification task. Rodr´ıguez et al. [19] performs a feature extraction which is computed from the current and previous windows. This window transitional information usage sug-gested that data from one single window could be insufficient to succeed in the FOG detection task. To provide the DL models with a sample representation from which they could learn which part of sample data belonged to the cur-rent window and which to the transition between windows, a novel strategy was implemented which is hereinafter referred as stacking. The stacking strat-egy can be seen as a function which outputs the window to fed to the model from the current and the previous window data plus a value for the stacking parameter p; thus, Sn = stacking(Wn, Wn−1, p) where: Sn refers to the nth stacked window used for feeding the model;Wn andWn−1 refer to the current and previous windowed data, respectively; andpis a trade-off parameter of the stacking(Wn, Wn−1, p) function, which is hereafter defined:
1. The previous and the current windows are split intopequally-sized parts. 2. Each ith part of the current window is paired with the (i-1)th part, even if
this one belongs to previous or to the same window, in which case that part is replicated. The parts from the previous window which were not paired are removed.
3. Each remaining part is transformed by applying the fast Fourier transform (FFT).
4. Each part of the current window is complemented by its predecessor part by just concatenating the columns of the current part to the difference between both parts, which produces a new extended part composed of 18 columns (i.e. 9 of the current window + 9 of the predecessor part of this concrete part). 5. Finally all parts are re-stacked together maintaining the initial temporal
4
Experiments
4.1 Data Collection
The dataset [18] employed is composed of inertial signals from 15 PD patients recorded by a single IMU placed at the left side of the patient’s waist, as shown in Fig.1. This IMU generated 9 signals sampled at 200 Hz as output. The 9 signals represented the measurements of 3 tri-axial sensors: gyroscope, accelerometer and magnetometer.
Fig. 1.The data collector device and its location on body [18].
The data collection was performed within the scope of the Freezing in Parkin-son’s Disease: Improving Quality of Life with an Automatic Control System (MASPARK)1 project. Inclusion criteria were: (I) being diagnosed with PD
according to the UK Brain Bank; (II) having Hoehn & Yahr stage above 2 in OFF state; (III) not having dementia according to DSM-IV criteria; (IV) and giving their written informed consent for using the collected data in the research carried out. All data was, furthermore, gathered at the patients’ homes to increase the resemblance of targeting the same problems in real-life environ-ments. The patients performed a set of activities such as showing their place and carrying an object from one room to another. These activities were afterwards labelled by clinicians relying only on the video recording. The data collection protocol included some activities which were specially introduced to increase the difficulty of the FOG detection task. Concretely, adding data from activi-ties such as brushing their teeth, painting and erasing in a sheet of paper, was endeavoured to force models to learn robust representations of FOG.
4.2 Training and Tested Configurations
A complete exhaustive search of the hyperparameter space was infeasible due to computational and time constraints. The hyperparameters exploration was
undertaken following an iterative semi-heuristic strategy formed by several stages, in each of which some hyperparameters were set to the optimal con-figurations tested; thus reducing significantly the combinations of concon-figurations to consider. Note that the adoption of this strategy implies that the presented approaches constitute only local minima over the overall hyperparameters space considered.
The model’s hyperparameters are hereafter described while discussing the ranges of values contemplated and the suboptimal configurations selected for each of them.
Architecture. The values considered for the architecture exploration were:
– Number of convolutional layers: all integer values within the range [2,10]. – Number of dense layers: 1, 2 and 3.
– Number of kernels per convolutional layer: 8, 16, 32, 64, 128, 256 and 512. – Number of neurons per dense layer: 16, 32, 64, 128, 256, 512 and 1024. – Kernel lengths: 3 and 5.
The architecture configuration of the best validation models trained were defined as: 4 and 5 convolutional layers, 2 dense layers, 16 kernels per convolutional layer, 32 neurons per dense layer and kernels of length 3.
Data Augmentation. Data augmentation parameters that determine the number
of shifts and rotations to be performed were set to: – Number of shifts = 4 (data is always shifted).
– Number of added rotations = 1 (original data was included).
From the augmentation process, the amount of training data was, thus, 8 times higher.
Stacking Parameter p. Values considered for the pstacking parameter were: 1,
2, 3, 4 and 8. Finally,pwas set to values 1, 2 and 3.
Sampling Frequency and Window Duration. Rodr´ıguez et al. [18] performed
successfully FOG detection on a subset of the same dataset here considered by adopting a subsampling frequency of 40 Hz and window duration of 3.2 s This previous study suggested, thus, that that windows of at least 3.2 s and a sampling frequency at least of 40 Hz were sufficient values to address the detection task. Therefore, the values tested were:
– Sampling frequency (Hz): 40, 50, 100 and 200. – Window duration (s): 2.56, 3, 3.2, 5.12 and 10.24.
Finally, these hyperparameters were set to 100 Hz and 2.56 s for sampling fre-quency and window duration respectively.
Batch Size. DL models are trained batch-wisely instead of sample-wisely, being each sample composed by a windowed group of instances already processed (i.e. normalised and stacked). A batch is a fraction of the overall processed training data to be fed into the DL model, which is generated from splitting these data into equally sized parts. Then, DL models compute the gradients and perform the weight corrections batch-wisely; thus, applying fewer corrections during the training process.
According to Goodfellow et al. [7], generalisation error is often best for a batch size of 1. However, this strategy is time-consuming. Batch sizes tested, thus, were: 1, 8, 16, 32, 64 and 128. From these values, 16 was selected.
Number of Epochs. DL models are trained iteratively with the aim of
approach-ing relevant local optima on the neurones’ weights space to successfully represent the target problem. These iterations are denoted as epochs. Correctly estab-lishing the number of epochs is important to avoid useless computation when the model has converged while preventing overfitting. The number of epochs by which a model may reach convergence will usually be correlated to several other characteristics, such as the model’s architecture, the data, the optimisation method and its internal parameters (e.g. learning rate), and the regularisation strategies being employed. The hyperparameters process performed kept the models’ architectures and the dropout indexes as variable throughout the over-all study. An early-stopping strategy was, thus, implemented instead of fixing the number of epochs.
Activations. The most widely exploited activation function for DL methods is
the rectified linear unit (ReLU) [11,22]. Besides, training DL models with ReLU activations increases the training time efficiency significantly, which is a major bottleneck when working with DL techniques. Therefore, all activations, except for the activation function of the last layer, are set to ReLU functions.
Error Loss. FOG detection is addressed as a binary classification tasks. Hinge
loss algorithm is a loss error method specialised for bi-classification problems, which is defined as:
Lhinge=mean(max(0,1−ytrue∗ypred)) (1) where ytrue are the real labels of the data, which can either be−1 or 1, while ypred are the model label predictions which can adopt real values in the range [−∞,+∞].
However, it was noted that the class imbalance in the training data was preventing the model from learning strong FOG representations. Therefore, the weighted version of the hinge loss function, which is hereafter defined, was imple-mented in the final models.
L+
w−hinge =max(0,1−y+true∗ypred)∗Pno−F OG L−w−hinge =max(0,1−y−true∗ypred)∗PF OG Lw−hinge =mean(Lw+−hinge+L−w−hinge)
wherey+truedefines the real positive samples in the data whiley−true defines the negative ones,PF OG is the prior of FOG samples in the training data (i.e. the percentage of fog samples in the training dataset) andPno−F OG is the prior of non-FOG samples in the training data.
Optimizer. In DL models the loss optimisation responsibility is delegated to a
stochastic gradient-based algorithm. The algorithms considered were: root mean square propagation (RMSProp) [24]; AdaDelta [29], which is an extension of adaptive gradient algorithm (AdaGrad) [5]; and adaptive momentum (Adam) [9]. However, no significant difference was found from the initial results between the tested algorithms. Finally, it was decided to select Adam, due to taking into account the momentum which adds robustness to the gradients and lowers the effect of outlier batches on the weight updates [9]. Moreover, Adam is the most widely implemented of all algorithms considered [1,8,10,25,27]. Therefore, the models presented were trained via backpropagation and Adam algorithm as the optimisation method.
Learning Rate. In DL models, the learning rate is a parameter of the optimizer
algorithm which indicates the size of the step to be applied when correcting the model’s weights by the newly computed gradient. Finally, the tested values for the learning rate were within the range [5·10−3,5·10−5].
Weight Initialization. Although being a crucial hyperparameter for successfully
training DL models, it has been stated that several initializations will usually allow a DL model to train in a proper way [7]. The weight initialization strat-egy was, thus, set to the method presented by Glorot et al. [6], which, indeed, permitted to train our models successfully.
Regularization. Models trained initially were prone to overfit on the training
data; thus, dropout strategies were implemented after every layer of the models’ [21]. Dropout indexes considered were: 0, 0.1, 0.15, 0.2, 0.25 and 0.5.
5
Results
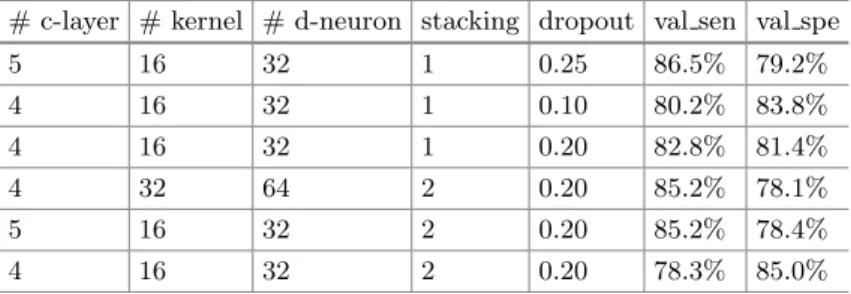
Table1 presents the models’ designs that achieved the highest validation GM values between sensitivity and specificity. From the top configuration results, it was observed that only models trained with windows of 2.56 s achieved validation GM above 80%.
From Table1 it can be observed that the best models’ configurations pre-sented are defined by 4 and 5 convolutional layers, each of which was composed of 16 kernels of length 3; 2 dense layers of 32 neurons; a dropout measure within the range [0.1,0.25]; stacking p parameter equals 1 and 2; and the remaining common characteristics for all trained models which are commented in Sect.4.2. The performance of ML algorithms is usually compared using benchmarking datasets. Rodr´ıguez et al. [18] replicate other authors’ feature extraction strategies
Table 1.Top validation models. Columns naming description: ‘# c-layers’→number of convolutional layers; ‘# kernels’ → number of kernels per layer; ‘# d-neuron’ → number of neurons of each dense layer; ‘stacking’→ number of parts that each win-dow was split before re-stacking (pstacking parameter); ‘dropout’→dropout index; ‘val sen’ and ‘val spe’→validation values of sensitivity and specificity.
# c-layer # kernel # d-neuron stacking dropout val sen val spe
5 16 32 1 0.25 86.5% 79.2% 4 16 32 1 0.10 80.2% 83.8% 4 16 32 1 0.20 82.8% 81.4% 4 32 64 2 0.20 85.2% 78.1% 5 16 32 2 0.20 85.2% 78.4% 4 16 32 2 0.20 78.3% 85.0%
to compare a novel SVM-based method on 6 patients’ data to the state-of-the-art for FOG detection. These data matches to a subset of the data considered here. Thus, our approach was compared to results reported by Rodr´ıguez et al. [18]. Hence the results table in Rodr´ıguez et al. [18] was adapted to include our app-roach, producing Table2. However, Rodr´ıguez et al. [18] perform a 10-fold cross-validation over 6 patients’ data, while our results from Table1were produced from 4 validation patients which were never used for training the models. Note that this disadvantage advocates our approach.
Table 2.State-of-the-art for FOG detection evaluated on a subset of 6 patients’ accord-ing to [18]. Values illustrated correspond to the best validation GM result reported in [18] for that ML algorithm, while in column ‘DL’ shows the top validation GM achieved.
k-NN RF NB SVM DL Rodriguez et al. [18] 83.71 84.36 79.99 89.77 -Mazilu et al. [18] 81.85 82.9 82.08 84.24 -Tripoliti et al. [18] 75.04 62.25 79.15 79.57 -Moore et al. [18] 71.07 70.46 71.39 78.43 -FFT + stacking - - - - 82.1
Table2 indicates that our approach exhibited comparable validation perfor-mance to the state-of-the-art results replicated by Rodr´ıguez et al. [18] on data from the same distribution. However, some of the methods to which our approach was compared to, were specially designed for being implementable in real-time. These other methods are intended to be implementable in low-power consump-tion devices, while our approach requires significant memory and computaconsump-tional resources.
6
Conclusion
This paper is, to the best of our knowledge, the first study to present a method for FOG detection based on DL models. However, our approach was just a first attempt to tackle the FOG detection problem by employing DL techniques which achieved comparable results to the state-of-the-art methods referred from [18].
Interesting extensions of our approach are:
– To replace the last dense layers of the model by recurrent neural networks (RNNs) or long short term memory (LSTM) layers to enhance the current representation of temporal data.
– To implement personalization strategies, such as to retrain the model with partial information on each patient before evaluating on it. These techniques discern from the common practices adopted in the DL literature. However, they are usually considered by clinicians, who prioritise robustness of models over scalability.
Finally, our results suggest that exploring time-series endeavoured DL tech-niques (e.g. RNNs and LSTMs) could lead to outperforming the state-of-the-art for automatic FOG detection.
Acknowledgements. Part of this project was performed within the framework of the MASPARK project which is funded by La Fundaci´o La Marat´o de TV3 20140431. The authors, thus, would like to acknowledge the contributions of their colleagues from MASPARK.
References
1. Ankit, K., et al.: Ask me anything: dynamic memory networks for natural language processing. CoRR abs/1506.07285 (2015)
2. Arias, P., et al.: Effect of rhythmic auditory stimulation on gait in parkinsonian patients with and without freezing of gait. PloS One5(3), e9675 (2010)
3. Bloem, B.R., et al.: Falls and freezing of gait in Parkinson’s disease: a review of two interconnected, episodic phenomena. Mov. Disord.19(8), 871–884 (2004) 4. Del Din, S., et al.: Free-living monitoring of Parkinson’s disease: lessons from the
field. Mov. Disord.31(9), 1293–1313 (2016)
5. Duchi, J., Hazan, E., Singer, Y.: Adaptive subgradient methods for online learning and stochastic optimization. J. Mach. Learn. Res.12(Jul), 2121–2159 (2011) 6. Glorot, X., Bengio, Y.: Understanding the difficulty of training deep feedforward
neural networks. In: Aistats, vol. 9, pp. 249–256 (2010)
7. Goodfellow, I., Bengio, Y., Courville, A.: Deep Learning. MIT Press, Cambridge (2016)
8. Gregor, K., et al.: Draw: a recurrent neural network for image generation. arXiv preprintarXiv:1502.04623(2015)
9. Kingma, D.P., Ba, J.: Adam: a method for stochastic optimization. CoRR abs/1412.6980 (2014)
10. Kiros, R., et al.: Skip-thought vectors. In: 28th Advances in Neural Information Processing Systems, pp. 3294–3302 (2015)
11. Krizhevsky, A., et al.: Imagenet classification with deep convolutional neural net-works. In: Advances in Neural Information Processing Systems, pp. 1097–1105 (2012)
12. Mazilu, S., et al.: Online detection of freezing of gait with smartphones and machine learning techniques. In: 2012 6th International PervasiveHealth and Workshops, pp. 123–130 (2012)
13. Moore, S.T., MacDougall, H.G., Ondo, W.G.: Ambulatory monitoring of freezing of gait in Parkinson’s disease. J. Neurosci. Meth.167(2), 340–348 (2008)
14. Nieuwboer, A., Giladi, N.: Characterizing freezing of gait in Parkinson’s disease: models of an episodic phenomenon. Mov. Disord.28(11), 1509–1519 (2013) 15. Nussbaum, R.L., Ellis, C.E.: Alzheimer’s disease and Parkinson’s disease. New
Engl. J. Med.348(14), 1356–1364 (2003). pMID: 12672864
16. Pringsheim, T., et al.: The prevalence of Parkinson’s disease: a systematic review and meta-analysis. Mov. Disord.29, 1583–1590 (2014)
17. Rodr´ıguez-Mart´ın, D., Sam`a, A., et al.: Posture detection based on a waist-worn accelerometer: an application to improve freezing of gait detection in Parkinson’s disease patients. Recent Adv. Ambient Assist. Living-Bridging Assistive Technol. E-Health Personalized Health Care20, 3 (2015)
18. Rodr´ıguez-Mart´ın, D., Sam`a, A., et al.: Comparison of features, window sizes and classifiers in detecting freezing of gait in patients with parkinson’s disease through a waist-worn accelerometer. In: Frontiers in Artificial Intelligence and Applications, vol. 288 (2016)
19. Rodr´ıguez-Mart´ın, D., Sam`a, A., P´erez-L´opez, C., Catal`a, A., Arostegui, J.M.M., Cabestany, J., Bay´es, `A., Alcaine, S., Mestre, B., Prats, A., et al.: Home detection of freezing of gait using support vector machines through a single waist-worn triaxial accelerometer. PLoS One12(2), e0171764 (2017)
20. Schaafsma, J.D., et al.: Characterization of freezing of gait subtypes and the response of each to levodopa in Parkinson’s disease. Eur. J. Neurol.10(4), 391–398 (2003)
21. Srivastava, N., et al.: Dropout: a simple way to prevent neural networks from overfitting. J. Mach. Learn. Res.15(1), 1929–1958 (2014)
22. Szegedy, C., et al.: Going deeper with convolutions. In: CVPR (2015)
23. Tanner, C.M., Goldman, S.M.: Epidemiology of Parkinson’s disease. Neurol. Clin.
14(2), 317–335 (1996)
24. Tieleman, T., et al.: Lecture 6.5-rmsprop: divide the gradient by a running average of its recent magnitude. COURSERA: Neural Netw. Mach. Learn. 4 (2012) 25. Venugopalan, S., et al.: Sequence to sequence - video to text. In: The ICCV (2015) 26. WHO: Neurological disorders: public health challenges (2006)
27. Xu, K., et al.: Show, attend and tell: neural image caption generation with visual attention2(3), 5 (2015) arXiv preprintarXiv:1502.03044
28. Young, W.R., Shreve, L., Quinn, E.J., Craig, C., Bronte-Stewart, H.: Auditory cueing in Parkinson’s patients with freezing of gait. What matters most: action-relevance or cue-continuity? Neuropsychologia87, 54–62 (2016)
![Fig. 1. The data collector device and its location on body [18].](https://thumb-us.123doks.com/thumbv2/123dok_us/9512017.2826975/6.659.85.597.269.438/fig-data-collector-device-location-body.webp)