Statistical Analysis of Online Response Data of a Stadium Structure
Prasenjit Mohanty, Paul Reynolds and Aleksandar Pavic
The University of SheffieldDepartment of Civil and Structural Engineering Sir Frederick Mappin Building Mappin Street, Sheffield, S1 3JD, UK
ABSTRACT
Crowd behavior plays an important role in the dynamic excitation of a stadium structure. Reliability in the designing the dynamic performance of a sport stadium depends on its accurate dynamic characterization, i.e. natural frequencies, mode shapes and damping of the associated modes in the presence of a crowd. A Remote Monitoring System (RMS) provides a convenient way of testing the stadium structures. With an RMS system, monitoring can be carried out in the presence of a crowd, for a long duration without direct involvement of the test engineers. In this paper, test data are analysed that were acquired for the Bradford stadium with the help of an RMS system, developed at the University of Sheffield. Seven different types of ambient modal parameter identification methods have been used to analyze RMS data acquired during a football match. Six different sets of data have been chosen from the whole football match, which have been processed with the various identification methods. It has been shown in this work that crowd structure interaction has a significant effect on the natural frequencies and corresponding damping ratios of the structure. It is observed that natural frequencies of the system decreases and corresponding damping values increases with the crowd configurations which agree with the past research.
1 INTRODUCTION
Crowd-induced vibration is a major source of concern when considering stadia structures. The actual behavior is very much dependent on the nature of crowd-structure interaction, which is not well understood in practice. The nature of crowd-structure interaction in a stadium structure does not remain the same during a match. Crowds behave differently and thereby interact differently with a stadium structure as a match proceeds. The dynamic properties of the crowd-structure system therefore change throughout a match.
Accurate determination of the dynamic performance of a stadium structure depends on the accuracy of its dynamic characterization, i.e. natural frequencies, mode shapes and damping of the associated modes. Experimental Modal Analysis (EMA) of a structure provides an ideal way to compute modal properties of the existing empty structures. In the EMA procedure, an artificial force is applied that is large enough to produce measurable response at the measuring points, but yet small enough to allow the structure to be considered as a linear system. Both the input force to the structure and the response of the structure at different locations are measured accurately. Modal parameter identification methods are then usually applied to the test data to determine the modal parameters. In the presence of crowd, testing the stadium structure by EMA procedure is not feasible as response of the structure due to the unknown crowd excitations difficult to separated from the response due to the artificial excitation.
Ambient vibration testing is used as an alternative testing procedure to perform modal parameter identification of the occupied stadia structures. In ambient vibration testing, the input excitation force is not measured. For occupied structure the crowd dynamic excitation is a source of unmeasured excitation. An assumption may be made that it has a broad spectrum, which can be considered as ambient excitation. Some advantages of ambient vibration testing are:
• testing is cheap since no excitation equipment is needed,
• the measurements are done in the actual operational conditions for the structure, so the identified modal parameters represents the dynamic behavior of the structure such as used in reality, and
• the monitoring does not interfere with the operation of the structure.
The RMS system provides an ideal solution to monitor the structure in its operating condition, where long duration measurements are required. A unique RMS system has been developed by the vibration engineering research section at the
University of Sheffield [12]. The RMS system was used for more than a year to acquire response data for a grandstand in Bradford, UK. In this paper, modal parameters of the stadium have been estimated from data acquired during a typical football match. To improve confidence in the identified modal parameters, seven different identification methods have been used. Six different sets of response data have been chosen from the duration of the match representing various crowd configurations. Prior to long term monitoring, a single-shaker EMA testing had been performed on the stadium structure to identify the modal parameters. In this paper, natural frequencies and associated damping from the RMS data have been computed by seven different identification methods with six different sets of data. Finally changes in the modal parameters with respect to crowd configurations have been compared.
2 DESCRIPTION OF THE GRANDSTAND AND RMS SYSTEM
The grandstand was built in the early1990’s. The stadium structure consists of15steel frames spaced at7.19m intervals giving a total length of100m in length. The seating deck is formed from precast concrete L-shaped seating deck units that span between the steel frames.
Figure 1: Different views of the grandstand: (a) side view of the grandstand, (b) cross-section of the grandstand geometry and (c) front view of the grandstand
The RMS system consists of 12 Endevco model 7754-1000 piezoelectric low frequency accelerometers combined with two Microstar Labs iDSC1816, 8-channels 16-bit data acquisition cards. On the top of this, a National Instruments IMAQ PCI-1408 image acquisition card was used for video data acquisition for crowd behavior. The system was controlled with National Instruments LabVIEW software. Communication with the RMS was performed using the PCAnywhere software via a permanent ADSL broadband internet connection. Fig. 1 shows the different views of the grandstand and Fig. 2 shows the
position of the CCTV cameras and accelerometers.
Figure 2: Plan of the grandstand showing location of the CCTV video cameras
3 AMBIENT MODAL ESTIMATION TECHNIQUES
Different parameter estimation techniques can vary in terms of the modal properties they identify in the presence of noise. It is beneficial to identify the modal parameters using different methods, which improves confidence in the results. For this same reason seven different modal parameter estimation methods have been used in this paper. The seven identification methods can be classified into three different categories, as follows:
• method based on Singular Values Decomposition (SVD) of frequency data. 1. Enhanced Frequency Domain Decomposition (EFDD) [6]
• methods based Stochastic Subspace Identification (SSI) 2 Unweighted Principal Component (UPC) [13] 3 Principal Component (PC) [13]
4 Canonical Variate Analysis (CVA) [13]
• methods based on Natural Excitation Technique (NExT) 5 Least Square Complex Exponential method (LSCE) 6 Eigensystem Realization Algorithm (ERA)
7 Single Station Time Domain algorithm (SSTD)
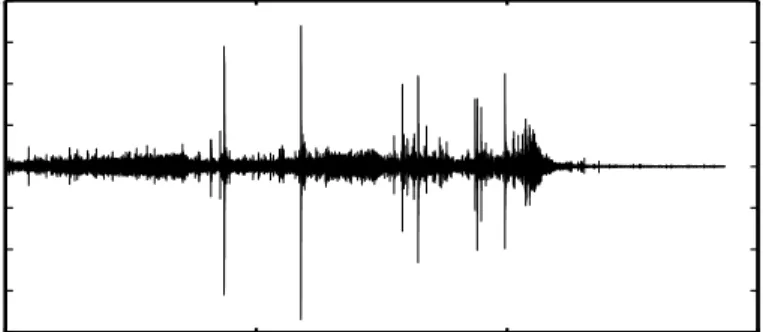
From the RMS data six different data blocks have been chosen according to the crowd configuration. It is intended to estimate the modal parameters for different crowd excitation level. In the Fig. 3 a typical time history has been provided for the response of first accelerometer and in Table 1 data blocks spreading have been provided for different events during the match.
3.1 Brief Description of the Estimation Methods
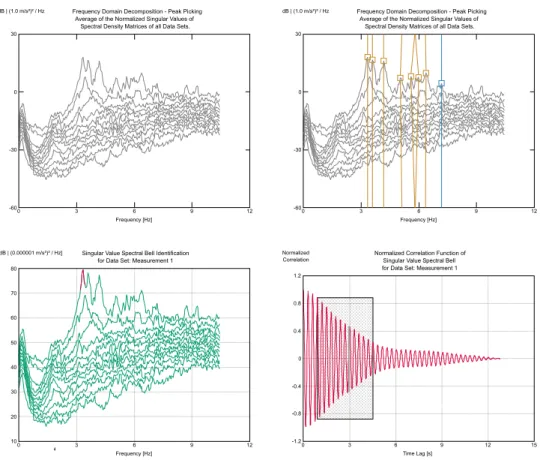
Enhanced Frequency Domain Decomposition (EFDD) is a modified form of the Frequency Domain Decomposition (FDD) method. FDD uses Singular Value Decomposition (SVD) of Auto Spectral Density (ASD) of the response matrix instead of its ASD directly [5]. It has been proved [1] that the peaks of a singular value plot indicate the presence of structural modes. Pick-picking is performed on the SVD plot, in the same manner as for the traditional peak picking method applied to the ASP plot. The modal estimation is divided into two steps. In the first step FDD Peak-picking is performed and in the second step the mode shapes identified by FDD are used to identify the SDOF Spectral Bell function by employing in user specified Modal Assurance Criteria (MAC) value to include the singular values at both sides of the peak position of the SVD diagram. The natural frequency and the damping ratio of the mode are estimated by transforming the SDOF Spectral
0 5000 10000 15000 −0.4 −0.3 −0.2 −0.1 0 0.1 0.2 0.3 0.4 Time (sec.) Acceleration (m/sec 2)
Figure 3: Typical time-history at the first response accelerometer
sequence crowd configuration start (sec.) end (sec.) length (sec.)
1 empty stadium 12750 13250 500 2 crowd leaving 10500 10750 250 3 crowd seating 4900 5150 250 4 crowd filling 3000 3200 200 5 half time 6750 7250 500 6 goal 9360 9510 150
Table 1: Distribution of data blocks used in the analysis
Bell to time domain. Using a simple regression analysis as the time domain function, the natural frequency and damping ratio can be evaluated.
Stochastic Subspace Identification (SSI) is applied directly to the time domain acceleration response data. In this method, a parametric model of the system is fitted directly to the responses of the accelerometers. The parameters in the model can vary accordingly to the way that a parametric model is fitted to the raw time-domain response data. In this paper three different procedures of SSI have been used; Unweighed Principal Component (UPC), Principal Component (PC) and Canonical Variate Analysis (CVA). All the three methods are similar, except that they differ on how the input matrix is weighted [13].
The third set of methods are based on the Natural Excitation Technique (NExT) [8]. As described in the NExT procedure, cross-correlation and auto-correlation of response signals in the presence of ambient excitations are related to the impulse response of the system. The LSCE [2], ERA [3] and SSTD [4] methods are all based on curve fitting the impulse response function of the system. The LSCE and ERA methods can process multiple signals at once. However the SSTD method can only consider one only signal at a time. For this reason, the SSTD method has been applied to the auto-correlation of signal from the first accelerometer to process modal parameters.
3.2 Estimation of modal frequencies and damping
Shaker-based modal testing was performed prior to the remote monitoring of the system. A single shaker was used to excite of the structure. Modal parameters computed from the Frequency Response Functions(FRF) obtained via the shaker-based testing are presented in the Table 2
Mode Natural frequencies Viscous modal damping ratio
(Hz) (%) 1 3.28 1.1 2 3.55 1.3 3 4.14 1.2 4 4.97 1.3 5 5.79 0.7 6 6.04 1.0 7 6.29 1.2 7 7.00 1.1 8 7.59 0.8
‘
Figure 4: Procedures of EFDD in ARTeMIS software
2 3 4 5 6 7 8 9 10 0 20 40 60 80 100 0.00% 2.40% 4.80% 7.20% 9.60% 12.00% ERA / NExT: Crowd Leaving, 10500−10750 seconds
Frequency, Hz
Modal Order
damping
Power Spectral Density (dB)
−55.0 −35.0 −15.0 5.0 25.0 45.0
2.5 3.0 3.5 4.0
o
o
o
o
o
o
o
o
o
o
o
o
o
o
o
o
o
o
o
o
o
o
o
o
o
o
o
o
o
o
o
o
o
o
o
o
o
o
o
o
o
o
Mode 1 Frequency [Hz] 1 2 3 4 5 6 Crowd Configuration 3.0 3.5 4.0 4.5o
o
o
o
o
o
o
o
o
o
o
o
o
o
o
o
o
o
o
o
o
o
o
o
o
o
o
o
o
o
o
o
o
o
o
o
o
o
o
o
o
o
Mode 2 Frequency [Hz] 1 2 3 4 5 6 Crowd Configuration 3.0 3.5 4.0 4.5 5.0o
o
o
o
o
o
o
o
o
o
o
o
o
o
o
o
o
o
o
o
o
o
o
o
o
o
o
o
o
o
o
o
o
o
o
o
o
o
o
o
o
o
Mode 3 Frequency [Hz] 1 2 3 4 5 6 Crowd Configuration 3.5 4.0 4.5 5.0 5.5 6.0o
o
o
o
o
o
o
o
o
o
o
o
o
o
o
o
o
o
o
o
o
o
o
o
o
o
o
o
o
o
o
o
o
o
Mode 4 Frequency [Hz] 1 2 3 4 5 6 Crowd Configuration 4.0 4.5 5.0 5.5o
o
o
o
o
o
o
o
o
o
o
o
o
o
o
o
o
o
o
o
o
o
o
o
o
o
o
o
o
o
o
o
o
o
o
o
o
Mode 5 Frequency [Hz] 1 2 3 4 5 6 Crowd Configuration 4.0 5.0 6.0 7.0 8.0o
o
o
o
o
o
o
o
o
o
o
o
o
o
o
o
o
o
o
o
o
o
o
o
o
o
o
o
o
o
o
Mode 6 Frequency [Hz] 1 2 3 4 5 6 Crowd Configuration 5.0 5.5 6.0 6.5 7.0 7.5o
o
o
o
o
o
o
o
o
o
o
o
o
o
o
o
o
o
o
o
o
o
o
o
o
o
o
o
o
o
o
o
o
Mode 7 Frequency [Hz] 1 2 3 4 5 6 Crowd Configuration 5.0 5.5 6.0 6.5o
o
o
o
o
o
o
o
o
o
o
o
o
o
o
o
o
o
o
o
o
o
o
o
o
o
Mode 8 Frequency [Hz] 1 2 3 4 5 6 Crowd Configuration 6.0 6.5 7.0 7.5 8.0 8.5o
o
o
o
o
o
o
o
o
o
o
o
o
o
o
o
o
o
o o
Mode 9 Frequency [Hz] 1 2 3 4 5 6 Crowd Configuration Color Identifications o FEDD o UPS o PC o CVA o LSCE o ERA o SSTD Crowd Configurations 1: empty 2: leaving 3: seating 4: filling 5: Half time 6: GoalFigure 6: Natural frequencies computed by different parameter estimation methods at different crowd configurations 0.0 1.0 2.0 3.0
o
o
o
o
o
o
o
o
o
o
o
o
o
o
o
o
o
o
o
o
o
o
o
o
o
o
o
o
o
o
o
o
o
o
o
o
o
o
o
o
o
o
Mode 1 Damping [%] 1 2 3 4 5 6 Crowd Configuration 0.0 1.0 2.0 3.0 4.0 5.0o
o
o
o
o
o
o
o
o
o
o
o
o
o
o
o
o
o
o
o
o
o
o
o
o
o
o
o
o
o
o
o
o
o
o
o
o
o
o
o
o
o
Mode 2 Damping [%] 1 2 3 4 5 6 Crowd Configuration 0.0 2.0 4.0 6.0 8.0o
o
o
o
o
o
o
o
o
o
o
o
o
o
o
o
o
o
o
o
o
o
o
o
o
o
o
o
o
o
o
o
o
o
o
o
o
o
o
o
o
o
Mode 3 Damping [%] 1 2 3 4 5 6 Crowd Configuration 0.0 2.0 4.0 6.0 8.0o
o
o
o
o
o
o
o
o
o
o
o
o
o
o
o
o
o
o
o
o
o
o
o
o
o
o
o
o
o
o
o
o
o
Mode 4 Damping [%] 1 2 3 4 5 6 Crowd Configuration 0.0 2.0 4.0 6.0 8.0o
o
o
o
o
o
o
o
o
o
o
o
o
o
o
o
o
o
o
o
o
o
o
o
o
o
o
o
o
o
o
o
o
o
o
o
o
Mode 5 Damping [%] 1 2 3 4 5 6 Crowd Configuration 0.0 2.0 4.0 6.0 8.0o
o
o
o
o
o
o
o
o
o
o
o
o
o
o
o
o
o
o
o
o
o
o
o
o
o
o
o
o
o
o
Mode 6 Damping [%] 1 2 3 4 5 6 Crowd Configuration 0.0 1.0 2.0 3.0o
o
o
o
o
o
o
o
o
o
o
o
o
o
o
o
o
o
o
o
o
o
o
o
o
o
o
o
o
o
o
o
o
Mode 7 Damping [%] 1 2 3 4 5 6 Crowd Configuration 0.0 1.0 2.0 3.0o
o
o
o
o
o
o
o
o
o
o
o
o
o
o
o
o
o
o
o
o
o
o
o
o
o
Mode 8 Damping [%] 1 2 3 4 5 6 Crowd Configuration 0.0 1.0 2.0 3.0o
o
o
o
o
o
o
o
o
o
o
o
o
o
o
o
o
o
o
o
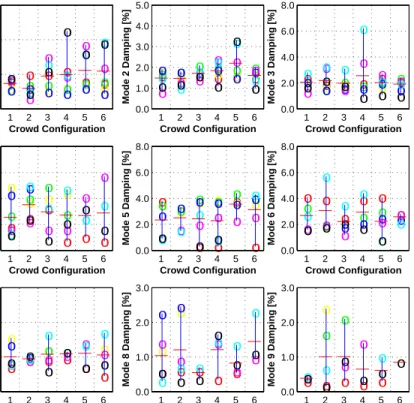
Mode 9 Damping [%] 1 2 3 4 5 6 Crowd Configuration Color Identifications o FEDD o UPS o PC o CVA o LSCE o ERA o SSTD Crowd Configurations 1: empty 2: leaving 3: seating 4: filling 5: Half time 6: GoalFigure 7: Modal damping computed by different parameter estimation methods at different crowd configurations
During the acquisition process, the response data were sampled at 80Hz. For a large civil engineering structure like a stadium, natural frequencies of interest are usually lower than 10Hz. Nyquist frequency for RMS data being 40Hz, all the response signals were filtered with low-pass filter to 20Hz prior to implementing the EFDD, UPC, PC and CVA methods implemented in ARTeMIS software. In all cases the response signal from the first accelerometer, which is at the test point 1 has been taken as reference signal. Fig. 4 shows the procedure for EFDD using ARTeMIS software. EFDD methods provides both information for natural frequencies and damping ratios.
For the methods based on NExT procedures, first cross- and auto-correlation functions have been computed for all response signals taking the first accelerometer signal as the reference signal. In Fig. 5, a stability plot computed with ERA method has been shown. It can be noted that in order avoid many number of unnecessary modes, in the stability plot maximum frequency and damping limits have been set to 10Hz and 12%
Modal parameters computed by the methods have been presented in the two block diagrams. Fig. 6 contains natural frequencies information and Fig. 7 contains corresponding damping values. Each block diagram contains 9 charts associated with first 9 modes of the stadium structure. Each chart in a block consists of six results for six different sets of test data associated with the crowd configurations. Seven different modal parameter identifications methods are used and modal parameters from each method are associated with a specific color.
A horizontal line (red color) have been marked on each set of the plot for modal parameters. This is the average value of all modal parameters. It can be seen from Fig. 6 and 7 that the estimated damping values are higher than the values from the FRF based testing of the empty structure. In some of the graphs, damping tend to increase and natural frequencies tends to decrease, which agree with the previous findings [9–11]. However the increases of damping are not the same for different crowd configurations. Reduction of the natural frequencies have been relatively constant as compared to the increasing values of damping. Another observation is that there is a drop of damping values significantly at the time of goal. This might be due to the substantially different behavior of the crowd during a goal event.
4 COMPARISON OF DIFFERENT METHODS
Different parameter estimation techniques vary in terms of the identified modal parameters. It is sometimes useful to use different methods to enhance confidence in the estimated modal parameters. In this paper three sets of identification techniques have been used. Firstly, the EFDD method is based on SVD of the response matrix. Users have quite good control in choosing natural frequencies and damping which are based on the peaks of SVD plots. Secondly, the UPC, PC and CVA methods are all based on the SSI principle. These three methods have lot in common, which have been reflected in the identified modal parameters. It can be observed that damping values computed with these methods are typically higher than produced in other methods. Again it can be observed that weak modes are not identified properly with these methods. Finally, the LSCE, ERA and SSTD methods are based on the NExT principle. LSCE and ERA methods have been able to compute modal parameters quite accurately. LSCE method is able to estimate modal parameters of the weakly excited modes quite accurately. Care should be taken to separate spurious computational modes from the real modes. In the LSCE method, modal parameters change rapidly as the modal order of the system increases. Unlike the LSCE method, in the ERA method modal parameters do not vary rapidly as the modal order increases, which gives more confidence in the ERA-estimated modal parameters. Unlike LSCE and ERA methods, the SSTD method is based on a single impulse response of the system. Stability diagram associated with this method also looks bit noisy as significantly few data are used to process modal parameters. So the SSTD method should not be used alone but in conjuction with other methods as a quality check.
5 CONCLUSION
It has been shown in this paper that different identification methods differ in their computation of modal parameters, even when the same data have been used for all the methods. It is important to use more identification methods to estimate modal parameters to give increased statistical confidence in the results. It appears that crowd structure interaction has a significant effect on natural frequencies and damping ratios of the stadium structure compared with its empty condition. Changes in natural frequencies and damping ratios are directly related to the crowd configurations. While considering change of natural frequencies, crowd can be considered as an additional mass to the structure, but while considering damping, nature of crowd behavior (standing, sitting, jumping, etc) is important.
It is very important to consider crowd configuration and behavior while designing a stadium. Effect of crowd configuration and their dynamics should be included in the dynamic analysis of the stadium structures during their design.
REFERENCES
[1] Ibrahim, S.R. and Mikulcik, E.C. “A method for the direct identification of vibration parameters from the free response”. Shock and Vibration Bulletin, 183-198, No. 47, Pt. 4, Sept. 1977
[2] D. L. Brown, R. J. Allemang, R. Zimmerman, M. Mergeay. “Parameter Extimation Techniques for Modal Analysis”. 7th International Seminar on Modal Analysis, Katholieke Universiteit Leuven, Belgium, 1985.
[3] J. N. Juang, R. S. Pappa, “An Eigensystem Realization Algorithm for Modal Parameter Identification and Model Reduction”. Journal of Guidance, Control, and Dynamics, 8(5):620-627, Sept.-Oct. 1985.
[4] S. A. Zaghlool, “Single-Station Time-Domain (SSTD) Vibration Testing Technique: Theory and Application”. Journal of Sound and Vibration, 2(72):205-234, 1980.
[5] R. Brincker and L. Zhang and P. Andersen. “Modal Identification from Ambient Responses using Frequency Domain Decomposition” Proceedings of the 18th International Modal Analysis Conference (IMAC), San Antonio, Texas, 2000. [6] R. Brincker and C.E. Ventura and P. Andersen. “Damping Estimation by Frequency Domain Decomposition” 19th
International Modal Analysis Conference (IMAC), Kissimmee, Florida, 2001.
[7] R. Brincker and L. Zhang and P. Andersen. “Modal Parameter Estimation from Ambient Response Data” Proceedings of the 19th International Modal Analysis Conference (IMAC), San Antonio, Texas, 2000.
[8] G. H. James, T.G. Carne, J. P. Lauffer, and Sandia National Laboratories. “The Natural Excitation Technique (NExT) for modal parameter extraction from operating structures”. Journal of Analytical and Experimental Modal Analysis, 10(4):260-277, October 1995.
[9] R. Sachse, “The influence human occupants on the dynamic properties of slender structure”Ph.D. Thesis, The University of Sheffield, UK, April 2002, ISMN: 3-936231-71-0.
[10] B. R. Ellis and T Ji, “Human-structure vibration in vertical vibrations”Proceedings of the Institute of Civil Engineers, Structures and Buildings, Vol. 122(1), pp. 1-9, 1997.
[11] P. Reynolds, A. Pavic and Z. Ibrahim, “Changes of modal properties of a stadia structure occupied by a crowd” Proceedings of IMAC-XXII, January 26-29, 2004, Dearborn, Michigan.
[12] P. Reynolds, A. Pavic and Z. Ibrahim, “A Remote Monitoring System for Stadia Dynamics ” 21st International Modal Analysis Conference (IMAC XXI), February, 2003, Florida, USA.
[13] Overschee, P. van and B. De Moor, Subspace identification for linear systems – Theory, Implementation, Applications. Kluwer academic Publishers, ISBN 0-7923-9717-7, 1996