Computer network traffic models: research,
hypotheses, results
Alexander Buslaev, Alexander Zernov, Pavel Sokolov, Marina Yashina,
Abstract—Dynamical system on regular network of type Chainmail was introduced by Buslaev A.P. et al. In the paper we consider two approaches to the study of flows on networks. The first approach is a classical model of cellular automata. The novelty consists of a gradual increase in number of parameters of the problem and exploring the links between the regular networks we consider. The second approach is based on a simplified model of continual traffic, i.e. cluster model that has developed from the follow-the-leader model and hydrodynamic models. Regular composite networks of Chainmail type were studied
Some results of estimation of the system behavior were obtained.
Index Terms—Regular networks, Traffic flow, Cluster model, Chainmail.
I. INTRODUCTION
A problem of traffic control is a hot issue in the Russian Federation due to the rapid growth of motorization, because now there are much more cars than roads. The speed of construction of the road network in Russia significantly lags behind the pace of increase in the number of cars. In spite of some progress made in addressing the problems of traffic in developed countries it appears that there is still no satis-factory theoretical base for traffic modelling and optimization, especially in big cities with complex road network.
It is explicitly confirmed by a difficult traffic situation on the streets of many large cities in the world, as well as confirmed indirectly by attempts to solve typical traffic optimization problems within the framework of international conferences, eg, Traffic and Granular Flow Conferences [1]. One of key challenges is accounting for a substantial human component in traffic flows modelling, as the traffic is a complex socio-technical system.
II. INFORMATION REVOLUTION
Despite of the complexity of traffic modelling, rapid devel-opment of information technology and increase in the capacity of computing equipment provide certain reasons for optimism in addressing traffic modelling and optimization problems. The purpose of information technology and computing hardware consists of a gradual and reliable replacement of direct human control and intervention in traffic flows and its regulation. A. Buslaev is with the Moscow Automobile and Road STU, Moscow, Russia, 125319, Leningradsky prosp., 64, E-mail: [email protected]
A. Zernov is with the Moscow Automobile and Road STU, Moscow, Russia, 125319, Leningradsky prosp., 64, E-mail: [email protected]
P. Sokolov is with the Moscow Automobile and Road STU, Moscow, Russia, 125319, Leningradsky prosp., 64, E-mail: [email protected]
M. Yashina is with the Moscow TU of Communications and Informat-ics , Moscow, Russia, 111024, Aviamotornaja Street, 8a, E-mail: [email protected]
Substantial progress is particularly notable in development of intelligent systems for a single vehicle and its response to the changes in road situation and accidents prevention on a local road section. However, there is substantially less progress in addressing the task of optimization of traffic flow optimization on larger segments of road network. Still, there is no reliable solution to the problem of optimization of a tactics of an individual participant in order to contribute to traffic flow optimization in a whole. The significant progress in technologies of data gathering and traffic monitoring has been recently achieved, but it only emphasizes the lack of a common theoretical approach to its processing and interpretation.
III. THE AGENT-BASED MODEL AS AN ADVANCED”COIN TOSS”
Agent-based models that are based on the synthesis of cellular automata theory, theory of graphs and networks, and computer equipment, only provide an illusion of a theoreti-cal solution of the traffic problem. In fact, the agent-based approach is well-formulated method of a ”coin toss” for a respective problem. As we know from the history of the theory of probability, an experiment with a coin resulted in the discovery of Bernoulli distribution, which was followed by the central limit theorem. Unfortunately,there was no progress in methods, applicable for reliable traffic modelling yet. But this is natural: a coin has only two faces, compared with the wide array of parameters of a road network. These two particular properties of the traffic problems: the complexity of modelling of the socio-technical system of traffic and the experience of successful solution of some specific aspects of traffic modelling, create a favorable environment for maintaining interest in its solution.
IV. EXPANSION OF THE PARAMETERS LIST BEYOND ”SPEED,DENSITY,INTENSITY”
Below we consider two approaches to the study of flows on networks. The first approach is a classical model of cellular automata. The novelty consists of a gradual increase in number of parameters of the problem and exploring the links between the regular networks we consider. The second approach is based on a simplified model of continual traffic - cluster model that has developed from the follow-the-leader model and hydrodynamic models. The point is that the objects of interaction are not the particular areas of traffic, but their stable components - packs, clusters, which move synchronously and interact with other clusters according to certain rules.
V. MODEL OF TOTAL CONNECTED INCOMPRESSIBLE CLUSTERS ON NETWORKS
A. Problem formulation
We investigate the cluster model of the flow at the rings. We describe the scheme of cluster movement at rings. As a result of the simulation we obtained velocity characteristic of the system. We created software that simulates cluster movement at the ring, and calculates the characteristics of the system. In order to obtain limit values of velocity, a calculating experiment has to be run.
B. Definition of a cluster
A cluster is a steady movement of two or more particles at equal distances from each other as a limit of a follow-the-leader model. In this model, a cluster is shown as a geometrical figure, visualizing a flow of particles moving in the same direction with identical speed. The square of the figure determines the number of particles in the cluster or the cluster mass M. The mass of the cluster remains constant. The speed V of the cluster is a monotonic function, which depends on its density y [2]. For example function u(y)has is the following ,
u(y) =u0ymax−y ymax
Fig. 1. Cluster
C. Movement support description
A ring is a closed strip with length ”L”. Clusters are moving at the rings.
Network is a number of rings with intersection points. D. Movement Rules
If a moving cluster is at a intersection point while another cluster on the neighboring ring is about to reach the same intersection point, it stops until a confliction cluster leaves the intersection point (on first in-first out basis).
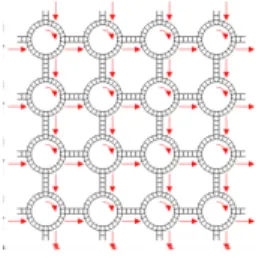
E. The results of a simulation study for the regular network We have a regular network of M ×N(M, N−even num-bers), made up of equal, intersecting rings. Each ring has four points of intersection with the adjacent rings. The clusters with the equal length move in the same direction around the rings[3], [4].
The direction of movement is defined in this way: each ring has two indices, which are numbers of the row and the column. If the sum of the indices is even, the cluster moves within this ring counterclockwise, otherwise the cluster moves clockwise. As a result of mathematical modeling we get the following data:
Fig. 2. Proper network co-directional traffic
Fig. 3. Plot velosity of cluster length
Fig. 4. Plot velosity when a partially dynamic trafficL= 90
Step 1:If the clusterL= 180, we have a full congestion. The system velocity decreases monotonically with the increase of the length of a cluster.
Step 2: If a partial dynamical jam is formed, the instan-taneous speed is fluctuating. If the jam is not dynamic, the instantaneous speed becomes constant, but does not reach the maximum value.
Fig. 5. Cluster velocity plot at aL= 89
Step 3:The system has the synergy state if clusterL <90, and swings at cluster L of 90.
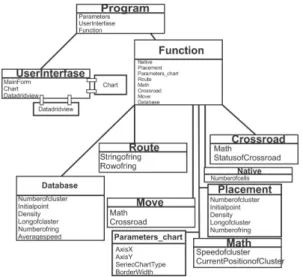
F. Software Description
The Software consists of functions, user interface, a set of parameters.
Fig. 7. Scheme of software
This figure shows the functions of the user interface and a set of parameters which are included in the software.
1) Interface software:
Fig. 8. Interface software
Area 1 shows cluster movement. Field 2 shows system velocity.
Field 3 shows the number of particles at every support. Fields 4 shows the size of the network (the number of rows and columns).
Button 5 is designed to build a network according to parameters defined above.
Field 6 shows the length of the cluster. Fields 7 shows cluster density.
Button 8 restarts the program.
Button 9 enables or disables automatic cluster placement according to the given parameters.
Button 10 is show for cluster placement (if the automatic cluster placement is disabled, the software will place a cluster
at each ring, the ring at which the current cluster will be placed is chosen randomly).
Button 11 enables or disables ”male/female” rule. If this function is enabled, the cluster settings on the secondary diagonal are to be set in the fields 12 and the fields of clusters on the main diagonal are to be set in the fields 13.
Button 14 enables / disables the calculation and chart of instantaneous velocity of the entire system.
Button 15 enables / disables the calculation and chart of the average velocity of the entire system.
Button 16 enables / disables the change of direction func-tion.
Field 17 sets the movement direction. Button 18 changes the current direction.
Button 19 starts or stops the movement of the clusters. Field 20 is intended for displaying charts.
Button 21 loads parameters from the database. Button 22 switches on and off models
Tab 23 contains database.
VI. NAGEL- SCHREKKENBERK CELLULAR AUTOMATA ON MORPHING OFMANHATTAN NETWORK AND THE TYPE OF
CHAINMAIL
A. Finite-parametric network
We consider a network with a finite set of parameters. Let us call the plain networks with a periodic structure asregular networks.
For a given rectangular area we generate a cell decomposi-tion. Cell numberM ×N and the sizea×b= ∆x×∆y.
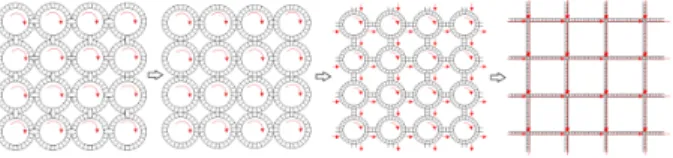
Rectangular area is stretched on a torus, i.e. we assume the left and right vertical borders equal, as well as upper and lower limits, and thus, we get a Manhattan network Fig.9 on the torus [2].
Fig. 9. Manhattan network on the torus
In Fig. 9 we replace each node by a circle of radius r on the network.
If the radius of the circles reaches the maximum value, r = a2, the length of the linear segments is equal to 0. In this case, the network is a chainmail. Fig.10 shows a network corresponding to these parameters. Such a network was investigated in [3].
We note, that the network nodes are the points of tangency. We assume that movement on each traffic channel is pos-sible only in one direction. We set a movement direction on the created network.
in one direction only a linear segment length is comparable to the radius, so that we obtain network type Fig.11.
Fig. 10. Chainmail on the torus
Fig. 11. Right two-network on the torus, with the direction of movement
B. Measurement of linear size of the network
We create a uniform partition by cells of the created two-component network, Fig.12.
Let kbe the number of cells in a circle partition, and let l be the number of cells on the segments. The number of cells in the network is equal toK.
K=k·(M·N) + 2·l·M ·N. Note that
1≤l≤ k
π.
If l= 1 we obtain a network of chainmail type, [3]. We assume Fig.12k= 24, l= 6and size network
K= 16K+ 32L= 576.
C. Generation of the initial data
At every moment in the same cell there is no more that one particle. The initial arrangement of particles is created randomly.
We fix network density ρ.
a) For each particle a randomly selected item number is chosen (a ring or a segment). Then a position of a particle on the element is randomly assigned.
b) We select a periodic unit. We place particles on this unit uniformly. The placement of particles is periodically extended to the whole network.
Fig. 12. Right two-network on the torus, with the direction of movement
D. Rules of particle movement
1) Moving forward: Moving a particle one cell forward is carried with the probability p = 1 provided that the corresponding neighbor cell is vacant. This motion is called individual movement.
Fig. 13. Particle moving to one cell forward is carried with the probability
p
2) Selection of movement: If there is a choice of trajectory of further movement of a particle, is a particle is on the intersection point of a ring and a liner segment, Fig.14. Movement of a particle is determined by the parameter α. Thenαis the probability of the particle remains on the ring, respectively,(1−α)is the probability of the particle lefts the ring. If α= 12, a random movement of particles occurs over the network.
Fig. 14. Motion of a particle at the junction of the ring and the segment, with the probabilityα
3) Competition: For the network in Fig.12 and a set field of directions conflicting points are cells in which the particles switch from legs to rings. At the same time a particle may move by the ring to the same point.
Competition rules is resolved with the probability β = 12, which is called equal movement. An example of competition resolution is shown in Fig.15.
Fig. 15. Example permits competition with the probabilityβ=12
E. Particle state. Software implementation
The state of the particles is indicated by colors in the program.
Green colorindicates that the next cell is vacant and thus the particle will not stop.
Redcolor indicates that the particle is not moving, waiting for the next cell to get vacant. This situation can occur on the
ring or on the linear segment or in case of a particle movement to a conflict cell and its entering into competition with another particle.
Yellowcolor indicates that the particle has lost competition for the vacant cell and is not moving.
F. Instant and average velocity
The instantaneous and average velocity of the particles are calculated by the following formulas:
vm= 1 C C X i=1
vi, where C is the particles number
vcp= 1 N N X i=1
vmi, where N is the measurements number
G. Morphing of network by L,K=const
Morphing is a seamless transition from one network to another, provided that the number of cells in both networks is identical. An example of morphing is shown in Fig.16.
Fig. 16. Morphing
H. Geometry
H.A. Chanmail parametersk= 28(there is a common cell),
L= 1, Fig.17.
Fig. 17. Chainmail on the torus
H.B.Correct network parametersk= 28, L= 2, Fig.18.
H.C.Right two-Network parametersk= 24, L= 4, Fig.19.
H.D.Manhattan network parametersk= 4, L= 14, Fig.20.
Fig. 18. Correct network on the torus
Fig. 19. Right two-Network on the torus
Fig. 20. Manhattan network on the torus
I. The results of a simulation study
Particles are placed randomly over all cells, while there can’t be more than one particle in a cell.
The motion of each particle is individual. The movement of a particle to a vacant cell occurs with the probabilityp= 1.
The control of particles movement from the ring to a linear segment is carried out by the parameter. The parameterαvaries. Resolution of particles competition at intersection points occurs with the probability of12.
By changing the parametersk (the number of cells on the rings),L(distance between the rings in the cells), we simulate a number of different networks with the same number of cells equal to 448. We get morphing Fig.16 from multiple networks. The number of rings in all networks is identical and equals to 16.
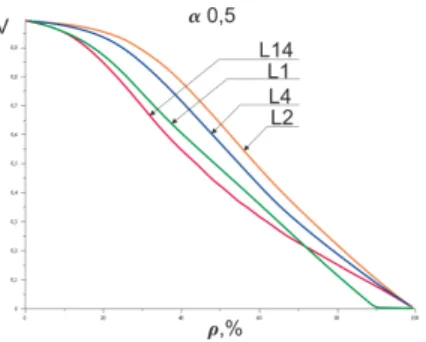
Comparing the obtained graphs of the dependence of average velocity on the density at different valuesαwe get the following results shown in the figures.
In Fig.21 it is shown network of Chainmail type. The follow-ing results are obtained.
1. In case of a global movement of all particles for the networks types C and D, the flow behavior is characterized by the movement of the linear portion of the closed circuit [3].
2.At global movement of all particles for the network Mail results converged with the results of the article [4].
Fig. 21. NetworkingA, C, Dα= 0
3.In the global motion of the particles for networks A, B and C formed by the collapse of 90% flux.
Fig. 22. NetworkingA, B, C, Dα= 0,5
In Fig.22 we can see the following result.
4.When the random walk of the particles for networks A, B, C and D on the flow behavior of the network is similar to the behavior of the flow on a multilane road.
Fig. 23. NetworkingA, B, C, Dα= 1
In Fig.23 we can see the following result.
5.At local motion of the particles, for networks B, C and D collapse occurs faster with the decrease in the length of the ring. For a network chainmail graph comparing the density of the number of competitions, for different values αwe get the following results Fig.24.
In Fig.24 we can see the following result.
6. Network chainmail regardless of local or global motion does not change the amount of competition.
Fig. 24. h- the number of competitions
VII. CONCLUSION ANDFUTURE WORKS
We have introduced and studied composite networks of Chainmail type. Results of system behavior were obtained.
Future works will be connected with the following. A. Model totally related incompressible cluster in networks
1) Quasi regular network: In this network rings which sum of the indices is even have a radius of 2 tines greater than the rings which sum of the indices is odd. This ifi+j= 2k, then
Ri,j = 2r.
Fig. 25. Chainmail on the torus
To spend the same study as well as for the correct network. B. Generation networks. Motion study
Further development of the program will be in the bellow direction:
1.Further study of traffic on two networks, by changing the parameters of a new configuration, yielding a two-network.
2. Generating wrong networks. Studying the behavior of traffic on the wrong network.
REFERENCES
[1] V. V. Kozlov, A. P. Buslaev, A. S. Bugaev, M. V. Yashina, A. Schadschneider, M. Schreckenberg.Traffic and Granular Flow ’11. Eds.: Proc. of Int. Conf. TGF’11, Mocow, Russia, Springer, 2013.
[2] A.P. Buslaev, A.G. Tatashev, M.V. Yashina. Cluster flow models and properties of appropriate dynamic system // Journal of Applied Functional Analysis, vol. 8, no. 1, pp. 54-76 (2013)
[3] V.V. Kozlov, A.P. Buslaev, A.G. Tatashev.Monotonic walks on a necklace and coloured dynamic vector // International Journal of Computer Mathe-matics (2014). DOI: 1080 00207150.2014/915964
[4] V.V. Kozlov, A.P. Buslaev, A.G. Tatashev. Behavoir of pendulums on a regular polygon // Journal of Communication and Computer, vol. 11, 2014, pp. 30-38.
[5] V.V. Kozlov, A.P. Buslaev, A.G. Tatashev, M.V. Yashina.Monotonic walks of particles on a chainmail and coloured matrices // Proceedings of the 14th International Conference on Computational and Mathematical Methods in Science and Engineering, CMSSE 2014, Cadiz Spain, June 3-7 2014, vol. 3, pp. 801-805.
[6] V.V. Kozlov, A.P. Buslaev, A.G. Tatashev.A dynamical communication sys-tem on a network // Journal of Computational and Applied Mathematics, vol. 275 (2015), pp. 247-261.