The NTHMP Tsunameter Network
FRANK I. GONZA´LEZw, EDDIE N. BERNARD,
CHRISTIAN MEINIG, MARIE C. EBLE, HAROLD O. MOFJELD and SCOTT STALIN
NOAA/Pacific Marine Environmental Laboratory, Seattle, WA 98115, USA
(Received: 15 December 2003; accepted: 27 April 2004)
Abstract. A tsunameter (soo-NAHM-etter) network has been established in the Pacific by the National Oceanic and Atmospheric Administration. Named by analogy with seismometers, the NOAA tsunameters provide early detection and real-time measurements of deep-ocean tsunamis as they propagate toward coastal communities, enabling the rapid assessment of their destructive potential. Development and maintenance of this network supports a State-driven, high-priority goal of the U.S. National Tsunami Hazard Mitigation Program to im-prove the speed and reliability of tsunami warnings. The network is now operational, with excellent reliability and data quality, and has proven its worth to warning center decision-makers during potentially tsunamigenic earthquake events; the data have helped avoid issu-ance of a tsunami warning or have led to cissu-ancellation of a tsunami warning, thus averting potentially costly and hazardous evacuations. Optimizing the operational value of the network requires implementation of real-time tsunami forecasting capabilities that integrate tsunameter data with numerical modeling technology. Expansion to a global tsunameter network is needed to accelerate advances in tsunami research and hazard mitigation, and will require a cooperative and coordinated international effort.
Key words: tsunami, tsunameter, tsunami measurement, tsunami warning, tsunami forecast, hazard mitigation, National Tsunami Hazard Mitigation Program
Abbreviations: BPR – bottom pressure recorder, DART – Deep-ocean Assessment and Reporting of Tsunamis, NDBC – National Data Buoy Center, NOAA – National Oceanic and Atmospheric Administration, NTHMP – National Tsunami Hazards Mitigation Pro-gram, PMEL – Pacific Marine Environmental Laboratory, PTWC – Pacific Tsunami Warning Center, SIFT – Short-term Inundation Forecast for Tsunamis, SASZ – South American Subduction Zone, TAO – Tropical Atmosphere and Ocean array, USGS – U.S. Geological Survey, WC/ATWC – West Coast and Alaska Tsunami Warning Center
1. Background and Introduction
Just as the worldwide seismometer network has been essential to progress in the field of seismology, a global tsunameter (soo-NAHM-etter) network is critical to the further advancement of tsunami research and hazard mitiga-tion. The U.S. National Tsunami Hazard Mitigation Program (NTHMP), w
Author for correspondence: Tel: +1-206-526-6803; Fax: +1-206-526-6485; E-mail: frank.i.gonzalez@ noaa.gov
led by the National Oceanic and Atmospheric Administration (NOAA), has taken a first important step with the development and field-testing of the first generation of reliable tsunameters (Figure 1) and the successful establish-ment of a Pacific network (Milburnet al., 1996; Meiniget al., 2001; Bernard
et al., 2001). The operational network (Figure 2), though currently small, is a powerful catalyst for the revolutionary paradigm shift now underway in tsunami research and forecasting – away from indirect observations and toward direct, high-quality measurements and analyses of the tsunami itself. Heretofore, tsunami research and operational decisions of NOAA’s Pacific Tsunami Warning Center (PTWC) and West Coast and Alaska Warning Center (WC/ATWC) have depended primarily on analyses of seismic information and coastal tide gage measurements. Though valuable, these data are essentially indirect and their interpretation is highly prob-lematic. Seismic data interpretation involves poorly understood seismic/ hydrodynamic coupling. Similarly, the interpretation of tide gage data is difficult because of the complex tsunami transformations induced by interaction with shelf, coastline, and harbor features. Furthermore, a tide gage may not survive the impact of the tsunami itself and, if it does survive, the data are not reported until after the tsunami strikes a coastal com-munity. Finally, though coastal tide gages are very useful to warning operations (and extremely valuable in post-event scientific case studies) they
Figure 1. The NOAA tsunameter, illustrating the four major components that had to be integrated into a single system (see text): BPR, acoustic link, surface buoy, and satellite telecommunications.
cannot provide data that are especially important to operational hazard assessment – direct, deep ocean measurements of tsunamis as they propa-gate from the source to coastal communities.
Engineering advances by NOAA’s Pacific Marine Environmental Labo-ratory (PMEL) have now enabled creation of the NOAA tsunameter, a highly reliable system that acquires and delivers direct tsunami measurements at deep ocean locations between the source and distant communities. This report provides an overview of the research and development effort, the current state of the network, and plans for future technical improvements and expansion.
2. The NTHMP and State-Driven Goals for Warning Improvement
The NTHMP is a partnership of the five Pacific States – Alaska, Cali-fornia, Hawaii, Oregon, and Washington – with NOAA, the U.S. Geo-logical Survey (USGS), the Federal Emergency Management Agency, and the National Science Foundation. NOAA bears primary national respon-sibility for tsunami warnings and hazard mitigation. Accordingly, the overarching goal of the NTHMP is to reduce the tsunami hazard to U.S. coastal communities. Each State is represented on the 23-member NTHMP Steering Group by at least two individuals, one from the State emergency management agency and another from the State geotechnical Figure 2. NDBC web page, at URL http://www.ndbc.noaa.gov/dart.shtml. The cur-rent NOAA Pacific tsunameter network and the real-time data display are shown. Information on individual stations and relevant reports that can be viewed on-line are also accessible through links at this site.
agency (the State counterpart to the USGS); similarly, at least two representatives of each Federal Agency are Steering Group members (http://www.pmel.noaa.gov/tsunami-hazard/tsuhaz.htm). An eight-member Executive Committee is responsible for governance, with one vote allotted to each of the five States and three Federal Agencies and, when required, a ninth tie-breaking vote allocated to the NTHMP Chairperson. State-driven goals set priorities in each of the three NTHMP components dis-cussed in this special issue – Hazard Assessment, Warning Guidance, and Mitigation.
False alarms are a serious matter – they damage credibility, and evacua-tions place citizens at risk of injury or death and inflict heavy economic loss. The State of Hawaii estimated that a single false alarm would cause Hawaii an average loss of $58.2M in 1996 dollars (Hawaii Research and Economic Analysis Division, Department of Business, Economic Development and Tourism, 1996), or about $68M in 2003 dollars. Not surprisingly, therefore, the primary State concern regarding Warning Guidance is improvement of the tsunami warning system and, in particular, the need to ‘‘... quickly confirm potentially destructive tsunamis and reduce false alarms.’’ To ad-dress this goal, a recommendation was made that the NTHMP ‘‘Deploy Tsunami Detection Buoys’’ that would provide real-time, deep-ocean mea-surements, thereby improving operational assessments of potentially destructive tsunami impacts and reducing false alarms (Tsunami Hazard Mitigation Federal/State Working Group, 1996).
3. The Engineering Challenge
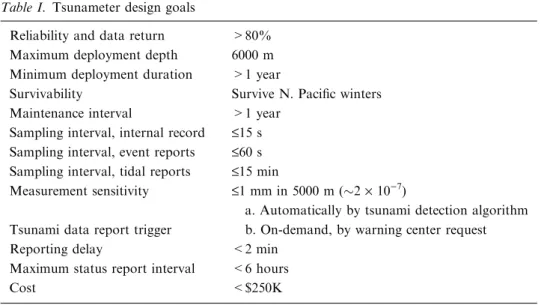
Development of an operational tsunameter was an extraordinary accomplish-ment. The task was to design, develop, test, and deploy real-time reporting, deep-ocean instrumentation capable of surviving a hostile deep-ocean environment while performing with the quality and reliability demanded of an operational tsunami warning system on which so many lives depend. The PMEL tsun-ameter project was initiated to meet this challenge, with the primary requirements listed in Table I as goals that would guide tsunameter design. No such system had ever been developed until the successful effort of the NOAA/PMEL Engineering Development Division.
3.1. THE STRATEGY
As with most effective research and development strategies, ‘‘reinventing the wheel’’ was avoided by an effort to build upon the experience and success of PMEL and others. A number of approaches were explored, but the final basic design consisted of four components: (1) a bottom pressure recorder
(BPR) and (2) an acoustic link to (3) a surface buoy equipped with (4) a satellite telecommunications capability (Figure 1).
Three of these four technologies were already in use at PMEL, but had to be modified and integrated into an operational tsunameter. BPR systems with an excellent track record of meeting the tsunameter requirements of reliability, sensitivity, sampling, deployment depth, and deployment duration had been developed earlier by PMEL (Eble and Gonzalez, 1991; Gonzalez
et al., 1991). Deep-ocean surface buoy technology at PMEL was also well developed, as witness the success of the Tropical Atmosphere and Ocean (TAO) array, the largest deep-ocean array in existence (Hayes et al., 1991; McPhaden, 1993; McPhaden, 1995; McPhaden et al., 1998); a significant challenge had to be overcome in adapting this technology to the needs of a tsunameter network – i.e., development of a buoy and mooring system that would survive the hostile environment of high latitude conditions. Satellite telecommunications had for years been routinely used by PMEL for near real-time data delivery to ground stations from the TAO array, and this technology was also used successfully to deliver real-time seismic data as part of a prototype local tsunami warning system that is still operational in Valparaiso, Chile (Bernard et al., 1988; Bernard, 1991). The remaining component – an acoustic link to provide robust, reliable transmission of BPR data from the seafloor to the surface – represented new, ground-breaking technology, on which much of the development effort focused.
The development, modification, and integration of all four components into a unified tsunameter system, though ultimately successful, proved to be a major engineering challenge. As might be expected, early efforts had to deal with and systematically eliminate a variety of potential problems leading to Table I. Tsunameter design goals
Reliability and data return >80% Maximum deployment depth 6000 m Minimum deployment duration >1 year
Survivability Survive N. Pacific winters Maintenance interval >1 year
Sampling interval, internal record £15 s Sampling interval, event reports £60 s Sampling interval, tidal reports £15 min
Measurement sensitivity £1 mm in 5000 m (2·10)7)
a. Automatically by tsunami detection algorithm Tsunami data report trigger b. On-demand, by warning center request
Reporting delay <2 min
Maximum status report interval <6 hours
data dropouts (Gonzalezet al., 1998). The overall effort, which began in 1996 (Milburnet al., 1996), was remarkable in scope. In time, the enterprise utilized eight different ships for 18 different cruises totaling about 90 days at sea, and the number of participants grew to include more than 25 PMEL engineers, technicians, and scientists, and individuals from more than 85 partner firms and suppliers (Bernard et al., 2001). In September 1997, the first successful deployment of an integrated tsunameter system provided a 3-month record off the Oregon coast, and by 1999 a three-station array was transmitting data from seafloor to desktop with a return rate of 97%, significantly higher than the original goal of 80% presented in Table I (Meiniget al., 2001).
3.2. OPERATIONAL NETWORK PERFORMANCE
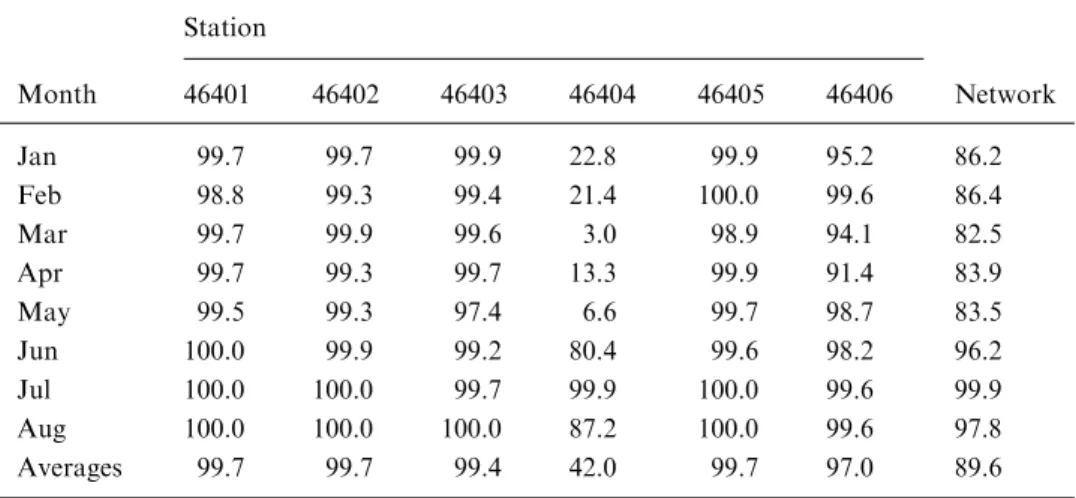
A two-year transition period has culminated in the transfer of full operational responsibility to NOAA’s National Data Buoy Center (NDBC), including network maintenance and data delivery. PMEL will continue to conduct an active R&D program for future upgrades and enhancements to the tsunam-eter network. The operational performance of individual tsunamtsunam-eter stations and the network as a whole are presented in Table II in the form of percentage data return rates for the first 8 months of 2003. An excellent NDBC web site provides public access to the real-time data and links to relevant reports that are viewable online: http://www.ndbc.noaa.gov/dart.shtml.
3.3 IDENTIFIED NEEDS – PROGRESS AND PLANS
The formal review of the NTHMP produced comments by the reviewers that identified general recommended improvements to the tsunameter network: an
Table II. Operational percentage data rates of individual tsunameter stations and the entire network for the first 8 months of 2003
Station Month 46401 46402 46403 46404 46405 46406 Network Jan 99.7 99.7 99.9 22.8 99.9 95.2 86.2 Feb 98.8 99.3 99.4 21.4 100.0 99.6 86.4 Mar 99.7 99.9 99.6 3.0 98.9 94.1 82.5 Apr 99.7 99.3 99.7 13.3 99.9 91.4 83.9 May 99.5 99.3 97.4 6.6 99.7 98.7 83.5 Jun 100.0 99.9 99.2 80.4 99.6 98.2 96.2 Jul 100.0 100.0 99.7 99.9 100.0 99.6 99.9 Aug 100.0 100.0 100.0 87.2 100.0 99.6 97.8 Averages 99.7 99.7 99.4 42.0 99.7 97.0 89.6
increase in the number and geographical coverage of tsunameter network stations; continued improvements in the instrumental technology; forecast methodologies and tools to interpret the data for more effective tsunami warnings. In response to these general recommendations, specific efforts are underway to:
(a) Expand the network and increase the geographical coverage. Though fully operational, the current network is too small. Careful and thorough-going siting studies are needed, but additional stations are clearly required for adequate coverage of all potential tsunami source zones in the Pacific, including the Alaska-Aleutian, Kamchatka, Japan-Kurile, South American, Central American, and Cascadia Subduction Zones. Tsunamis can be highly directional, with a relatively narrow beam of focused energy that could propagate undetected through the network if tsunameters are too widely spaced. Tsunameter spacing of about 200–400 km is required to reliably assess the main energy beam of a tsunami generated by an M8 earthquake (Bernard et al., 2001); beam width decreases with earthquake and tsunami magnitude, with the consequent requirement that tsunameter spacing also be decreased. The length of known tsunamigenic zones in the Pacific is approximately 9000 km, so that the network needs to be expanded to at least 25–50 tsunameter stations.
(b) Develop ‘‘on-demand’’ event mode data delivery. Automatic hourly reports provide ‘‘tide mode’’ data with a 15-minute sampling interval that is capable of resolving low frequency signals with periods of a few hours or more, but not tsunamis. ‘‘Event mode’’ provides data with a 15- to 60-second sampling interval, capable of resolving waveforms in the tsunami period band. Currently, event mode data cannot be acquired by the Tsunami Warning Centers unless an on-board tsunami detection algorithm triggers data transmission. This occurs when a measured wave in the tsunami fre-quency band exceeds a threshold that is set by software, usually at 3 cm in amplitude (Mofjeld, 1997). The algorithm has performed well, but the dis-advantage of this approach is that a station may record an amplitude of less than 3 cm at the low-amplitude fringe of the main energy beam for a tsunami that is, in fact, large and destructive. The warning centers must receive and evaluate all tsunami observations, whether or not their amplitudes exceed 3 cm at a particular station. Such evaluations are essential during an event – it is clearly more desirable to cancel a warning based on real data, rather than on the absence of triggered data. During the early stages of tsunameter development, it was not possible to send a data delivery command through the satellite and acoustic communication links. Recent engineering advances have now made bi-directional satellite communications feasible. In June 2003, a prototype bi-directional tsunameter was deployed 200 nautical miles off the Oregon coast and has been reliably tripped into a high data rate mode from a desktop. Additional engineering development and the establishment
of systems to acquire Iridium data at Tsunami Warning Centers will be required before this system becomes operational.
(c) Increase deployment duration. Increasing the servicing interval will lower costs, especially ship time expenses, and reduce the network nance effort, thereby facilitating network expansion. The current mainte-nance cycle is about 1 year for the surface buoy and about 2 years for the ocean bottom unit. A reasonable goal is to lengthen these cycles to 2 and 4 years, respectively.
(d) Develop data interpretation and tsunami forecasting tools. Optimizing the operational value of the tsunameter network to provide accurate, reliable guidance to operational decision-makers requires implementation of a tsu-nami forecasting system that applies well-established methods for the inte-gration of real-time measurements and numerical modeling. By necessity, NTHMP resources were focused during the first 5 years of the program on the design, development, and testing of the tsunameter hardware and on the establishment of the Pacific network. The network must continue to be im-proved and expanded, but the NTHMP now requires a parallel effort to exploit and integrate the tsunameter data stream into an accurate, reliable, model-based forecast system to provide real-time predictions of tsunami impacts on threatened communities.
In short, the NTHMP is responding to identified needs by initiating and supporting two major efforts: the design, development, testing, and deploy-ment of an expanded network of the next-generation of tsunameters (Bernard
et al., 2001), and the implementation of a tsunami forecasting system to integrate real-time tsunameter data with numerical modeling technology (Titov et al., 2001; Titov and Gonzalez, 2002; Gonzalez et al., 2002; Gonzalez et al., 2005a; Titovet al., this issue).
Next-generation tsunameter design features include extended maintenance intervals of 2 years for the surface buoy and 4 years for the ocean bottom unit, and two-way communication via Iridium satellite telecommunications and acoustic modem for on-demand data delivery. The current network will be expanded to 10 next-generation tsunameter stations by 2008. This includes a tsunameter purchased by Chile, which was deployed on 23 November 2003 near 20S, 75W off the Chilean coast at a site approximately 4950 m deep. Other countries have expressed interest, but none have yet identified the funds needed to establish additional tsunameter stations. By far, the largest expense in establishing a new station and performing the necessary mainte-nance is ship time, which currently costs about $22K per day. In contrast, the hardware investment is relatively small – about $250K for a new system and $30K per year for maintenance – especially when compared to cable-based systems.
Tsunami forecasting tools will include several redundant methodologies for formal inversion of tsunameter data to produce model-based, site- and
event-specific predictions of coastal and inland wave height, inundation depth, and currents. Improvements will be made to the first, basic capability for coastal forecasts developed at WC/ATWC (Whitmore, 2003). More sophisticated methods that were developed at NOAA’s Center for Tsunami Inundation Mapping Efforts (Titov et al., this issue) and the University of Hawaii (Wei et al., 2003) will also be implemented. These forecast estimates will be produced and displayed in tabular and graphical form through a graphical user interface as part of the Short-term Inundation Forecast for Tsunamis (SIFT) system (Gonzalez et al., 2002). Current plans call for an improved coastal forecast capability to be implemented in 2004, followed by implementation of event- and site-specific inland forecast tools over the next few years.
4. The Proven Value
The NOAA tsunameter was developed in response to the high priority as-signed by the Pacific States to ‘‘... quickly confirm potentially destructive tsunamis and reduce false alarms’’ (Tsunami Hazard Mitigation Federal/ State Working Group, 1996). To this end, even without sophisticated focasting tools, the immediate value of the network is clear – tsunameter re-cords, especially those acquired directly seaward of the source, can help verify the existence or absence of destructive tsunami energy propagating toward distant communities. Since the network was established, its value has been demonstrated by a number of earthquake events with tsunamigenic potential.
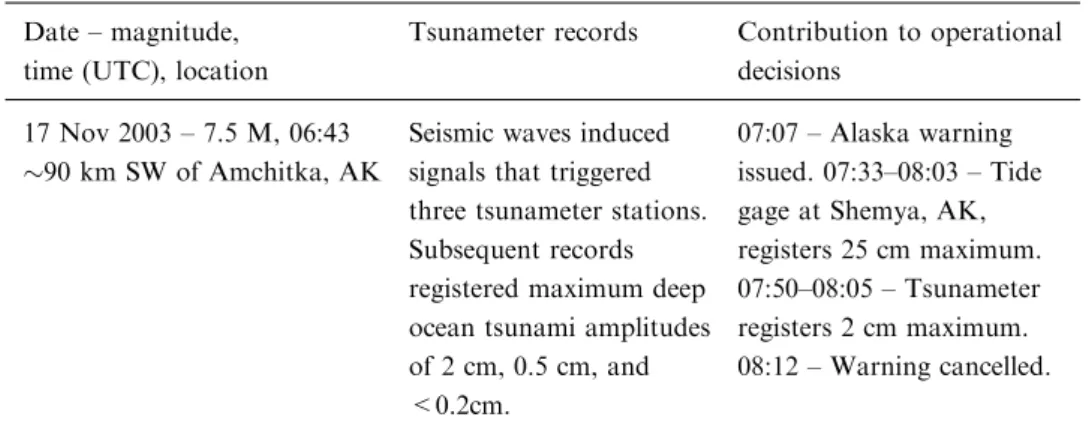
In particular, Table III summarizes six incidents in which tsunameter data have been of assistance in avoiding potential false alarms, including the most recent tsunamigenic earthquake occurrence, on 17 November 2003 at 06:43 UTC. In this case, a warning was issued for Alaska at 07:07, then cancelled at 08:12, shortly after a tsunameter registered a maximum deep-ocean tsunami amplitude of 2 cm (Titovet al., this issue). Costly and potentially hazardous evacuations of Alaskan and Hawaiian coastal communities were thereby averted.
A brief description of the important role of tsunameter data during the event on 11 July 2000, and an overall perspective and judgment on the value of the network has been provided by the Director of the Pacific Tsunami Warning Center (McCreery, 2001):
‘‘One of these gauges, off Kodiak Island, has already demonstrated its utility by triggering emergency transmissions following a magnitude 6.8 earthquake near Kodiak Island on 11 July 2000. PTWC was able to use these data to quickly confirm that no teletsunami had been generated
Table III. Tsumameter network contribution to operational decisions by NOAA’s Tsunami Warning Centers during potentially tsunamigenic events. ‘‘Seismic wave induced’’ signals occur when the ocean bottom pressure sensor is vertically accelerated by passage of the seismic wave
Date – magnitude, time (UTC), location
Tsunameter records Contribution to operational decisions 11 Jul 2000 – 6.5 M, 01:33 70 km SW of Kodiak, AK No tsunameters were triggered. Corroborative information for decision not to issue warning. Hawaii Dept. Emerg. Mgt. also requested and received information on tsumameter records (Yanagi, 2000). 10 Jan 2001 – 6.9 M, 16:03
110 km SW of Kodiak, AK
Seismic wave induced 3.2 cm signal that triggered tsunameter D157 at 16:11. Subsequent record was tsunami-free.
Tsunameter data allowed PTWC personnel to ‘‘. . .quickly confirm that potentially destructive tsunami waves were not propagating towards Hawaii or the rest of the Pacific’’ (Goldman, 2001). 5 May 2002 – 6.5 M, 05:37
160 km SW of Sand Point, AK
Seismic waves induced signals that triggered three tsunameter stations. Subsequent records were tsunami-free.
Corroborative information for decision not to issue warning.
3 Nov 2002 – 7.9 M, 22:13
145 km S of Fairbanks, AK
Seismic waves induced signals that triggered all six tsunameter stations. Subsequent records were tsunami-free.
Corroborative information for decision not to issue warning.
23 Jun 2003 – 7.1 M, 12:13 Near Rat Is., Aleutian Islands
No tsunameters were triggered.
The combination of no trigger at tsunameter D165 with a tsunami-free signal at the Adak coastal gauge, and exercise of the WC/ATWC forecast tool led to early cancellations of the WC/ATWC warning/ watch and PTWC Hawaii advisory (McCreery, 2003).
and thus there was no threat to Hawaii. Two more DART1gauges sited off the coast of Washington and Oregon would provide Hawaii with timely information about a Cascadia subduction zone event and also measure tsunami waves propagating toward Washington and Oregon from Alaska or even Japan. The sixth gauge, not yet deployed, will go along the equator in the eastern Pacific to provide readings of tsunamis generated in South America as they head toward Hawaii and the West Coast. This gauge would have been useful for more quickly evaluating long range destructive potential of the 23 June 2001 tsunami from Peru. The ultimate utility of the DART gauges won’t be realized, however, until their data is incorporated into a tsunami forecasting scheme based on data from numerical tsunami simulations. It is expected that the use of this data, described in more detail below, will lead to a reduction in unnecessary warnings and evacuations and provide better forecasts for levels of tsunami severity.’’
As this statement notes, the operational value of the tsunameter network will continue to increase as network coverage expands, as warning centers con-tinue to integrate tsunameter network data into their real-time data stream, as SIFT forecast guidance tools continue to be implemented, and as warning center personnel continue to familiarize themselves with and gain confidence in both the tsunameter data and the forecast guidance system.
5. Summary and Conclusions
The NOAA-led U.S. National Tsunami Hazard Mitigation Program has established a tsunameter network in the Pacific operated by NDBC, Table III. Continued
Date – magnitude, time (UTC), location
Tsunameter records Contribution to operational decisions
17 Nov 2003 – 7.5 M, 06:43
90 km SW of Amchitka, AK
Seismic waves induced signals that triggered three tsunameter stations. Subsequent records registered maximum deep ocean tsunami amplitudes of 2 cm, 0.5 cm, and <0.2cm.
07:07 – Alaska warning issued. 07:33–08:03 – Tide gage at Shemya, AK, registers 25 cm maximum. 07:50–08:05 – Tsunameter registers 2 cm maximum. 08:12 – Warning cancelled.
1
consisting of six deep-ocean stations located seaward of known tsunamigenic zones. This major engineering accomplishment responds to a State-driven priority for the Warning Guidance component of the NTHMP – i.e., increase the accuracy and reliability of tsunami warnings, to ‘‘... quickly confirm potentially destructive tsunamis and reduce false alarms.’’ The network is reliable and the real-time data stream has proven its value to warning center decision-makers during a number of potentially tsunamigenic events. Net-work improvements are underway – netNet-work stations will be increased from the current six to ten by 2008, implementation of real-time tsunami fore-casting tools is proceeding, and a next-generation tsunameter is under development that features on-demand data delivery and increased deploy-ment duration and maintenance cycles.
International participation is now needed to speed up expansion and create a global tsunameter network. This network will transform and accelerate ad-vances in tsunami research and hazard mitigation, much as the global seis-mometer network has had a dramatic impact on the field of seismology. Research aided by tsunameter data includes such basic issues as the degree of nonlinearity, dispersion, and scattering in the deep ocean. Research on the highly nonlinear dynamics of inundation will also benefit. This follows from the specification of more accurate initial conditions for these nonlinear models through both direct tsunameter measurements and improved deep ocean theory; in turn, more accurate initial conditions will help isolate and study the physics of the inundation process to explain discrepancies between observed and simulated runup. Finally, research on tsunami generation will be greatly aided by the acquisition of more near-source tsunameter records. All such research, of course, will improve hazard mitigation programs and products developed by two important components of the NTHMP – Hazard Assess-ment (Gonzalezet al., 2005b), and Warning Guidance (Titovet al., this issue). Japan has deployed real-time reporting BPRs off its coast, using under-water cable technology for power and data transmission (Hirataet al., 2002). This cable approach is effective, but initial costs are prohibitively high (tens of millions of dollars), maintenance and repair is difficult and expensive, and the systems are not easily re-located if required by a change in priorities and/ or scientific understanding of tsunami risk. Chile, with more than 6,000 km of coastline that abuts the South American Subduction Zone (SASZ), is the first country to purchase a NOAA tsunameter, and has now established the first of several planned offshore stations. If a tsunami is generated near a station, it will be detected before it reaches communities at distant points on the long Chilean coast, providing early information and a few extra minutes of warning time that can be critical to reducing fatalities. Furthermore, the station will continue to monitor offshore tsunami activity for the duration of an event, allowing continual assessment of the hazard to coastal residents and, again, reducing casualties. Indeed, all Pacific Rim nations will benefit
from the tsunameter station established and maintained by Chile that will enable the early detection, direct measurement, and assessment of the hazard posed to their coastal communities.
More generally, the investment of any nation in tsunameter stations will benefit both itself and other coastal nations that border a common sea or oceanic basin. Additional benefits related to climate and weather could also be realized, with modification of the tsunameter system to provide a platform for meteorological and oceanographic instrumentation. In summary, the mutually beneficial nature of national efforts and investments in a global tsunameter network provides a solid rationale for an internationally coop-erative and coordinated program to make such a network a reality.
Acknowledgements
We express our appreciation to the numerous individuals that participated in and contributed to the tsunameter development enterprise, including PMEL engineers, technicians, and scientists, and more than 85 partner firms and suppliers. Cheryl Demers, NDBC, provided the tsunameter network statistics presented in Table II. Ryan Whitney prepared the final manuscript. This work was jointly supported by NOAA and the NTHMP, and is PMEL contribution number 2673.
References
Bernard, E. N.: 1991, Assessment of Project THRUST: Past, present, future. Special Issue on Tsunami Hazard (E.N. Bernard, ed.),Nat. Hazards4(2,3), 285–292.
Bernard, E. N., Behn, R. R., Hebenstreit, G. T., Gonzalez, F. I., Krumpe, P., Lander, J. F., Lorca, E., McManamon, P. M., and Milburn, H. B.: 1988, On mitigating rapid onset natural disasters: Project THRUST (Tsunami Hazards Reduction Utilizing Systems Technology).Eos, Trans. AGU69(24), 649–661.
Bernard, E. N., Gonzalez, F. I., Meinig, C., and Milburn, H. B.: 2001, Early detection and real-time reporting of deep-ocean tsunamis. In:Proceedings of the International Tsunami Symposium 2001 (ITS 2001)(on CD-ROM), NTHMP Review Session, R-6, Seattle, WA, 7–10 August 2001, pp. 97–108. http://www.pmel.noaa.gov/its2001/.
Eble, M. C. and Gonzalez, F. I.: 1991, Deep-ocean bottom pressure measurements in the northeast Pacific.J. Atmos. Ocean. Tech.8(2), 221–233.
Goldman, J.: 2001, NOAA Tsunami Buoy ‘‘Feels’’ Alaska Earthquake. http://www.noaa. news.noaa.gov/stories/s560.htm.
Gonzalez, F. I., Mader, C. L., Eble, M., and Bernard, E. N.: 1991, The 1987–88 Alaskan Bight Tsunamis: Deep ocean data and model comparisons.Nat. Hazards4(2,3), 119–139. Gonzalez, F. I., Milburn, H. M., Bernard, E. N., and Newman, J.: 1998, Deep-ocean
Proceedings of the International Workshop on Tsunami Disaster Mitigation. Tokyo, Japan, pp. 118–129.
Gonzalez, F. I., Titov, V., Mofjeld, H. O., and Newman, J. C.: 2002, Project SIFT (Short-term Inundation Forecasting for Tsunamis). In:Underwater Ground Failures on Tsunami Gen-eration, Modeling, Risk and Mitigation. Istanbul, Turkey, pp. 221–226.
Gonzalez, F. I., Titov, V. V., Mofjeld, H. O., Venturato, A., Simmons, S., Hansen, R., Combellick, R., Eisner, R., Hoirup, D., Yanagi, B., Young, S., Darienzo, M., Priest, G., Crawford, G., and Walsh, T.: 2005b, Progress in NTHMP Hazard Assessment. Nat. Hazards35, 89–110 (this issue).
Gonzalez, F., Burwell, D., Cheung, K. F., McCreery, C., Mofjeld, H., Titov, V., and Whitmore, P.: 2005a, Far-field tsunami forecast guidance. NOAA Tech. Memo. OAR PMEL, NOAA/PMEL (in preparation).
Hawaii Research and Economic Analysis Division, Department of Business, Economic Development and Tourism: 1996, Methodology for Estimating the Economic Loss of a Tsunami False Alert. Attachment to May 22, 1996 Memorandum from P.I. Iboshi to R.C. Price on ‘‘Tsunami Alert Economic Loss Estimation,’’ 6 pp., with 3 Tables.
Hayes, S. P., Mangum, L. J., Sumi, J. P. A., and Takeuchi, K.: 1991, TOGA-TAO: A moored array for real-time measurements in the tropical Pacific Ocean.Bull. Am. Meteorol. Soc.
72(3), 339–347.
Hirata, K., Aoyagi, M., Mikada, H., Kawaguchi, K., Kaiho, Y., Iwase, R., Morita, S., Fujisawa, I., Sugioka, H., Mitsuzawa, K., Suyehiro, K., Kinoshita, H., and Fujiwara, N.: 2002, Real-time geophysical measurements on the deep seafloor using submarine cable in the southern Kurile subduction zone.IEEE J. Oceanic Eng.27(2), 170–181.
McCreery, C. S.: 2001, Impact of the National Tsunami Hazard Mitigation Program on operations of the Pacific Tsunami Warning Center. In: Proceedings of the International Tsunami Symposium 2001 (ITS 2001) (on CD-ROM), NTHMP Review Session, R-7, Seattle, WA, 7–10 August 2001, pp. 109–117. http://www.pmel.noaa.gov/its2001/. McCreery, C.: 2003, Personal e-mail communication to E. Bernard on June 23, 2003. McPhaden, M. J.: 1993, TOGA-TAO and the 1991–92 El Nin˜o/Southern Oscillation event.
Oceanography6(2), 36–44.
McPhaden, M. J.: 1995, The tropical atmosphere ocean array is completed.Bull. Am. Mete-orol. Soc.76, 739–741.
McPhaden, M. J., Busalacchi, A. J., Cheney, R., Donguy, J., Gage, K. S., Halpern, D., Ji, M., Julian, P., Meyers, G., Mitchum, G. T., Niiler, P. P., Picaut, J., Reynolds, R. W., Smith, N., and Takeuchi, K.: 1998, The Tropical Ocean Global Atmosphere observing system: A decade of progress.J. Geophys. Res.103(C7), 14169–14240.
Meinig, C., Eble, M. C., and Stalin, S. E.: 2001, System development and performance of the Deep-ocean Assessment and Reporting of Tsunamis (DART) system from 1997–2001. In: Proceedings of the International Tsunami Symposium 2001 (ITS 2001) (on CD-ROM), NTHMP Review Session, R-24, Seattle, WA, 7–10 August 2001, pp. 235–242. http:// www.pmel.noaa.gov/its2001/.
Milburn, H. B., Nakamura, A. I., and Gonzalez, F. I.: 1996, Real-time tsunami reporting from the deep ocean. In:Proceedings of the Oceans 96 MTS/IEEE Conference, Fort Lauderdale, FL, pp. 390–394.
Mofjeld, H. O.: 1997, Tsunami Detection Algorithm. http://www.pmel.noaa.gov/tsunami/ tda_documentation.html.
Titov, V. V. and Gonzalez, F. I.: 2002, Modeling solutions for short-term inundation forecasting for tsunamis. In: Underwater Ground Failures on Tsunami Generation, Modeling, Risk and Mitigation, NATO Advanced Workshop. Istanbul, Turkey, pp. 227–230.
Titov, V. V., Gonzalez, F. I., Mofjeld, H. O., and Newman, J. C.: 2001, Project SIFT (Short-term Inundation Forecasting for Tsunamis). In:Proceedings of the International Tsunami Symposium 2001 (ITS 2001)(on CD-ROM), Session 7–2, Seattle, WA, 7–10 August 2001, pp. 715–721. http://www.pmel.noaa.gov/its2001/.
Titov, V. V., Gonzalez, F. I., Eble, M. C., Mofjeld, H. O., Newman, J. C., and Venturato, A. J.: 2005, Real-time tsunami forecasting: Challenges and solutions. Nat. Hazards 35, 41–58 (this issue).
Tsunami Hazard Mitigation Federal/State Working Group: 1996, Tsunami Hazard Mitiga-tion ImplementaMitiga-tion Plan – A Report to the Senate AppropriaMitiga-tions Committee. PDF download at http://www.pmel.noaa.gov/tsunami-hazard/, 22 pp., Appendices.
Wei, Y., Cheung, K. F., Curtis, G. D., and McCreery, C. S.: 2003, Inverse algorithm for tsunami forecasts.J. Waterw. Port Coast. Ocean Eng.129(3), 60–69.
Whitmore, P. M.: 2003, Tsunami amplitude prediction during events: A test based on previous tsunamis. In:Science of Tsunami Hazards, Vol. 21. pp. 135–143.