Soil Loss Estimation Using GIS and Remote Sensing Techniques:
The Case of Debis Watershed, Blue Nile Basin Ethiopia
Abebe Senamaw Kebede
Department of Disaster Risk Management and Sustainable Development, ICDS, Ambo University, P.O. Box 19 ,Ambo Ethiopia
Abstract
Soil erosion is one of the pressingproblems in highland of Ethiopia. To reduce this problem estimating amount of soil at watershed level is necessary. However, in Ethiopia area specific up to date information in many catchments (watershed) is still found to be lacking. Therefore, this research was carried out to spatially estimate the soil loss rate of Debiswatershed with a Geographic Information System (GIS) and Remote Sensing (RS)technique. Revised Universal Soil Loss Equation (RUSLE) adapted to Ethiopian conditions was used to estimate potential soil losses by utilizing information on rainfall erosivity(R) using interpolation of rainfall data, soil erodibility(K) using soil map, vegetation cover (C) using satellite images, topography (LS) using Digital Elevation Model (DEM) and conservation practices (P ) using satellite images. Result from analysis shows that soil erosion risk differs spatially in the study area because of its rugged topography, geomorphology, landform, soil types, land cover, and land use. The spatial locations of the high spot area for soil erosion in the study revealed that the potential soil loss is typically greater along the steeper slope banks of tributaries. Based on the level of soil erosion rates, the study area was divided into five priority categories for conservation interventions. About 51% (229 sqr.km) of the watershed was categorized none to slight class values ranging from 0.5 to 10 tons ha-1yr-1. The remaining 49 % (1376.48 ha) of land was classified under moderate to high class, which is greater than the maximum tolerable soil loss (11 tons ha-1 y-1).Thus, governmental,non-governmental organization and community found in watershed should focus on applying soil and water conservation intervention which helps to reduce the problem.
Keywords: Debis, Soil erosion, RUSLE, Remote sensing, GIS ,Watershed
1. INTRODUCTION
Land degradation is the major problem in world (Srinivasarao et al., 2014). Soil erosion, nutrient depletion, loss of biodiversity, loss of organic matter, loss of water, acidification and soil salinization are the manifestation of land degradation. Soil is akey component ofthe Earth System that control the bio-geo-chemical and hydrological cycles and also offers to the human societies many resources, goods and services (Keesstra et al., 2012; Berendse et al., 2015).However, there is high soil erosion in East Africa that shown high rate of loss in Ethiopia (Gessesse et al., 2014). Studies done in different part of Ethiopia shown that there is high rate of soil loss in which there is spatial temporal variation. The problem isseverin highland of Ethiopia (Nyseen et al. 2004; Abate, 2011; Gete, 2000). The highland of Ethiopia, annual soil reaches up to 200 – 300 ton per hectare, making the total loss 23, 400 million ton per year(FAO, 1986). The average soil loss rate at watershed level is 9.63 tons ha-1 y-1 about half of the maximum tolerable soil loss in Medego Watershed, Northern Ethiopia(Gebreyesus and Kirubel,2009).
The soil loss rate by water rangesfrom 16 to over 300Mg/ ha/yr in Ethiopia mainly depends on topography, of rainfall intensity, soil loss control practiced and land cover(Tamrie, 1995; Tesfaye et al., 2014).The highest soil loss at Medego watershed was recorded at the landform steep mountains (slope 30–50 %), which is estimated 35.4 Mgh−1 yr− (Gebreyesus and Kirubel ,2009). According to the author in Medego Watershed the lowest soil loss is estimated on flat plains (< 2% slope) about 1.59 tons ha-1 y-1, which is less than the minimum tolerable soil loss (2 tons ha-1 y-1) for the country. Soil losses ranged from 0 in plain areas to 237 t ha−1 year−1 in the steep slope areas in Geleda watershed northwestern highlands of Ethiopia (Temesgen, Taffa and Mekuria , 2017).Similarly Tadesse and Abebe(2014)confirm that 504.6 t/ha/yr of soil loss was estimated in Jabi Tehinan woreda in steeply sloping mountain area of the catchment.
Although there are many factors influence on soil erosion, plant cover and land use have been considered as the most important factors affecting on the intensity of soil erosion (Lehet al., 2011). Due to uncontrolled and unmanageable interface of people to the land, worldwide 80% of agricultural land suffers from moderate to severeerosion. Estimated average soil loss from croplands in the highlands of Ethiopia as a whole at 100 metric tons ha-1 year-1 (Mati, Morgan, Gichuki, Quinton, Brewer and Liniger, 2000). In support of this idea Hurni et al. (2008) estimated that soil loss due to erosion of cultivated fields in Ethiopia amounts to about 42 metric tons ha-1yr-1. 130- 170 t/ha/yr of soil was loss from cultivated land in north western highland of Ethiopia.
Despite the severity of soil erosion in Ethiopia watershed, there have been few studies carried out to quantify erosion rates. This implies that there is a need to have watershed specific information on soil erosion to support timely information for decision makers and land managers that plan the correct soil conservation
planning (Gizachew and Yihenew. 2015). Severalresearches were conducted in and around Debis watershed but none of them have estimate soil loss problem using RUSLE. Thus, objective of this paper is to quantify and map an estimated soil loss using RUSLE within a GIS environment and identify severity areas for specific soil conservation plans. Based on the RUSLE model, the amount of soil loss can be determined by the multiplication of six factors including climate, soil property, topography, land cover and conservation practice(Wischmeier and Smith,1978).
2. MATERILAS AND METHOD
2.1. Description of study area
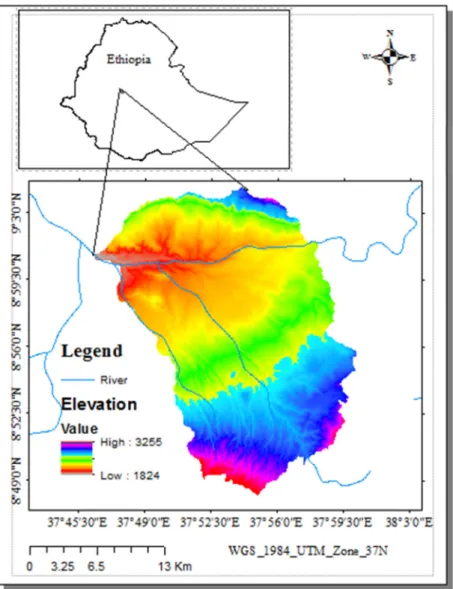
The Debiswatershed is located in West-Shewa Zone, Oromia Regional State, Ethiopia. It is located between 8°47' N - 9°21’North latitude and 37° 32' E -38° 3' East longitude (Figure 1).
The watershed has a mean annual temperature ranging between 23-25°C and a mean annual rainfall of 1300-1700mm (NMSA, 2015). The altitudinal range of the agro-climatic zones in the watershed fall between 1875 and 3,202 masl. It covers an area of 45,414.4ha. Eutriccambisols,
Eutricnitisols, pellicvertisols ,chromic vertisols ,Chromic luvisols and Orthicluvisolsarea the dominate soil class found in the watershed(FAO, 1997).
Figure 1. Location map of study area 2.2. Data source and type of data used
The research have beenused both primary and secondary data. Secondary data(satellite image, metrological data,and soil data) were collected from different organizations (Table 1). To generate primary information regarding the ground truth for image classification and soil loss vulnerability verificationfrequent field observation usingGPS were conducted.
RUSLE models are the most effective ways to predict soil erosion processes and their effects by using Geographic Information System (GIS) and remote sensing (RS) tools (Bayraminet al., 2003). GIS and RS analysis could help analyze land degradation mainly soil erosion in speedy and accurate way. Through processing these sources and building geo-database, integration, analysis and modeling works were carried out using RS and GIS software (Table1).
Table 1. Data Inputs, Sources & Tools used for Analysis
Input Data Types Sources Tools for analysis
Climate data (RF data of 13 stations ) NMAE Arc GIS 10.2, Microsoft excel
Soil data (FAO digital soil map ) MoEMIE ARC GIS 10.5
DEM SRTEM ARCGIS 10.5
Satellite image (Landsat 8 OLI/TIRS of 2017 ) USGS webpage ERDAS IMAGIN 2014,ARCGIS 10.5
Google Earth Google Earth ARCGIS 10.5/
2.3. Method
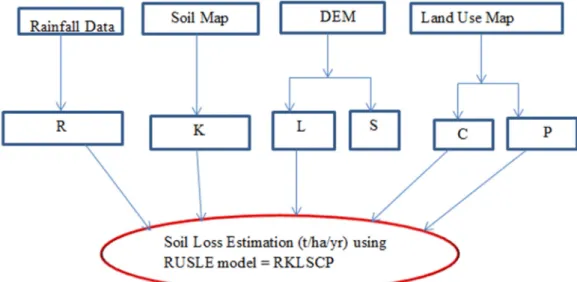
In this study RUSLE in GIS environment was carried out. Debiswatershed wasdelineated from SRTEM DEM 90m resolution raster data. RUSLE requires fivefactors this are R factor, K factor, LS factor, C factor and P factor this are obtained from metrological station, soil map, and remote sensing data. Annual soil loss rate was determined by multiplying the respective RUSLE factor values interactively using “Spatial Analyst Tool Map Algebra Raster Calculator” in ArcGIS 10.5 environment as shown equation (1) adopted from the recommendations of Hurni (1985).
A= LS* R* K* C* P ……… Equation (1)
Where A is the annual soil loss (metric tons ha-1 year-1); R is the rainfall erosivity factor [MJ mm h-1 ha- 1 year-1]; K is soil erodibility factor [metric tons ha-1 MJ –1 mm-1]; LS = slope length factor (dimensionless); C is land cover and management factor (dimensionless) and P is conservation practice factor (dimensionless). General methodology adopted in the study is shown in (Figure 2)
Figure 2:Summery of general methodology employed to estimate soil loss by RUSLE 3. Result and Discussion
3.1. Determination of Soil Loss Factors
Geographic information system (GIS) and Remote sensing techniques integrated with RUSLE model to conducted cell by cell calculation of mean annual soil loss rate and to identify and map soil erosion risk area. Raster map of each RUSLE parameters derived from different data source were produced and discussed as follows.
3.1.1.Rainfall Erosivity Factor(R)
Rainfall erosivity depends on amount of intensity and distribution of rainfall. The erosivity factor of rainfall (R) is a function of the falling raindrop and the rainfall intensity, and is the product of kinetic energy of the raindrop and the 30-minute maximum rainfall intensity (Pandey et al., 2007). But in Ethiopia condition the R-value corresponds to the mean annual rainfall of the watershed was found using the R-correlation established by Hurni (1985).
R= -8.12 + 0.562*P --- Equation (1) Where R is the rainfall erosivity factor and P is the mean annual precipitation (mm).
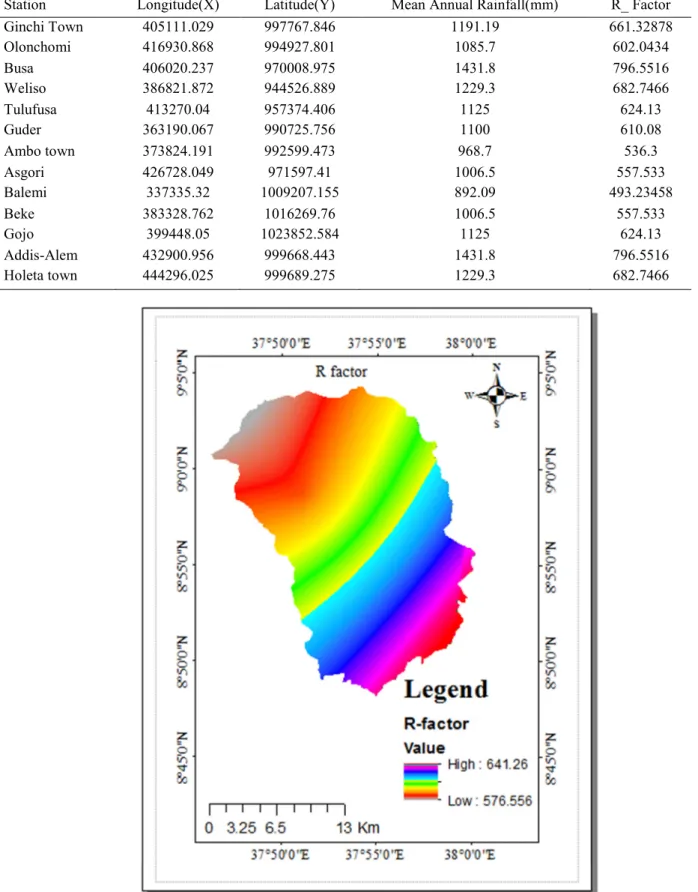
To compute R factor, mean annual rainfalls of 15 years were collected from 13 metrological stations were taken from neighboring Woreda (Table 2). After calculating average 15 years of rainfall for each station, the R factor was computed using the above formula and converted in to raster surface “3D Analyst Tools Raster Kriging Interpolation “method in ArcGIS software 10.5(Figure 3).
Table 2.Mean annual rainfall and erosivity factor(R)result
Station Longitude(X) Latitude(Y) Mean Annual Rainfall(mm) R_ Factor
Ginchi Town 405111.029 997767.846 1191.19 661.32878 Olonchomi 416930.868 994927.801 1085.7 602.0434 Busa 406020.237 970008.975 1431.8 796.5516 Weliso 386821.872 944526.889 1229.3 682.7466 Tulufusa 413270.04 957374.406 1125 624.13 Guder 363190.067 990725.756 1100 610.08 Ambo town 373824.191 992599.473 968.7 536.3 Asgori 426728.049 971597.41 1006.5 557.533 Balemi 337335.32 1009207.155 892.09 493.23458 Beke 383328.762 1016269.76 1006.5 557.533 Gojo 399448.05 1023852.584 1125 624.13 Addis-Alem 432900.956 999668.443 1431.8 796.5516 Holeta town 444296.025 999689.275 1229.3 682.7466
3.1.2. Soil Erodibility (K) factor
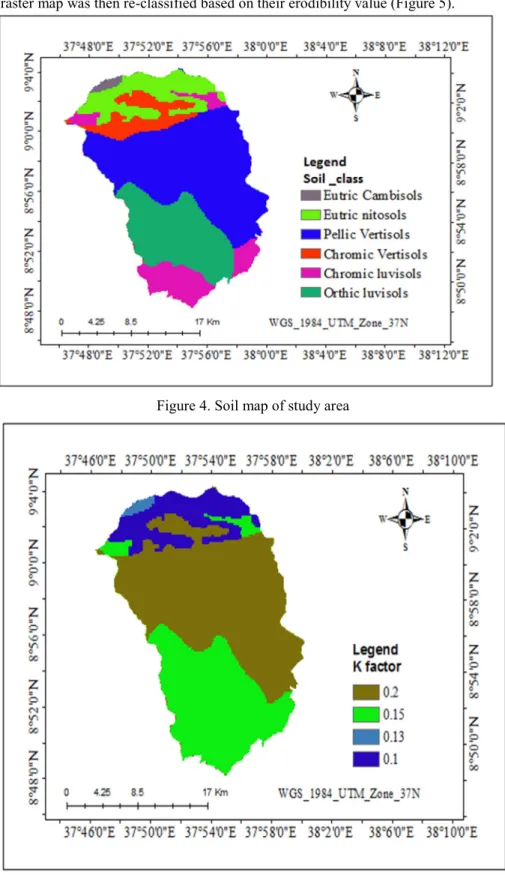
Soil erodibility help to evaluate the soil vulnerability to erosion. Soil erodability factor (K) is defined as mean annual rainfall soil loss per unit of R for a standard condition of bare soil, recently tilled up-and-down on a slope with no conservation practices and on a slope of 5 and 22m length (Morgan, 1994).The soil erodibility (K) factor for the watershed was estimated based on soil unit types referredfrom soil database adapted to Ethiopia by Hurni (1985) and Hellden (1987) (Figure 4).Finally, the shape file results were changed to a raster with a cell size of 30x30 m. The raster map was then re-classified based on their erodibility value (Figure 5).
Figure 4. Soil map of study area
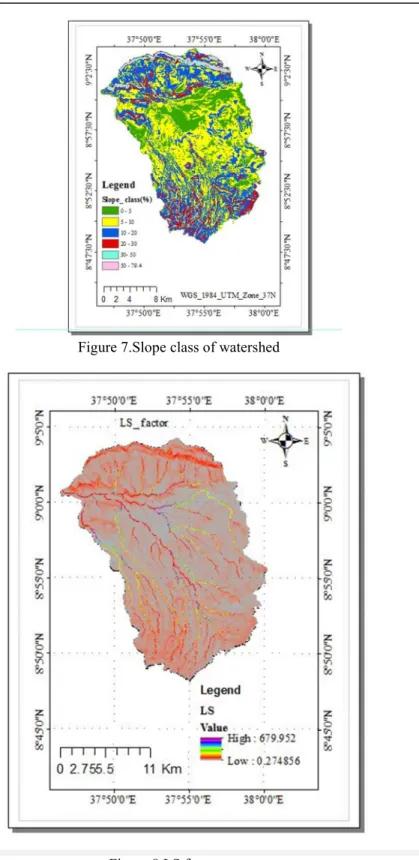
3.1.3. Topographic Erosivity (LS Factor)
The slope length factor (L) and slope steepness factor (S) mainly reflect the effect of topography on erosion (Yildirim, 2012). Slope length is defined as the distance from the point of origin of overland flow to the point where either the slope gradient decreases enough that deposition begins or the runoff water enters a well-defined channel that may be part of a drainage network. Soil erosion by water also increases as the slope length increases due to the greater accumulation of runoff.
Slope steepness has been considered as one of the most model parameters in RUSLE analysis due to the fact that the steeper the slope of a field, the more it is pushed down hill, the faster the water runs and the greater will be the amount of soil loss from erosion by water. The slope length and slope steepness factors are commonly combined in a single index as LS and referred to as the topographic factor.
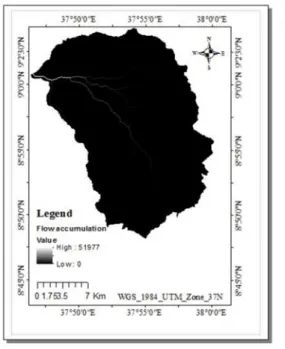
Flow accumulation and slope maps were multiplied by using “Spatial Analyst Tool Map Algebra Raster Calculator” to calculate and map the slope length (LS factor) recommended by Gizachew (2015 ) as shown in Equation (2) and Equation (3).
L = 0.799 +0.0101*Flow Accumulation ---Equation (2) S = 0.344 + 0.0798*Slope ---Equation (3)
Where, L and S stand for slope length and steepness factor
After determining the L and S for each grid cell, the LS factor was then determined by multiplying the L and S values in ArcGIS10.5 and a map of the LS factor was producedin ArcGIS spatial analysis raster calculator function (Figure 8).
Figure 7.Slope class of watershed
Figure 8.LS factor map 3.2.4. Crop management (C) factor
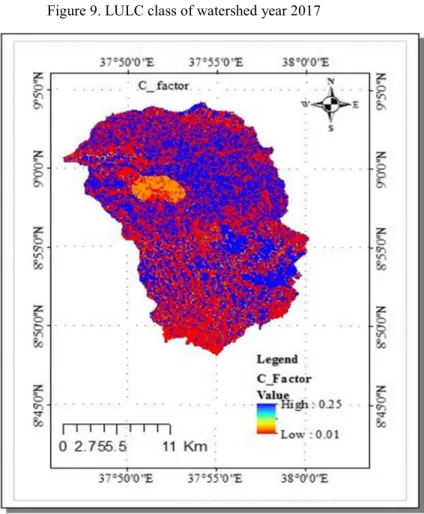
The crop management factor represents the ratio of soil loss under a given crop to that of the bare soil (Morgan, 1994). In this research, the land use land cover is the variable to show its potential impact on soil erosion. A land use and land cover of year 2017, which was prepared from LANDSAT 8 OLI/TIRS through supervised digital image classification technique using ERDAS 2014 was used as an input for generating crop management (C) factor . As shown in (Figure 9) six land use land cover class were recognized currently in the watershed. The raster land use/land cover map was converted to a vector format and a corresponding C-value was assigned to each land use classes based on cover values proposed by Hurni1985 as coated by Samuel (2007) and A. Adugna, A. Abegaz, and A. Cerdà (2015) (Table 3). Finally, using reclassification and vector to raster conversion the land use/ land cover map was converted to C factor map (Figure 10).
Table 3.Crop management (C) factor
LULC class C-factor
Grass land 0.01
Forest land 0.01
Cultivated land 0.25
Builtup area 0.05
Bush shrub land 0.01
Bare land 0.05
Figure 9. LULC class of watershed year 2017
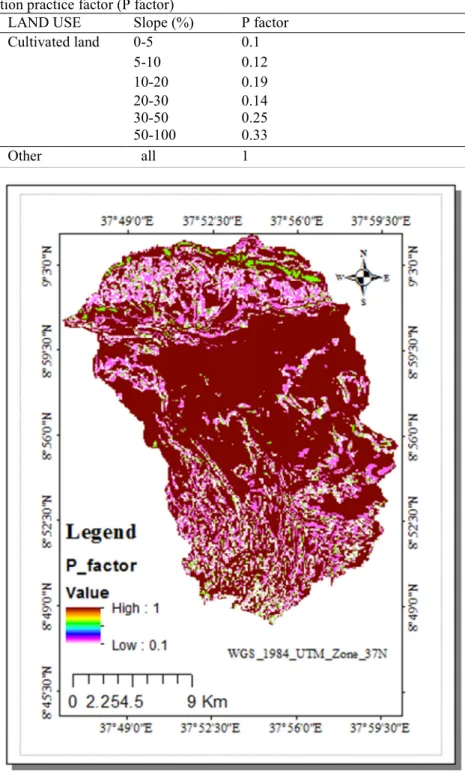
3.1.5.Conservation Practice factor (P factor)
The conservation practices factor (p-values) reflects the effects of practices that will reduce the amount and rate of the water runoff and thus reduce the amount of erosion. Since, there was limitation of data on permanent management factor in study area weuse the P value suggested by Wischmeir and Smith (1978). According to the author P value was calculated by delineating the land in to two major land uses, agricultural land and other land. The agricultural land sub-divided in to six classes based on the slope percent to assign different P-values (Table 4). In this study, the same technique was employed to assign the P-value of the watershed (Figure 11). The p-value of the watershed ranges from 0.1 to 1 (Figure 11).
Table 4. Conservation practice factor (P factor)
LAND USE Slope (%) P factor Cultivated land 0-5 0.1 5-10 0.12 10-20 0.19 20-30 0.14 30-50 0.25 50-100 0.33 Other all 1
Figure 11. Conservation practice factor map of watershed 3.2. Soil Loss Estimation
Soil erosion risk differs spatially in the study area because of its rugged topography, geomorphology, landform, soil types, land cover, and land use. Based on analysis in Debis watershed there is high rate of soil erosion which
was categorized in to six classes. This class was recognized because of presence of intensity different in soil erosion factors. Area which cover 51% (229 sqr.km)of the watershed have low soil erosion which indicated half of the area has low soil erosion while 49% (218.9sqr.km) of the watershed has sever to moderate soil erosion. The spatial locations of the high spot area for soil erosion in the study revealed that the potential soil loss is typically greater along the steeper slope banks of tributaries. Other high soil erosion areas are distributed throughout the watershed. Moderate to severesoil erosion areas are also concentrated in the cultivated hilly area of watershedAs shown in (figure 12 )and (Table 5)49 % (1376.48 ha) of land was under moderate to high class which is greater than the maximum tolerable soil loss (11 tons ha-1 yr-1). The result of this study was consistence with the finding ofTadesse and Abebe(2014) who reported that there is high soil loss rate at steep slope of JabiTehinanWoreda,Ethiopia.According to an estimate by FAO (1986), some 50% of the highlands of Ethiopia are already ‘significantly eroded. About 43% (537,000 km2) of the total highland areas of Ethiopia are highly affected by soil erosion with an estimated average of 20 t ha−1 yr−1 and measured amounts of more than 300 t ha−1 yr−1 on specific plots (Hurni, 1990; Paulos, 2001). In line with this empirical studies conducted by Belay (2002) in Gununoarea revealed that the rate of soil loss from cultivated land was 64 t ha-1 yr-1. The experiments conducted by Soil Conservation and Research Project in six fields in different agro-ecologies of Ethiopia (namely, Maybar, Hundelafto, AnditTid, Anjeleni and Dezi) reported the average annual soil loss of 42 t ha-1 yr-1 from cultivated land (Hurni, 1990).Thus, the estimated soil loss rate was generally realistic as compared to results from previous studies in other areas.
Table 5. Soil loss summery of watershed
Soil loss class(t/ha/yr) Degree Area(sqr.km)
0.49 - 10 Low 229.0
10- 20 Moderate 46.6
20 - 30 high 148.3
30- 50 Very high 20.8
50-186.1 Severe 3.2
Conclusion
This study demonstrates the RUSLE together with GIS which provides a great advantage to analyze multi-layer data of spatially. The spatial distribution of soil loss data could facilitate sustainable land management for Debsis watershed. Thesoil loss estimation was carried out based on the principles of the Revised Universal soil loss Equation (RUSLE). The RUSLE model defines annual soil loss as a product of six main factors: rainfall Erosivity (R factor), soil erodibility(K factor), slope length and gradient (LS factor), land cover (C factor) and conservation practices (P factor).the result shows that there is high soil erosion in watershed which range from 0.49 to 186t/ha/yr which varies spatially Based on the level of soil erosion rates, the study area was divided into five priority categories for conservation interventions. About 51% (229 sqr.km) of the watershed was categorized none to slight class values ranging from 0.5 to 10 tons ha-1yr-1. The remaining 49 % (1376.48 ha) of land was classified under moderate to high class, which is greater than the maximum tolerable soil loss (11 tons ha-1 y-1). Based on this finding in Debis watershed areas which were characterized by high to sever soil loss should be given special priority to reduce or control the rate of soil erosion. On the other hand, areas which has moderate erosion hazard should be given high attention to protect them from further erosion through plantations. Authors’ contributions
The research project idea was conceived by Mr. AbebeSenamaw. He actively participated in the design of the study, carried out the data collection, and undertook the GIS and Remote sensing-based data analysis. More importantly, he conducted the full write-up of the research report and organized the manuscript for publication. Author detail
Mr. AbebeSenamawis Lecturer in the Department of Disaster Risk Management and Sustainable Development, Institute of Cooperatives and Development Studies, Ambo University Ethiopia, P.O.box 19 Ambo, Ethiopia. Acknowledgement
The authors are grateful to Ambo University for the financial and operational support to conduct this study.
Debiswatershed community also deserves appreciation for their kind response to any requested information. Competing interests
The authors declare that they have no competing interests. REFERENCE
Abate, S.,2011. Estimating soil loss rates for soil conservation planning in the BorenaWoreda of South Wollo highlands, Ethiopia.Journal of Sustainable Development in Africa, 13, 87–106.
Adugna, A. Abegaz, and A. Cerdà .,2015. Soil erosion assessment and control in Northeast Wollega, Ethiopia; Solid Earth Discuss., 7, 3511–3540,
Bayramin, I., O. Dengiz., O. Baskan and M. Parlak., 2003. Soil Erosion Risk Assessment with ICONA Model; Case Study: Beypazari Area. Turk Journal of Agriculture andForestry.27
Belay T.,2002. Farmers Perceptions of Erosion Hazards and Attitudes Towards Soil Conservation in Gunino Area, Wolayta, Southern Ethiopia, Ethiopian. Journals of Development Research, 14(2), 31-35
Berendse, F., van Ruijven, J., Jongejans, E., and Keesstra, S. D., 2015. Loss of plant species diversity reduces soil erosion resistance of embankments that are crucial for the safety of human societies in low-lying areas, Ecosystems, 18, 881–888, doi:10.1007/s10021-015-9869-6,
FAO .1986.Ethiopian highlands reclamation study, Ethiopia.Final Report. Rome, FAO
FAO .1997. The digital soil and terrain database of East Africa (SEA): notes on the Arc/info files, Version 1.0. Land and Water Development Division, Food and Agriculture Organization (FAO), Rome
Gebreyesus B, Kirubel M.,2009. Estimating soil loss using Universal Soil Loss Equation (USLE) for soil conservation planning at Medego Watershed, Northern Ethiopia.Journal of American science 5(1):58–69
Gessesse, B., Bewket, W., and Bräuning, A.,2014. Model-based characterization and monitoring of runoff and soil erosion in response to land use/land cover changes in the Modjo watershed, Ethiopia, Land Degrad. Dev., 26, 711–724, doi:10.1002/ldr.2276,
Gete Z. , 2000. Landscape dynamics and soil erosion process modeling in the North-Western Ethiopian highlands. African Studies Series A16. GeographicaBernensia, Berne
GizachewA. ,2015.A Geographic Information System based Soil Loss Estimation in Lalen Watershed for Soil Conservation Planning, Highlands of Ethiopia; Journal of Dynamics in Agricultural Research Vol. 2(3), pp.31-39,
Gizachew A. andYihenew G., 2015. Soil Loss Estimation for Soil Conservation Planning using Geographic Information System in Guang Watershed, Blue Nile Basin.Journal of Environment and Earth Science
Hurni H., Solomon A., Amare B., Berhanu D., Eva L, Brigitte P., Birru Y., and Gete Z., 2008. Land degradation and sustainable land management in the highlands of Ethiopia ;Global change and sustainable development
Hellden U., 1987.An Assessment of Woody Biomass, Community Forests, Land Use and Soil Erosion in Ethiopia, Lund University Press, Lund.
HurniH. ,1985. Erosion-productivity-conservation systems in Ethiopia. In: Proceedings of paper presented at the 4th international conference on soil conservation, Maracay, Venezuela
Hurni, H.,1990. Degradation and conservation of the soil resources in the Ethiopian highlands. In: African Mountains and Highlands: Problems and Perspective. Marceline, Missouri (USA).
Keesstra, S. D., Geissen, V., van Schaik, L., Mosse., K., andPiiranen, S., 2012. Soil as a filter for groundwater quality, Current Opinions in Environmental Sustainability, 4, 507–516, doi:10.1016/j.cosust.2012.10.007 Leh M., S. Bajwa, and I. Chaubey,.2011. Impact of Land Use Change on Erosion Risk: An Integrated Remote
Sensing, Geographic Information System and Modeling Methodology. Land Degradation & Development.
John Wiley & Sons, Ltd.
Mati, B.M., Morgan, R.P.C., Gichuki, F.N., Quinton, J.N, Brewer, T.R., and Liniger, H.P., 2000. Assessment of erosion hazard with the USLE and GIS: A case study of the Upper EwasoNg’iro North basin of Kenya, International Journal of Applied Earth Observation and Geoinformation, 2, 1-9.
Morgan, R.P.C. 1994. Soil Erosion and Conservation. Silsoe College, Cranfield University.
National Meteorological Service Agency (NMSA).,2015. Temperature and rain fall data of Ambo, Ethiopia. Unpublished document, Addis Ababa, Ethiopia
Nyssen J, Poesen J, Moeyersons J, Deckers J, Mitiku H, Lang A. ,2004. Human impact on the environment in the Ethiopian and Eritrean Highlands: a state of the art. Earth Sci Rev 64(3–4):273–320
Paulos, D. , 2001. Soil and water resources and degradation factors affecting their productivity in the Ethiopian highland agro ecosystems.Michigan State University Press. 8(1): 1-18
Pendey , A., Chowdary, V.M ., Mal, B.C ., 2007. Identification of critical erosion prone areas in the small agricultural waterhsed using USLE ,GIS and remote sensing . Water resource management 21(4) : 729 -746.
Samuel C., 2007. Soil erosion hazard assessment using usle model: a case study of Legedadi& Dire reservoir catchment MSC thesis in Remote Sensing and Geographical Information Systems (GIS) Of Addis Ababa University, Addis Ababa, Ethiopia
Srinivasarao, C., Venkateswarlu, B., Lal, R., Singh, A. K., Kundu, S., Vittal, K. P. R., Patel, J. J., and Patel, M. M., 2014. Long-term manuring and fertilizer effects on depletion of soil organic carbon stocks under pearl millet-cluster bean-castor rotation in Western India, Land Degrad. Dev., 25, 173–183,.
Taddessse A. and Abebe M., 2014.Gis based soil loss estimation using RUSLE model ; the case of JabiTehinanworedaanrs , Ethiopia natural resource 5. 616-626
Tamirie, H., 1995. The Survey of the Soil and Water Resources of Ethiopia, United Nations University, Tokyo, Temesgen G., Taffa T. and Mekuria A., 2017. Erosion risk assessment for prioritization of conservation
measures in Geleda watershed, Blue Nile basin, Ethiopia Environ Syst Res . DOI 10.1186/s40068-016-0078-x
Tesfaye, A., Negatu, W., Brouwer, R., and Van Der Zaag, P., 2014. Understanding soil conservationdecision of farmers in the Gedeb watershed, Ethiopia, Land Degrad. Dev., 25, 71–79,
Wischmeier W. H. and Smith D. D., 1978. Predicting Rainfall Erosion Losses: A Guide to Conservation Planning: USDA-ARS, USA
Yildirim, U., 2012. Assessment of soil erosion at the Değirmen Creek watershed area, Afyonkarahisar, Turkey.Proceedings of ISEPP (International Symposium on Environmental Protection and Planning: Geographic Information Systems (GIS) and Remote Sensing (RS) Applications). 28-29 June 2011, İzmir, Turkey. pp. 73-80.