ERIM REPORT SERIES RESEARCH IN MANAGEMENT ERIM Report Series reference number ERS-2000-48-MKT Publication status / version November 2000
Number of pages 25
Email address first author [email protected]
Address Erasmus Research Institute of Management (ERIM)
Rotterdam School of Management / Faculteit Bedrijfskunde Erasmus Universiteit Rotterdam
PoBox 1738
3000 DR Rotterdam, The Netherlands Phone: # 31-(0) 10-408 1182 Fax: # 31-(0) 10-408 9640 Email: [email protected] Internet: www.erim.eur.nl
Bibliographic data and classifications of all the ERIM reports are also available on the ERIM website: www.erim.eur.nl
A M
ANAGERIALP
ERSPECTIVE ON THEL
OGIC OFI
NCREASINGR
ETURNSE
RASMUS
R
ESEARCH
I
NSTITUTE OF
M
ANAGEMENT
REPORT SERIES
RESEARCH IN MANAGEMENT
B
IBLIOGRAPHIC DATA AND CLASSIFICATIONSAbstract The focus of this study is on the challenges faced by managers in effectively dealing with the new management logic of increasing returns as the information and knowledge intensity of their transformation processes rises. Dealing with these challenges is especially relevant for companies currently making the transition from capital and physical labor intensive transformation processes (old economy) to information and knowledge intensive transformation processes (new economy). For these companies, this study provides a definition of increasing returns, explains the sources of increasing returns and develops tools for monitoring the realization of increasing returns. These tools are applied at the Randstad Group, a leading temporary employment agency based in the Netherlands, currently making the transition from the old to the new economy. The study concludes with a discussion of the management implications of the new logic of increasing returns and suggestions for further research.
5001-6182 Business
5410-5417.5 Marketing
Library of Congress Classification
(LCC) HD 28 Management
M Business Administration and Business Economics
M 31 C 44
Marketing
Statistical Decision Theory Journal of Economic Literature (JEL) M 10 Business Administration 85 A Business General 280 G 255 A
Managing the marketing function Decision theory (general) European Business Schools
Library Group (EBSLG)
90 A Management theory
Gemeenschappelijke Onderwerpsontsluiting (GOO)
85.00 Bedrijfskunde, Organisatiekunde: algemeen
85.40 85.03
Marketing
Methoden en technieken, operations research Classification GOO
85.05 Management, organisatie
Bedrijfskunde / Bedrijfseconomie Marketing / Besliskunde Keywords GOO
Schaalvoordelen, Management, Kennismangement, Uitzendbureaus, Noordelijke Nederlanden Free keywords Increasing Returns; Management; Economics; Network effects; Interaction effects
Erik den Hartigh, Fred Langerak and Harry Commandeur
∗A Managerial Perspective on the Logic of Increasing Returns
November 2000
ABSTRACT. The focus of this study is on the challenges faced by managers in effectively dealing with the new management logic of increasing returns as the information and knowledge intensity of their transformation processes rises. Dealing with these challenges is especially relevant for companies currently making the transition from capital and physical labor intensive transformation processes (old economy) to information and knowledge intensive transformation processes (new economy). For these companies, this study provides a definition of increasing returns, explains the sources of increasing returns and develops tools for monitoring the realization of increasing returns. These tools are applied at the Randstad Group, a leading temporary employment agency based in the Netherlands, currently making the transition from the old to the new economy. The study concludes with a discussion of the management implications of the new logic of increasing returns and suggestions for further research.
Keywords:
Increasing Returns; Management; Economics; Network effects; Interaction effects
Erik den Hartigh is Consultant with TVA developments bv and PhD student at Erasmus University Rotterdam, Department of Marketing and Organization, PO Box 1738, NL-3000 DR Rotterdam, The Netherlands. Phone +31 10 4082609. Email: [email protected]. Fred Langerak is Assistant Professor of Strategic Marketing Management, Rotterdam School of Management, Erasmus University Rotterdam. Harry Commandeur is Professor of Economics for Increasing Returns at Nyenrode University. The authors gratefully acknowledge the support of the Dr. F.J.D. Goldschmeding Research Center of Economics for Increasing Returns at Nyenrode University.
A Managerial Perspective on the Logic of Increasing Returns
Introduction
In both established and emerging market sectors we see phenomena occur that, at first sight, appear at odds with current management logic. A few examples:
- A company like Microsoft which virtually dominates the market for home-use computer operating systems (MS-Windows 95/98), word processors (MS-Word) and Internet browser software (MS-Internet Explorer).
- Explosive growth in the market of cellular phones, where players like Ericsson and Nokia realize astronomical margins while others, like Lucent, have difficulties maintaining their position in the market.
- The increasing practice of offering products free of charge: from software (freeware/shareware) and digital encyclopedias to cellular phones.
These examples run counter to the 'common sense' of current management logic. What is going on?
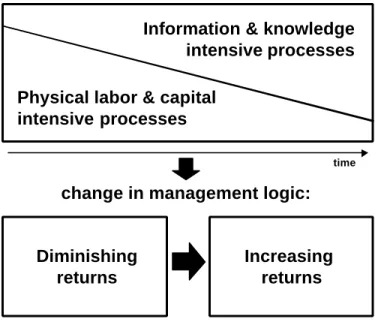
Across the economy, there is a gradual movement away from the development, production and marketing of products primarily based on capital and physical labor, towards the development, production and marketing of products primarily based on information and knowledge. With this shift the logic of managing these development, production and marketing processes is also changing: it moves from thinking in terms of diminishing returns to thinking in terms of increasing returns (see figure 1).
<< Figure 1 about here >>
In this study we discuss the new logic of increasing returns from a managerial perspective by applying economics principles of increasing returns to a business context. We start with defining the concept of increasing returns. We then describe the sources of increasing returns. Next, we present an empirical illustration of how the Randstad Group monitors the realization of increasing returns. Finally, we discuss the management implications of increasing returns and present suggestions for further research.
Increasing returns
From a managerial perspective a company may be regarded as a set of transformation processes. Each transformation process has input and output factors, the input being everything that is put into the process (e.g., land, labor, capital, information, knowledge) and the output being everything that comes out of the process (e.g., goods, services, information, knowledge).1 A transformation function can be drawn which relates the input factors to the output factors. The typical transformation function is an S-shaped curve (see figure 2). To the right of the point of inflection, output rises less than proportionally with input. Here we talk about diminishing returns. To the right of the point of inflection, output rises more than proportionally with input. This is what we refer to as increasing returns.
<< Figure 2 about here >>
The position of the point of inflection in the transformation function is determined by the characteristics of the input factors. The input factors capital and physical labor are, to a large extent, characterized by diminishing marginal productivity. This means that after a certain point deploying extra capital and physical labor will lead to diminishing returns. Contrary to capital and physical labor, the input factors information and knowledge are, to a large extent, characterized by increasing marginal productivity. This means that increasing returns will be more pervasive than diminishing returns. This pervasiveness of increasing returns is a consequence of the economic characteristics of information and knowledge. Glazer (1991) defined four characteristics on which information and knowledge differ from capital and physical labor.2 First, information and knowledge are not easily divisible or appropriable. This means that the same information and knowledge can be used by different economic entities at the same time. Second, information and knowledge are not inherently scarce (though often perishable). This implies that in the transformation process they are not depleted. Third, information and knowledge may not exhibit decreasing returns to use, but will often increase in value the more it is used. Fourth, information and knowledge are essentially regenerative. This means that new relevant information and knowledge may emerge from the transformation process as additional output. In summary, the ratio between information and knowledge as input factors, and capital and physical labor as input factors, determines the extent to which diminishing returns, or increasing returns occurs in the
transformation function (i.e., determines the position of the point of inflection in the transformation function).
Current management logic considers capital and physical labor the most important input factors in the transformation process. Following this logic the point of inflection in the transformation curve is positioned in the lower left corner (see figure 3). After a short interval of increasing returns, the diminishing marginal productivity of capital and physical labor will cause diminishing returns, or a less than proportionate output of products and services. This implies that the range within the transformation function in which increasing returns can be exploited is rather small. The new management logic considers information and knowledge as the most important input factors of the transformation process. Consistent with this logic the point of inflection in the transformation curve is positioned in the upper right corner (see figure 3). This means that the range in which increasing returns can be exploited is much larger than in transformation processes that are capital and physical labor intensive.
<< Figure 3 about here >>
This benefit of the new management logic will be most obvious for companies operating in the so-called new economy sectors, where transformation processes are often highly information and knowledge intensive. However, also companies operating in the old economy are currently making the transition towards more information and knowledge intensive processes. For the management of these companies the central question is how to guide and monitor the transition from the current management logic, based on diminishing returns, to the new management logic of increasing returns. Therefore it is important to first gain insight in the sources of increasing returns. These sources will be discussed henceforth.
Sources of increasing returns
Following Arthur (1988) four generic sources of increasing returns can be distinguished: scale effects, learning effects, network effects, and interaction effects.3 These sources are discussed below.
Scale effects
returns to scale. A distinction can be made between increasing returns to scale with respect to fixed costs and those with respect to variable costs. Increasing returns to scale with respect to fixed costs are present in both capital and physical labor intensive transformation processes and in transformation processes that are information and knowledge intensive. It entails that fixed costs are spread over as many products as possible. The larger the number of products, the smaller the average fixed cost. In capital and physical labor driven transformation processes, the realization of scale effects with respect to fixed costs is one of the most important drivers of competitive advantage (Scherer and Ross, 1990). The cost advantage thus acquired may be used by management, for example, to lower the market prices, which under certain conditions will lead to higher sales.4 This in turn requires larger production volumes, which may result in realization of even more economies of scale. The consequence is that increasing returns to scale may result in self-reinforcing effects.
For information and knowledge intensive transformation processes scale effects with respect to fixed costs are also important drivers of increasing production volumes. Additionally, information and knowledge intensive transformation processes often exhibit increasing returns to scale with respect to variable costs. This second type of increasing returns to scale relates to the specific cost structure of information and knowledge intensive products. These products are often characterized by high fixed (development) costs and low variable costs. The latter do not increase, or will even decrease with larger production volumes (Shapiro and Varian, 1998).5 Computer programs are a good example of products that have such a cost structure. These products require high development costs, but very low reproduction and distribution costs (which often only consist of the cost of the diskette or CD-ROM). By using the Internet the costs of reproduction and distribution can even be reduced to almost zero. The consequence of this cost structure is that the average (total) cost curve will descend steeply as the production volume increases. This descent offers the company a unique possibility of improving the product's value proposition for the customer, either by raising the quality of the product and/or by lowering the market price. Improving product value raises demand, which may lead to higher sales. Higher sales require larger production volumes, which in turn lead to lower average cost. Here too, we see self-reinforcing effects under the assumption of sufficiently elastic market demand to sell these rising production volumes.6 However, in a global market in which distribution costs are gradually decreasing, this assumption often holds.
Learning effects
A second source of increasing returns is learning effects. This means that there is a dynamic relation between the growth of output and the growth of productivity (Amit, 1986; Kaldor, 1966).7 In capital and physical labor intensive transformation processes learning results in a more efficient use of the input factors capital and physical labor. In other words, the same output can be produced with less capital and physical labor input. A similar effect exists in information and knowledge intensive transformation processes. Not only are information and knowledge used more efficiently as input factors, but these processes may also generate information and knowledge as additional output. This additional information and knowledge can then be used again as input in the transformation process to develop new products or improve existing ones. A good example is the market for (cellular) communication networks. The installation of such networks is an activity in which considerable learning effects occur. Each installed network generates new knowledge for improving both the future efficiency (i.e., lower costs) and effectiveness (i.e., higher quality) of the network installation process. Consequently companies that have installed large numbers of such networks, such as Ericsson, Nokia or Motorola, are creating a growing information and knowledge edge over companies that have installed fewer networks (Funk, 1998). Moreover, as information and knowledge are time-sensitive (Glazer and Weiss, 1993), the continuous output of new information and knowledge becomes an important success factor. As better and more recent information and knowledge will generate new information and knowledge, the learning effects are reinforced. This indicates that increasing returns are present.
Network effects
A third source of increasing returns is network effects. These occur when the economic utility of using a product becomes larger as its network grows in size (Farrell and Saloner, 1985; Katz and Shapiro, 1985). Network size is determined by the number of suppliers and users of products based on a common technological standard. Network size is important in modern information and knowledge intensive markets, such as the markets for software programs, cellular phones, and Internet applications. Classical examples of products where network effects played an important part, are the telegraph, telex and telephone. The fax machine also belongs to this category: "Consider the first modern fax machine that rolled off the conveyor belt around 1965. Despite millions of dollars spent on its R&D, it was worth nothing. Zero. The second fax machine to roll off immediately made the first one worth something. There
was someone to fax to. Because fax machines are linked into a network, each additional fax machine sliding down the chute increases the value of all the fax machines operating before it" (Kelly, 1997, p.142). When a product's economic utility increases as more customers start using it, this is referred to as direct network effects (Farrell and Saloner, 1985; Katz and Shapiro, 1985).
Network effects are also a factor when products are used in combination with complementary products. The increase in a product's economic utility as more customers start using complementary products is referred to as indirect or market-mediated network effects (Farrell and Saloner, 1985; Katz and Shapiro, 1985; Gupta, Jain and Sawhney, 1999). Examples of indirect network effects are the cellular phone and its network infrastructure, the Internet connection and network protocols, the personal computer and its operating system (cf. Katz and Shapiro, 1994). Compatibility, necessary to allow products to function in harmony with complementary products, can be ensured by standardization of the technological infrastructure (Farrell and Saloner, 1992). For example, only if there is a common protocol for communication through Internet can a customer benefit from the continuously growing network of Internet-users and content providers. Therefore, compatibility is one of the most important conditions for network effects to materialize. With a growing number of customers who have bought the standard personal computer with an MS-Windows operating system and Intel microprocessor, it becomes more attractive for other customers to do the same (i.e., direct network effects) and more attractive for suppliers of software and peripheral equipment (i.e., complementary products) to accept this standard too (i.e., indirect network effects). Consequently it becomes more attractive for potential customers to buy these complementary products. In other words, direct and indirect network effects are mutually reinforcing. This is a reason why in the market for personal computers a very large, dominant network appeared around Microsoft and Intel products.
Interaction effects
A fourth source of increasing returns is interaction effects, also known as social network effects (Abrahamson and Rosenkopf, 1997), or social contagion (Burt, 1987; Kretschmer, Klimis and Choi, 1999). Interaction effects occur when a customer's purchase decision is dependent on the opinions or expectations of other (potential) customers. We refer to interdependence of opinions as information exchange and to interdependence of expectations as self-reinforcing expectations. The difference between network effects and interaction
effects is that while network effects are associated with economic utility, interaction effects are associated with social legitimacy (Westphal, Gulati and Shortell, 1997; Kretschmer, Klimis and Choi, 1999). Interaction effects mainly occur with high-involvement products that are relatively unknown, the quality of which cannot be assessed before purchase, and with products of which the purchase entails a large network risk.8 With the purchase of products such as computers or cellular phones, customers buy into a technological network of compatible products. If the technology life cycle of this network is short, or if the network does not develop into the market standard, the customer's investment is lost. To assess the risks of such a technological network, customers search for information by consulting opinion leaders and existing product users before they buy the product. This information search behavior generates interaction (information exchange) between customers. Arthur and Lane (1993) refer to this interaction as 'information contagion'. It is more probable that a customer will find favorable information about a product that has a large market share than about a product with a small one. Customers perceive the purchase of the former product as less risky and will be more inclined to buy it. Consequently the market share of this product increases more and more at the expense of the small market share product. In this way information exchange causes self-reinforcing effects in market shares.
Apart from product-specific information exchange, customers also exchange generic (i.e., non-product-specific) market information. Feick and Price (1987) refer to the person who supplies this kind of information to other customers as the market maven.9 In particular in the case of network technologies, where the complete network of complementary products rather than the individual product is at stake, the influence of the market maven on the purchase intentions of other customers can be substantial. Furthermore, customers have an interest to invest in products that are compatible to a long living technology network that is widely supported. Therefore, customers come to expect a certain size of competing networks (Katz and Shapiro, 1985). This size is dependent on the number of suppliers and customers who have already invested in this network or will do so in the future. When a substantial number of suppliers and customers expect a particular network to dominate the market, they will be more inclined to invest in this network. As a result the size of the network will increase, reinforcing the expectations of customers and thereby attracting even more customers. Because of these self-reinforcing expectations there is a high probability that this network will indeed dominate the market.
Monitoring the sources of increasing returns
Of the four generic sources of increasing returns discussed above, scale effects and learning effects are primarily company-driven, while network effects and interaction effects are mainly market-driven. It should further be noticed that for capital and physical labor intensive transformation processes the most important sources of increasing returns are scale effects and learning effects. For information and knowledge intensive transformation processes all four sources of increasing returns are important, even more so if we consider the mutually reinforcing effects of the company-driven and market-driven sources of increasing returns (see figure 4). In other words, in information and knowledge intensive transformation processes the potential for realizing scale effects and learning effects is magnified by the pervasive potential of network and interaction effects. This explains the growing importance of increasing returns influences in new economy companies with information and knowledge intensive transformation processes.
<< Figure 4 about here >>
To deal effectively with the challenges of the new management logic of increasing returns, management needs to understand the extent to which their company exploits the different sources of increasing returns. To facilitate this understanding we developed a set of generic monitoring tools. These tools were then applied in the setting of a case study at the Randstad Group.
<< box "Case Randstad" about here >> Case Randstad
The Randstad Group is the world's third-largest staffing firm and is the market leader in the Netherlands, Belgium, Germany and the southeastern United States. The company's performance has been characterized by high growth in revenues and earnings - these have been growing at an average rate of about 20% annually over the past 25 years. The Randstad Group's activities have a strongly local character. The decentralized organization enables corporate employees to provide optimal response to local employment market conditions. Operations are conducted through a network of more than 1,700 branches. The geographic focus of the company's growth strategy
is Europe and North America, regions that represent more than 80% of the global market for staffing services. The company's ambition is to become, or remain the major player in these regions and, as it has done in the past, surpass market growth with respect to both revenue and profit growth.
The Randstad Group's traditional transformation process entails matching supply and demand in the temporary labor market and can be characterized as labor-intensive. The input factor labor consists of the direct labor input of the temporary employees and the indirect labor input of the employees performing the matching process and overhead services, and counts for more than 90% of the costs. The most important output of this process (i.e., products) is the number of temporary employees. Based on this characterization of the transformation process, the realization of future growth in market share and revenues should come from increasing returns induced by scale effects and learning effects (Baker, Hogan and Ragan, 1996).
To simultaneously realize increasing returns through network and interaction effects the Randstad Group is currently making a shift from its traditional labor-intensive transformation process (old economy) towards a new information and knowledge intensive transformation process (new economy). This transition towards a more information and knowledge intensive transformation process is set in motion through the introduction of new Internet-mediated labor matching formulas, like Joblife, Hedson, Yacht, and NewMonday.
Monitoring scale effects
Consistent with our definition of scale effects, the downward slope of the average total cost functions gives an indication of increasing returns to scale with respect to both fixed and variable cost (Arrow, Ng and Yang, 1998, p.xix). To monitor the realization of scale effects a company's average total cost function can be plotted over a number of years. A downward slope of the curve means that scale effects have been realized.
To determine the extent to which the Randstad Group has realized increasing returns to scale, we have plotted the Randstad Group's average total cost function over the years 1986 to 1997. To this end we divided the sum of employment costs of own employees, employment costs of temporary employees and depreciation costs (i.e., the fixed and variable cost of the input
factors)10 by the number of temporary employees (i.e., the main output factor).11 This generates the average total cost per temporary employee, which is shown in figure 5.
<< Figure 5 about here >>
The descent of the curve until 1993 reveals that the Randstad Group realized increasing returns to scale over these years. After 1993 the curve flattens out, which indicates that increasing returns to scale are no longer realized. This means that, with respect to scale effects, the Randstad Group has surpassed the point of inflection where the transformation function changes from increasing to diminishing returns.
Monitoring learning effects
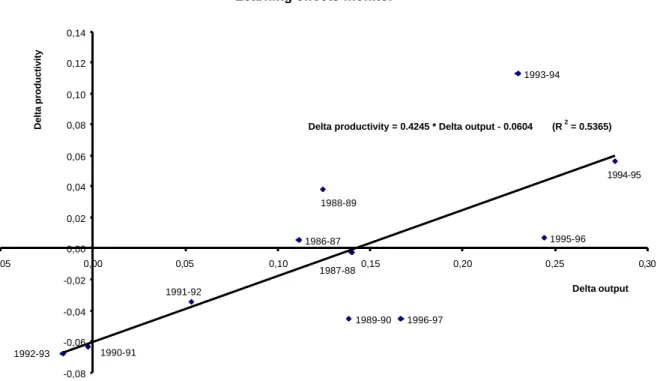
To monitor realization of learning effects, the so-called Verdoorn law may be used.12 The Verdoorn law states that there is a linear relationship between the growth of labor productivity (∆P) and the growth of output (∆Q). This relationship has been empirically observed across industries and countries (Kaldor, 1966; Fingleton and McCombie, 1998). It can be expressed in the following formula:
∆ P = a + b * ∆ Q
This formula is consistent with our definition of learning effects as a dynamic relation between the growth of output and the growth of productivity. By plotting growth of output (∆Q) and growth of productivity (∆P) in a scatter diagram the Verdoorn law can be estimated. Provided the relationship is statistically significant, the value of the coefficient b larger than 0 indicates a company's has realized of learning effects. The intercept of the function (i.e., a) indicates the 'autonomous' rate of productivity increase (Kaldor, 1966). For the Randstad Group productivity was measured as the number of temporary employees (output) divided by the number of own employees (input).13
<< Figure 6 about here >>
The Verdoorn law is estimated for the Randstad Group in figure 6. The value of the y-axis indicates annual growth of the productivity, whereas the value of the x-axis indicates annual
growth of output volume (i.e., the number of temporary employees). Over the years 1986 to 1997, the value of b for the Randstad Group was 0.425 (p < 0.01). Economy-wide and sector-based studies have found values between 0.45 and 0.6 (Kaldor, 1966; Fingleton and McCombie, 1998). This indicates that the Randstad Group has realized increasing returns from learning effects, albeit at a relatively moderate rate. Although the point of inflection where the transformation function changes to diminishing returns has not been reached, the negative value of the intercept (i.e., a = -0.0604) indicates that there is an autonomous decline in productivity of about 6% per year. This decline has largely offset the realized increasing returns from learning effects.
Monitoring network and interaction effects
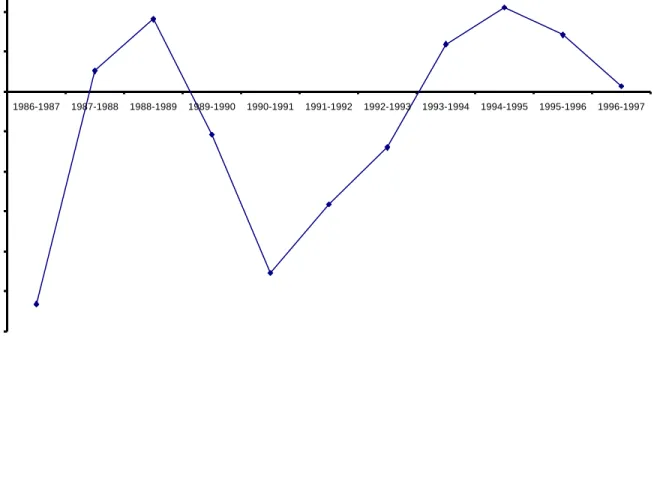
Our description of network effects and interaction effects as market-driven sources of increasing returns implies that these effects should preferably be monitored using customers' and suppliers' perceptions. Because it is difficult and expensive to monitor customers' and suppliers' perceptions on network and interaction effects, we have developed a proxy through which management can easily monitor the extent to which their company has realized network and interaction effects. This proxy focuses on the main consequence of network and interaction effects. This consequence constitutes that the growth in size of the company's network14 should surpass the growth of the market size. This means that the following ratio should be larger than 1:
∆ (Network size) / ∆ (Market size)
For the Randstad Group the relevant network size is related to individual branches, because the activities of the Randstad Group have a strong local character. Therefore, the Randstad Group's growth in network size is measured by the annual growth of the number of temporary employees per branch (∆ Network size). The growth of market size is measured by an annual growth index for the temporary labor market (∆ Market size).15
<< Figure 7 about here >>
The ratio ∆ (Network size)/∆ (Market size) for the Randstad Group for the years 1986 to 1997 is plotted in figure 7. The results reveal that, at least until 1997, the Randstad Group has not
realized increasing returns through network and interaction effects.
Discussion & implications
In this study we described increasing returns as the increasing marginal productivity of input factors in a company's transformation process. We have argued that the input factors capital and physical labor are primarily characterized by diminishing marginal productivity, whereas the input factors information and knowledge are primarily characterized by increasing marginal productivity. As such, the ratio between information and knowledge, and capital and physical labor as input factors in a company's transformation process determines the range in which a company can exploit increasing returns. The implication is that in order to understand the new logic of increasing returns managers should view their company as a set of transformation processes and gain insight in the nature of the input factors associated with these processes.
When the dominant input factors in a company's transformation process consist of capital and physical labor, managers can exploit increasing returns primarily through the realization of scale and learning effects. When the main input factors are information and knowledge, exploitation of increasing returns occurs through the realization of network and interaction effects, as well as the realization of scale and learning effects. The implication is that managers must understand the nature and the mutually reinforcing character of the sources of increasing returns to fully take advantage of the increasing marginal productivity of input factors.
To determine the extent to which a company realizes increasing returns, we developed a set of monitoring tools related to the company-driven and market-driven sources of increasing returns. We showed that the realization of scale effects can be monitored using a company's average total cost function. The realization of learning effects can be determined using the Verdoorn law. The realization of network and interaction effects can be assessed using the ratio between the growth in the company's network size and market size. Through the application of these monitoring tools, management can assess the company's progress in making the transition from capital and physical labor intensive transformation processes (old economy) towards information and knowledge intensive transformation processes (new economy). The implication for managers of companies making this transition is that they must
foremost pursue the realization of network and interaction effects to enlarge the company's network size. Managers should be aware however, that network and interaction effects can only be taken advantage of through the realization of scale and learning effects. Companies, for example, that suffer from diseconomies of scale or negative learning effects, will not benefit from an enlargement of their network size. Therefore, the realization of scale and learning effects should not be neglected.
Application of the monitoring tools at the Randstad Group over the period 1986 to 1997 reveals that the traditional temporary labor matching process has surpassed the point of inflection where, with respect to scale effects, the transformation function changes to diminishing returns. With regard to learning effects this point has not yet been reached, but the autonomous decline in productivity suggests that the transformation function will soon shift towards diminishing returns. For the Randstad Group realization of network and interaction effects has not yet become visible, despite the fact that the transition towards a more information and knowledge intensive matching process is in progress. This means that the Randstad Group's growth in market share and revenues in the period 1986 to 1997 does not stem from the exploitation of company-driven or market-driven sources of increasing returns. Rather, the growth realized during this period probably stems from the increase in the number of branches, which amounted to an average growth of 8.4 % a year. This increase in the number of branches has, however, had a negative impact on the realization of scale and learning effects.
The managerial implication is that, with respect to the growth in the number of branches, the extent of the market has been reached. This means that the objectives of the Randstad Group's management in terms of continuously surpassing market growth may not be sustained. Application of the monitoring tools has grown this awareness among managers of the Randstad Group and prompted them to accelerate the transition towards more information and knowledge intensive processes to better exploit the market-driven sources of increasing returns. This has materialized in an accelerated and more extensive roll-out of the Internet-mediated temporary labor matching processes, like Joblife, Hedson, Yacht, and NewMonday. When this shift materializes the importance of increasing returns induced by network effects and interaction effects should increase and new possibilities of exploiting these opportunities should arise. In turn, this will create new opportunities for realizing scale and learning effects in these Internet-mediated matching processes.
Future research
This study is limited by several factors that should be addressed by future research. First, although the theoretical basis for the sources of increasing returns and the monitoring tools is firmly embedded in economic theory, the empirical application is limited to a single case study at the Randstad Group. The case study methodology denotes a severe limitation to the external validity of the results (Yin, 1994). Therefore, future research should apply the tools for monitoring the sources of increasing returns to a broader set of companies and industries.
Second, the tools for monitoring scale and learning effects are applied using company-level data. Unlike the Randstad Group, which has a distinct transformation process, most companies consist of a set of interrelated transformation processes. Future research might therefore consider using process-level data to accurately monitor other companies' exploitation of the sources of increasing returns.
Third, the tool for monitoring the realization of network and interaction effects is applied using company data instead of customers' and suppliers' perceptions. The drawbacks of this approach are that only the joint realization of network and interaction effects can be monitored by focusing on the consequences of these effects (i.e., the disproportionate growth of the company's network). Future research should consider using customers' and suppliers' perceptions to separately monitor the exploitation of these sources by measuring the economic and social utility of products in relation to network size.
Finally, in this study, the company-driven and market-driven sources of increasing returns were monitored separately. The highest increasing returns potential will come from the mutual influence and mutual reinforcement of these sources. Future research should aim to examine the interaction between these sources.
Notes
1. Notice that information and knowledge can be both input and output factors of transformation processes.
2. Notice that capital and physical labor have the characteristics of the typical economic good (i.e. divisibility, appropriability, scarcity and decreasing returns to use).
3. Arthur (1988, p.10) talks about 'large set-up or fixed costs', 'learning effects', 'coordination effects' and 'self-reinforcing expectations'.
4. These conditions require sufficient market demand with sufficient price elasticity (i.e., the price elasticity of demand has to be smaller than –1).
5. The difference with capital and physical labor intensive products is that these often show increasing variable cost, causing the familiar u-shaped form of the average cost curve.
6. This reflects Adam Smith's well-known argument about the relation between increasing returns (in his view caused by division of labor) and the extent of the market.
7. Kaldor (1966) refers to the empirically observed linear relationship between a country's or sector's growth in labor productivity and its growth of output as the 'Verdoorn law'. The relationship is based on the work of P.J. Verdoorn: "Fattori che regolano lo sviluppo della producttivitá del lavoro"; L'Industria; 1949 (published in Italian).
8. This may be a physical network risk (e.g., the risk of buying into the wrong technology), or a social network risk (e.g., the risk of buying into the wrong fashion style or social group). 9. Feick and Price (1987, p.85) define market mavens as "individuals who have information about many kinds of products, places to shop, and other facets of markets, and initiate discussions with consumers and respond to requests from consumers for market information". 10. These input and output factors were selected after extensive discussions with the management of Randstad Holding N.V. The data are adopted from the annual reports of Randstad Holding N.V.
11. This is the average number of temporary employees over the year.
12. An alternative way of monitoring learning effects is plotting the average (total) cost versus the cumulative output over the years (e.g., Amit, 1986).
13. This decision was made after extensive discussions with the management of Randstad Holding N.V.
14. We defined network size as the number of suppliers and customers of products based on a common technological standard.
References
Abrahamson, E. and L. Rosenkopf. 1997. "Social Network Effects on the Extent of Innovation Diffusion: A Computer Simulation." Organization Science 8, no.3: 289-309. Amit, R. 1986. "Cost Leadership Strategy and Experience Curves." Strategic Management Journal 7: 281-292.
Arrow, K.J., Y-K Ng and X. Yang 1998. Increasing Returns and Economic Analysis. Houndmills: MacMillan Press Ltd.
Arthur, W.B. "Self-Reinforcing Mechanisms in Economics." in: Anderson, Ph. W., K.J. Arrow and D. Pines (eds.), The Economy as an Evolving Complex System. Redwood City California: Addison-Wesley Publishing Company, Inc., 1988, pp. 9-31.
Arthur, W.B. and D. Lane. "Information Contagion." in: Arthur, W.B. (ed.), Increasing Returns and Path Dependence in the Economy. Ann Arbor: The University of Michigan Press 1994.
Baker, S., S. Hogan and C. Ragan 1996. "Is there compelling evidence against increasing returns to matching in the labour market?" Canadian Journal of Economics 29, no.4: 976-993. Burt, R.S. 1987. "Social Contagion and Innovation: Cohesion Versus Structural Equivalence." American Journal of Sociology 92: 1287-1335.
Farrell, J. and G. Saloner 1985. "Standardization, Compatibility, and Innovation." Rand Journal of Economics 16, no.1: 70-83.
Farrell, J. and G. Saloner 1992. "Converters, Compatibility, and the Control of Interfaces." The Journal of Industrial Economics 40, no.1: 9-35.
Feick, L.F. and L.L. Price 1987. "The Market Maven: A Diffuser of Marketplace Information." Journal of Marketing 51, January: 83-97.
Fingleton, B. and J.S.L. McCombie 1998. "Increasing Returns and Economic Growth: Some Evidence for Manufacturing from the European Union Regions." Oxford Economic Papers 50: 89-105.
Funk, J.L. 1998. "Competition Between Regional Standards and the Success and Failure of Firms in the World-Wide Mobile Communication Market." Telecommunications Policy 22, no.4/5: 419-441.
Glazer, R. 1991. "Marketing in an Information-Intensive Environment: Strategic Implications of Knowledge as an Asset." Journal of Marketing 55, October: 1-19.
and the Time-Sensitivity of Information." Journal of Marketing Research 30, November: 509-521.
Gupta, S., D.C. Jain and M.S. Sawhney 1999. "Modeling the Evolution of Markets with Indirect Network Externalities: An Application to Digital Television." Marketing Science 18, no.3: 396-416.
Kaldor, N. 1966. "Causes of the Slow Rate of Economic Growth in the United Kingdom." In Targetti, F. and A.P. Thirlwall (ed.), The Essential Kaldor. Cambridge: Cambridge University Press 1989: pp. 282-310.
Katz, M.L. and C. Shapiro 1985. "Network Externalities, Competition, and Compatibility." American Economic Review 75, no.3: 424-440.
Katz, M.L. and C. Shapiro 1994. "Systems Competition and Network Effects." Journal of Economic Perspectives 8, no.2: 93-115.
Kelly, K. 1997. "New Rules for the New Economy: Twelve Dependable Principles for Thriving in a Turbulent World." Wired September: 140-197.
Kretschmer, M., G.M. Klimis and C.J. Choi 1999. "Increasing Returns and Social Contagion in Cultural Industries." British Journal of Management 10: S61-S72.
Scherer, F.M. and D. Ross 1990. Industrial Market Structure and Economic Performance. Third Edition. Boston: Houghton Mifflin Company.
Shapiro, C. and H.R. Varian 1998. "Versioning: The Smart Way to Sell Information." Harvard Business Review 76, November-December: 106-144.
Shapiro, C. and H.R. Varian 1999. "The Art of Standards Wars." California Management Review 41, no.2, Winter: 8-32.
Westphal, J.D., R. Gulati and S.M. Shortell 1997. "Customization or Conformity? An Institutional and Network Perspective on the Content and Consequences of TQM Adoption." Administrative Science Quarterly 42, no.2: 366-394.
Yin, R.K. 1994. Case Study Research: Design and Methods. Second edition. Thousand Oaks, California: Sage Publications.
Figure 1: Changing management logic
Physical labor & capital intensive processes
Information & knowledge intensive processes
Diminishing returns
Increasing returns change in management logic:
Figure 2: A typical transformation function Input Output Range of increasing marginal productivity (increasing returns) Range of diminishing marginal productivity (diminishing returns) Inflection point
Figure 3: The different shapes of the transformation function Input Output Range to exploit increasing returns Inflection point
Information and knowledge intensive process Input Output Range to exploit increasing returns Inflection point
Capital and physical labor intensive process
Figure 4: Sources of increasing returns Size of the network Number of (potential) customers Production volume Scale effects Learning effects Network effects Interaction effects Primarily company driven Primarily market driven
Figure 5: Scale effects monitor
Scale effects monitor
1997 1996 1995 1994 1993 1992 1991 1990 1989 1988 1987 1986 20000 22000 24000 26000 28000 30000 32000 34000 36000 20000 40000 60000 80000 100000 120000 140000 160000 180000
Yearly output (number of temporary employees)
Figure 6: Learning effects monitor
Learning effects monitor
1986-87 1987-88 1988-89 1989-90 1990-91 1991-92 1992-93 1993-94 1994-95 1995-96 1996-97
Delta productivity = 0.4245 * Delta output - 0.0604 (R2 = 0.5365)
-0,08 -0,06 -0,04 -0,02 0,00 0,02 0,04 0,06 0,08 0,10 0,12 0,14 -0,05 0,00 0,05 0,10 0,15 0,20 0,25 0,30 Delta output Delta productivity
Figure 7: Network and interaction effects monitor
Network and interaction effects monitor
-3,00 -2,50 -2,00 -1,50 -1,00 -0,50 0,00 0,50 1,00 1,50 1986-1987 1987-1988 1988-1989 1989-1990 1990-1991 1991-1992 1992-1993 1993-1994 1994-1995 1995-1996 1996-1997
E
RASMUS
R
ESEARCH
I
NSTITUTE OF
M
ANAGEMENT
REPORT SERIES
RESEARCH IN MANAGEMENT
Publications in the Report Series Research∗ in Management
Impact of the Employee Communication and Perceived External Prestige on Organizational Identification Ale Smidts, Cees B.M. van Riel & Ad Th.H. Pruyn
ERS-2000-01-MKT
Critical Complexities, from marginal paradigms to learning networks Slawomir Magala
ERS-2000-02-ORG
Forecasting Market Shares from Models for Sales Dennis Fok & Philip Hans Franses
ERS-2000-03-MKT
A Greedy Heuristic for a Three-Level Multi-Period Single-Sourcing Problem H. Edwin Romeijn & Dolores Romero Morales
ERS-2000-04-LIS
Integer Constraints for Train Series Connections Rob A. Zuidwijk & Leo G. Kroon
ERS-2000-05-LIS
Competitive Exception Learning Using Fuzzy Frequency Distribution W-M. van den Bergh & J. van den Berg
ERS-2000-06-LIS
Start-Up Capital: Differences Between Male and Female Entrepreneurs, ‘Does Gender Matter?’ Ingrid Verheul & Roy Thurik
ERS-2000-07-STR
The Effect of Relational Constructs on Relationship Performance: Does Duration Matter? Peter C. Verhoef, Philip Hans Franses & Janny C. Hoekstra
ERS-2000-08-MKT
Marketing Cooperatives and Financial Structure: a Transaction Costs Economics Analysis George W.J. Hendrikse & Cees P. Veerman
ERS-2000-09-ORG
∗ ERIM Research Programs:
LIS Business Processes, Logistics and Information Systems ORG Organizing for Performance
MKT Decision Making in Marketing Management F&A Financial Decision Making and Accounting
A Marketing Co-operative as a System of Attributes: A case study of VTN/The Greenery International BV, Jos Bijman, George Hendrikse & Cees Veerman
ERS-2000-10-ORG Evaluating Style Analysis
Frans A. De Roon, Theo E. Nijman & Jenke R. Ter Horst ERS-2000-11-F&A
From Skews to a Skewed-t: Modelling option-implied returns by a skewed Student-t Cyriel de Jong & Ronald Huisman
ERS-2000-12-F&A
Marketing Co-operatives: An Incomplete Contracting Perspective George W.J. Hendrikse & Cees P. Veerman
ERS-2000-13– ORG
Models and Algorithms for Integration of Vehicle and Crew Scheduling Richard Freling, Dennis Huisman & Albert P.M. Wagelmans
ERS-2000-14-LIS
Ownership Structure in Agrifood Chains: The Marketing Cooperative George W.J. Hendrikse & W.J.J. (Jos) Bijman
ERS-2000-15-ORG
Managing Knowledge in a Distributed Decision Making Context: The Way Forward for Decision Support Systems Sajda Qureshi & Vlatka Hlupic
ERS-2000-16-LIS
Organizational Change and Vested Interests George W.J. Hendrikse
ERS-2000-17-ORG
Strategies, Uncertainty and Performance of Small Business Startups Marco van Gelderen, Michael Frese & Roy Thurik
ERS-2000-18-STR
Creation of Managerial Capabilities through Managerial Knowledge Integration: a Competence-Based Perspective Frans A.J. van den Bosch & Raymond van Wijk
ERS-2000-19-STR
Adaptiveness in Virtual Teams: Organisational Challenges and Research Direction Sajda Qureshi & Doug Vogel
ERS-2000-20-LIS
Currency Hedging for International Stock Portfolios: A General Approach Frans A. de Roon, Theo E. Nijman & Bas J.M. Werker
ERS-2000-21-F&A
Transition Processes towards Internal Networks: Differential Paces of Change and Effects on Knowledge Flows at Rabobank Group
Raymond A. van Wijk & Frans A.J. van den Bosch ERS-2000-22-STR
Assessment of Sustainable Development: a Novel Approach using Fuzzy Set Theory A.M.G. Cornelissen, J. van den Berg, W.J. Koops, M. Grossman & H.M.J. Udo ERS-2000-23-LIS
Creating the N-Form Corporation as a Managerial Competence Raymond vanWijk & Frans A.J. van den Bosch
ERS-2000-24-STR
Competition and Market Dynamics on the Russian Deposits Market Piet-Hein Admiraal & Martin A. Carree
ERS-2000-25-STR
Interest and Hazard Rates of Russian Saving Banks Martin A. Carree
ERS-2000-26-STR
The Evolution of the Russian Saving Bank Sector during the Transition Era Martin A. Carree
ERS-2000-27-STR
Is Polder-Type Governance Good for You? Laissez-Faire Intervention, Wage Restraint, And Dutch Steel Hans Schenk
ERS-2000-28-ORG
Foundations of a Theory of Social Forms
László Pólos, Michael T. Hannan & Glenn R. Carroll ERS-2000-29-ORG
Reasoning with partial Knowledge László Pólos & Michael T. Hannan ERS-2000-30-ORG
Applying an Integrated Approach to Vehicle and Crew Scheduling in Practice Richard Freling, Dennis Huisman & Albert P.M. Wagelmans
ERS-2000-31-LIS
Informants in Organizational Marketing Research: How Many, Who, and How to Aggregate Response? Gerrit H. van Bruggen, Gary L. Lilien & Manish Kacker
ERS-2000-32-MKT
The Powerful Triangle of Marketing Data, Managerial Judgment, and Marketing Management Support Systems Gerrit H. van Bruggen, Ale Smidts & Berend Wierenga
ERS-2000-33-MKT
The Strawberry Growth Underneath the Nettle: The Emergence of Entrepreneurs in China Barbara Krug & Lászlo Pólós
ERS-2000-34-ORG
Consumer Perception and Evaluation of Waiting Time: A Field Experiment Gerrit Antonides, Peter C. Verhoef & Marcel van Aalst
ERS-2000-35-MKT Trading Virtual Legacies Slawomir Magala ERS-2000-36-ORG
Broker Positions in Task-Specific Knowledge Networks: Effects on Perceived Performance and Role Stressors in an Account Management System
David Dekker, Frans Stokman & Philip Hans Franses ERS-2000-37-MKT
An NPV and AC analysis of a stochastic inventory system with joint manufacturing and remanufacturing Erwin van der Laan
ERS-2000-38-LIS
Generalizing Refinement Operators to Learn Prenex Conjunctive Normal Forms Shan-Hwei Nienhuys-Cheng, Wim Van Laer, Jan N Ramon & Luc De Raedt ERS-2000-39-LIS
Classification and Target Group Selection bases upon Frequent Patterns Wim Pijls & Rob Potharst
ERS-2000-40-LIS
New Entrants versus Incumbents in the Emerging On-Line Financial Services Complex Manuel Hensmans, Frans A.J. van den Bosch & Henk W. Volberda
ERS-2000-41-STR
Modeling Unobserved Consideration Sets for Household Panel Data
Erjen van Nierop, Richard Paap, Bart Bronnenberg, Philip Hans Franses & Michel Wedel ERS-2000-42-MKT
The Interdependence between Political and Economic Entrepeneurship ERS-2000-43-ORG
Barbara Krug
Ties that bind: The Emergence of Entrepreneurs in China Barbara Krug
ERS-2000-44-ORG
What’s New about the New Economy? Sources of Growth in the Managed and Entrepreneurial Economies David B. Audretsch and A. Roy Thurik
ERS-2000-45-STR
Human Resource Management and Performance: Lessons from the Netherlands Paul Boselie, Jaap Paauwe & Paul Jansen
ERS-2000-46-ORG
Average Costs versus Net Present Value: a Comparison for Multi-Source Inventory Models Erwin van der Laan & Ruud Teunter