Hurst, W, Merabti, M and Fergus, P
Behaviour analysis techniques for supporting critical infrastructure security
http://researchonline.ljmu.ac.uk/10035/
Article
LJMU has developed LJMU Research Online for users to access the research output of the University more effectively. Copyright © and Moral Rights for the papers on this site are retained by the individual authors and/or other copyright owners. Users may download and/or print one copy of any article(s) in LJMU Research Online to facilitate their private study or for non-commercial research. You may not engage in further distribution of the material or use it for any profit-making activities or any commercial gain.
The version presented here may differ from the published version or from the version of the record. Please see the repository URL above for details on accessing the published version and note that access may require a subscription.
For more information please contact [email protected]
Citation
(please note it is advisable to refer to the publisher’s version if you
intend to cite from this work)
Hurst, W, Merabti, M and Fergus, P (2014) Behaviour analysis techniques
for supporting critical infrastructure security. International Journal of
Critical Infrastructures, 10 (3-4). ISSN 1475-3219
B
EHAVIOURAL
C
LASSIFICATION FOR
E
NHANCING
C
RITICAL
I
NFRASTRUCTURE
S
ECURITY
Abstract — Protecting critical infrastructures from cyber-threats in an increasingly digital age is a matter of growing urgency for governments and private industries across the globe. In a climate where cyber-security is an uncertainty, fresh and adaptive solutions to existing computer security approaches are a must. In this paper, we present our approach to supporting critical infrastructure security. The use of our critical infrastructure simulation, developed using Siemens Tecnomatix Plant Simulator and the programming language SimTalk, is used to construct realistic data from a simulated nuclear power plant. The data collected from the simulation, when both functioning as normal and during a cyber-attack scenario, is done through the use of an observer pattern. By extracting features from the data collected, threats to the system are identified by modelling system behaviour and identifying changes in patterns of activity by using three data classification techniques.
Index Terms— Critical Infrastructure, Cyber-Attack, Data
Classification, Behavioural Observation, Simulation, Tecnomatix
1. INTRODUCTION
The emergence of the new level of sophistication of cyber-attacks has given critical infrastructure security an increasing focus, in governments, industry and the media around the globe [5]. Protecting critical infrastructures against cyber-threats is becoming a matter of urgency.
Intrusion detection systems (IDS) [6] and unified threat management systems (UTM) [7] both have the role of ensuring critical infrastructures are kept safe. The problem is, both of these approaches are struggling to keep up-to pace with the growing level of complexity cyber-attacks now possess.
Consequently, we present a continuation of our research into the use of behavioural observation for the support of critical infrastructure security against this growing cyber-threat [1, 2, 3, 4].
In this paper, we present, initially, our simulation of a nuclear power plant using Siemens Tecnomatix Plant Simulator and SimTalk. Simulation has a key role in the advancement of critical infrastructure protection. Its use is becoming a common technique for the testing of cyber-attack
prevention measures and for developing improved security techniques [9, 11]. A simple system can be created to represent a larger infrastructure and allow for realistic testing to take place [12]. Simulation can provide an effective role in testing the capabilities infrastructures have in facing the growing cyber-threat. Using emulators can provide an effective ways of developing new approaches to secure critical infrastructures [9].
Using our simulation, we construct realistic data, both when operating under normal circumstances and during an attack scenario. We collect the data from the simulation using observers and then extract features which can be used to classify the data. Using this data, a pattern of behaviour is formed to act as an inference model. From this model, we are subsequently able to identify attacks on the system using mathematical classification techniques and computational algorithms, to identify changes in activity.
The remainder of the paper is as follows. Section 2 presents our approach for the use of behavioural observation for supporting critical infrastructure security. Section 3 details the development of our power plant simulation and data construction. Section 4 details the data analysis and Section 5 discusses its classification. An evaluation of the results is discussed in Section 6. The paper is concluded in Section 7.
2. SYSTEM APPROACH
Given their highly sensitive nature, organisations are often unwilling to part with data or detailed information about how their systems function. This poses difficulties for independent researchers and security companies to find an effective way of developing new approaches to securing critical infrastructures. Furthermore, not only is effective security costly, the requirements individual critical infrastructures have are often unique meaning their security systems have to be tailored to match their specific needs. As a result of these factors, simulation can play a key role in the advancement of security measures in a cheap, safe and effective way.
The recognition that simulation is the best approach to preventing cyber-attacks and improving responses is clearly
identified as the best way forward by governments and organisations around the globe [9]. Using simulation is beneficial in that it can be an effective tool for implementing new approaches to security in a realistic environment. It can also provide an insight into how effective a new approach to security would be and provide proof of applicability and performance evaluation.
In our research to date, we have explored the use of behavioural observation for critical infrastructure security support [1, 2, 3, 4,]. However, in order do this; a significant amount of data is required. For that reason, a simulated critical infrastructure is essential to provide the data needed for testing and to develop our system. In this section, an overview of the approach for using behaviour observation to support security is presented. Our approach monitors the operations of an infrastructure and identifies any abnormalities, which occur in its operation, as a result of, an attack on the system.
Patterns of behaviour are monitored, in real-time, and through the use of data classification, threats to the system, caused by changes in the patterns, are identified.
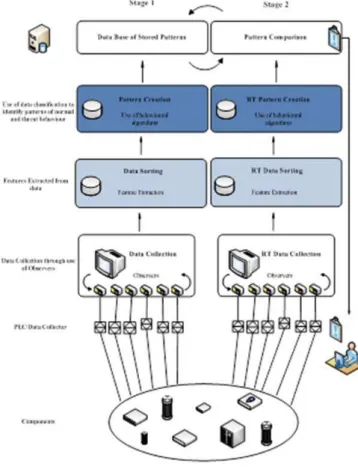
Fig. 1. System Design
Our approach involves two stages. The first stage is the development of a database of normal behaviour for the system. Using observers to collect data from various components in the system when it is functioning normally, a database of expected system behaviour is constructed. The collected data then has features extracted from it. The features are
abstractions of the data [8]. Using the features, patterns of data are created using data classification.
Stage two is the comparing of real-time behaviour with a database of known patterns of correct behaviour in order to identify changes in behaviour as a result of anomalous activity. Figure 1 displays this approach. In both cases, data is collected from the components using observers. The use of observers prevents the operator or an analysis engine from being overwhelmed with data because data is filtered and customised by the observer. The observers extract the features from the data. (The features which are extracted are discussed in Section 3).
3. DATA CONSTRUCTION
As critical infrastructure data is highly sensitive, it is clear that simulation can provide realistic data without being restricted by security constraints. For the purposes of our research, a large data set of realistic critical infrastructure behaviour is created. In order to construct the data, a simulation of a nuclear power plant is crucial. This section presents the development of a simulation of a nuclear power plant and its use for data construction. Attacking a nuclear power plant is the doorway to causing a huge impact. For that reason, we felt that developing a simulation environment representation of a nuclear power plant would be ideal.
All other critical infrastructures depend on power plants functioning and, given their clear importance, realistic data is sensitive and hard to come by. Not only that, the impact of an orchestrated attack on a nuclear power plant could have serious consequences due to the nuclear element involved [10]. A successful attack could not only affect the population but also the environment. Nuclear power plants are prime targets for cyber-attacks [10].
3.1 Simulation
The simulation design consists of an external water source, two water storage tanks, two pumps, a nuclear reactor and a steam generator. Pipes are also included, which carry the water and steam to and from the water tanks and reactor. The design is based on a nuclear power plant which would contain each of the components in the design.
Figure 2 displays an overview of the whole system. It can be broken down into four main groups of objects. The groups include:
1. A Water Source: The production of water is supplied by three sources. Two infinite sources, representing a lake or ocean, and one water tower. The water introduced into this simulation requires filtering before it can be sent to the water tanks. The generation of impurities in the water was set to 1% meaning that the level of discrepancies remained small but had to be monitored. The water tower has a limited production source of water, which can only supply for the duration of 10 hours. 1 unit of water represents 1 litre in our system. The water supplied is fed into one large pipe, which is then filtered for impurities before being pumped into the Water Tanks.
2. Two Water Tanks: These consist of two storage tanks, with a pipe to and from each tank. The tanks act as a place for the water to collect and effectively act as a way of controlling the water flow to the reactor. The water distribution is controlled by a Flow Control which gives tank 1 priority over tank 2. This, in effect, makes tank 2 act as an overflow for when tank 1 gets too full. The water is then pumped to the Reactor by two pumps, one for each tank.
3. A Reactor: This combines the intake of water with heat from a nuclear reaction to produce steam and feed it to a generator. A source generates the Nuclear Reaction. It is combined with the units of water in an assembly station to produce heat. In a nuclear power plant the water acts as a coolant for the reactor, some water is therefore, recaptured as it is not turned into steam. 4. A Generator: It consists of two steam pipes into which
the reactor feeds steam and a turbine which is turned by the steam entering the system. Each unit of steam turns the generator once.
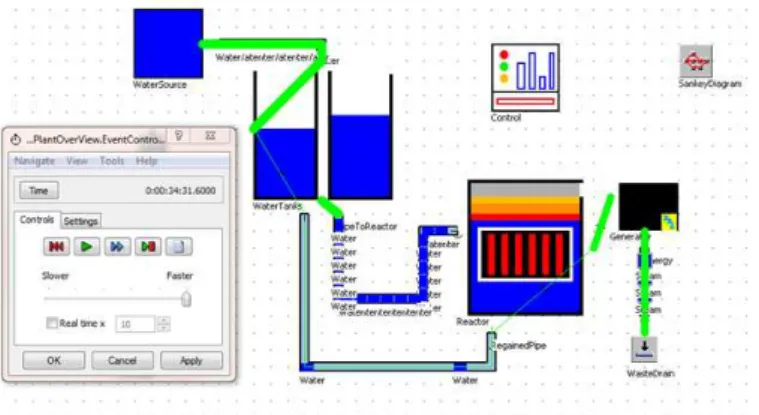
Fig. 3. System Functioning
Each of the groupings are given a graphical icon to represent its function more clearly. They can be opened up to show the different objects which allow the system to function and be interconnected. The simulated power plant consists of
80 components in total, including connections and interfaces, as figure 2 displays.
When linked together, the system functions, as shown in Figure 3. The individual blue blocks represent a visualisation of material flow. In this case, they are units of water travelling through a network of pipes in the system. Exiting the generator, units of energy are passed to the output and the energy unit output is monitored.
The flow of material can be demonstrated in a Sankey Diagram of system flow which is a way of visualising the flow of the system. In the case of our simulation, the Sankey diagram shows the flow of water, steam and energy throughout the system. The flow is represented by the thickness of the lines in the diagram in figure 4. The thicker the line, the more traffic passes through the connection.
Fig. 4. Sankey Diagram of Material Flow
As Figure 4 displays, the heaviest traffic can be seen on the pipes heading into the reactor and the energy output pipe.
3.2 Behaviour Analysis
The behaviour of the system can be analysed at any time, but for the purposes of our research, observers were inserted to collect data from specified components. Taking pipe4 as an example, an inserted TimeSequence acts as an observer, and it records the values for the number of units of water passing through pipe4. Active sampling was done every 0.25 seconds. 4 Hz. From these components we extracted features.
The features we use comprise of aspects which identify the system and regular occurrences in system behaviour. Overall water volumes, steam output and energy creation are recorded as features. In total we take 9 features from the system as a whole including the mean, max and min values every hour for:
1. Water in system 2. Steam in system
3. Energy or Reaction in system
In addition to the 9 system features, 3 features from 10 components in the system are recorded. The features collected from the components include aspects such as:
2. Mean level
3. Number of times 0 recorded
In this paper, we collect data from 10 components in the system, resulting in the creation of 39 features in total: 9 system features and 30 component features. These features were chosen because they represent characteristics of the system behaviour.
In order for our data classification to be effective both normal behaviour data and attack data is needed. Using our simulation attack data was constructed by implementing a failure to the steam pipes which would occur 50% of the time during runtime. This results in each steam pipe turning off and on during the simulation and causing a knock-on effect throughout the rest of the system, which will be highlighted in Section 4.
Random failures are implementing an Availability Percentage. The Availability Percentage refers to the chances of a machine or components being ready to use at any given time taking into account failures and blockages, which is calculated using the formula:
Availability = MTBF/(MTBF+MTTR)
(1) Where MTTR is the Mean Time To Repair and MTBF is the Mean Time Between Failures.
Due to the fact that power plant systems are designed to be enduring, the failure of key components such as the reactor, water pumps and Flow Controls, is ordinarily set at 0.1 per cent for the simulation, meaning that any naturally occurring failures in the system would be minimal. This was done to make the system behaves differently each time it runs and to account for minor system faults which occur in real-life critical infrastructures.
4. DATA ANALYSIS
The types of data the system can construct includes: performance data, material flow data, re-source allocation, and system load data.
4.1 Observer for data collection
The data the observers collect in our simulation refer to the units of water and is sampled at 4Hz (which is every 0.25 of a second). Therefore the dataset which is generated is extremely large after one simulated day and consists of 366,000 records of data for each component.
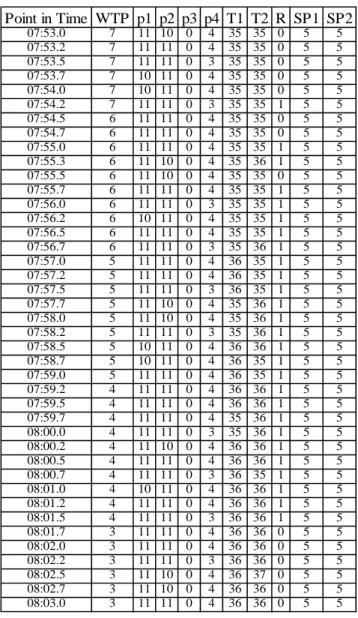
Table 1 displays a sample of the flow of water, where the value refers to the number of units of water being processed by the component at a given time. For example, between the times 7:53.0 and 7:56.0, p4 the amount of units of water changes between 3 and 4. In the data sample displayed in table 1, above 10 components are displayed in abbreviation format.
In an industrial environment, real-time monitoring is essential. Large numbers of physical parameters, such as temperatures, pressure, speed and flow rate factors must be
taken into account. Using observational services would allow for fast identification of anomalies by monitoring the system functions and recognising patterns of behaviour.
Using this data we propose a behavioural-based observation system which supports security in critical infrastructures. The data constructed by the simulation is used for creating an inference model of system behaviour. In order to detect threats to the system, such as cyber-attacks, we identify changes in patterns of activity using data classification techniques presented in Section 5.
Table 1 Normal Behaviour Data
Each component is explained below:
1. WTP (Water Tower Pipe): the WTP provides a fixed amount of water to the system every hour of the simulation.
2. P1 (Pipe 1): P1 connects the first infinite water source to the water filter.
3. P2 (Pipe 2): Similarly to P1, P2 connects the second infinite water source to the water filter.
Point in Time WTP p1 p2 p3 p4 T1 T2 R SP1 SP2 07:53.0 7 11 10 0 4 35 35 0 5 5 07:53.2 7 11 11 0 4 35 35 0 5 5 07:53.5 7 11 11 0 3 35 35 0 5 5 07:53.7 7 10 11 0 4 35 35 0 5 5 07:54.0 7 10 11 0 4 35 35 0 5 5 07:54.2 7 11 11 0 3 35 35 1 5 5 07:54.5 6 11 11 0 4 35 35 0 5 5 07:54.7 6 11 11 0 4 35 35 0 5 5 07:55.0 6 11 11 0 4 35 35 1 5 5 07:55.3 6 11 10 0 4 35 36 1 5 5 07:55.5 6 11 10 0 4 35 35 0 5 5 07:55.7 6 11 11 0 4 35 35 1 5 5 07:56.0 6 11 11 0 3 35 35 1 5 5 07:56.2 6 10 11 0 4 35 35 1 5 5 07:56.5 6 11 11 0 4 35 35 1 5 5 07:56.7 6 11 11 0 3 35 36 1 5 5 07:57.0 5 11 11 0 4 36 35 1 5 5 07:57.2 5 11 11 0 4 36 35 1 5 5 07:57.5 5 11 11 0 3 36 35 1 5 5 07:57.7 5 11 10 0 4 35 36 1 5 5 07:58.0 5 11 10 0 4 35 36 1 5 5 07:58.2 5 11 11 0 3 35 36 1 5 5 07:58.5 5 10 11 0 4 36 36 1 5 5 07:58.7 5 10 11 0 4 36 35 1 5 5 07:59.0 5 11 11 0 4 36 35 1 5 5 07:59.2 4 11 11 0 4 36 36 1 5 5 07:59.5 4 11 11 0 4 36 36 1 5 5 07:59.7 4 11 11 0 4 35 36 1 5 5 08:00.0 4 11 11 0 3 35 36 1 5 5 08:00.2 4 11 10 0 4 36 36 1 5 5 08:00.5 4 11 11 0 4 36 36 1 5 5 08:00.7 4 11 11 0 3 36 35 1 5 5 08:01.0 4 10 11 0 4 36 36 1 5 5 08:01.2 4 11 11 0 4 36 36 1 5 5 08:01.5 4 11 11 0 3 36 36 1 5 5 08:01.7 3 11 11 0 4 36 36 0 5 5 08:02.0 3 11 11 0 4 36 36 0 5 5 08:02.2 3 11 11 0 3 36 36 0 5 5 08:02.5 3 11 10 0 4 36 37 0 5 5 08:02.7 3 11 10 0 4 36 36 0 5 5 08:03.0 3 11 11 0 4 36 36 0 5 5
4. P3 (Pipe 3): P3 sends the filtered water impurities to the waste.
5. P4 (Pipe 4): P4 connects the water sources to the water tanks.
6. T1 (Water Tank 1): Water is divided evenly between both water storage tanks. However, T1 is the primary water tank for the system. Both tanks store the water which is supplied to the reactor core.
7. T2 (Water Tank 2): The second water tank also stores water produced by the water sources. The level in both tanks regularly increases and decreases during simulation.
8. R (Reactor): In the Reactor core, A source generates the Nuclear Reaction. It is combined with the units of water in an assembly station to produce heat. In a nuclear power plant the water acts as a coolant for the reactor, some water is therefore, recaptured as it is not turned into steam.
9. SP1 (Steam Pipe 1): The reactor feeds steam and a turbine which is turned by the steam entering the system. Each unit of steam turns the generator once. 10. SP2 (Steam Pipe 2): Steam Pipe 1 and 2 both have
consistently even levels of steam passing through them to the generator.
The data displayed in Table one refers only to the normal behaviour data, however, as previously mentioned, two data sets were created for both attack and normal behaviour.
Using the features extracted from the two datasets for normal and attack behaviour, records are created. Records of data are used for training an algorithm to learn what normal behaviour is and subsequently identify when normal behaviour is not occurring. 48 records of data are created consisting of 39 features. 24 records used for normal behaviour and 24 for attack behaviour.
The 24 records for each are created as the simulation is operated for a day and every hour the features are extracted from the data collection.
4.2 Normal and Attack Behaviour
The difference between normal behaviour and attack behaviour can be seen both in figures 5 and 6. Two components were chosen as a representation of the differences in data between attack and normal system behaviour.
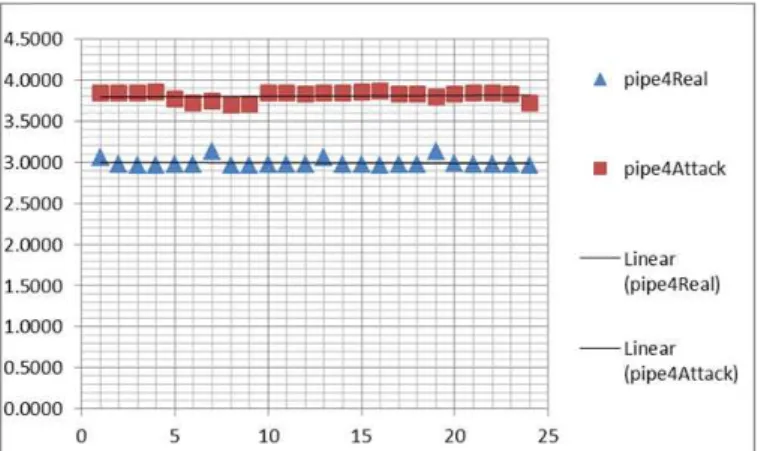
Normal behaviour is represented by the triangles and attack behaviour represented by the squares. The x-axis numbers the records of data taken from 1 to 24. The y-axis displays the mean value for the units of water in the component over an hour.
Figure 5 displays the data constructed for pipe 4. The result of the attack on the steam pipe has an effect which can be clearly seen by the increase in the average value per hour.
Fig. 5. Pipe4 Data Normal and Attack Behaviour
Figure 6 displays the data constructed for pipe3. As before the triangles represent normal behaviour and the squares represent attack behaviour. The change in behaviour as a result of the attack can once again be seen but in the case of this component it is not as clear. The linear line for both normal and attack behaviour, however, shows a clear change once again in the average value.
The aim of our research is to identify these variations in behaviour and alert an operator of subtle changes in patterns of activity which could constitute a threat to the system. Using this data classifiers are trained to automatically detect threats to the system.
In both of the graphs displayed, figures 5 and 6, one feature from two different components is selected to show subtle comparisons with normal and attack behaviour.
Fig. 6. Pipe3 Data Normal and Attack Behaviour
The feature is the mean value of water in the component over the period of an hour. In the case of figure 5 the change in behaviour can be easily identified. However changes in behaviour as a result of an attack taking place can often be subtle and hard to identify, as shown by figure 6. For that reason, data classification is essential.
5. DATA CLASSIFICATION
The aim of our research is to identify these subtle variations in behaviour and alert an operator of changes in patterns of activity which could constitute a threat to the system. The data
is classified to automatically detect threats to the system. If analysed in real-time a change in the pattern of expected behaviour would result in an alarm being signalled and the operator being alerted to the change in activity.
5.1 Data Classification Approach
Using the database of features extracted from the simulation, data classification algorithms were applied to create a model of correct behaviour for the system and the identification of threats. Initially, this was done randomly, by dividing the data, using MATLAB, into a 50% training set with the rest of the 50% assigned to a test set. Using three different classifiers which are discussed below:
Firstly, Linear Discriminant Classifier (LDC) is implemented as it is a technique which can be used when two classes are not normally distributed [13]. It works by sorting or dividing data into groups based on characteristics in order to create a classification. A discriminant function is obtained by monotonic transformation of posterior probabilities. In other words, it performs an ordered transformation of unknown quantities. It does this using the formula:
log | , 1, … ,
(2)
Secondly, we chose a Quadratic Discriminant Classifier (QDC-Bayes Normal-2). This technique works by assuming that the classes are normally distributed with class specific covariance matrices, which is the changing of two random variables. Again, this is achieved using the formula below:
g_(i ) (x)=w_i0+w_i^T x+x^T w_i x
(3)
Thirdly, we used an Uncorrelated Normal Density based Classifier (UDC- Bayes Normal-U). UDC works in a similar way to the QDC classifier but computation of a quadratic classifier, between the classes in the dataset, is done by assuming normal densities with uncorrelated features. Quadric Bayes takes decisions by assuming different normal distribution of data. It leads to quadratic decision boundaries [14].
5.2 Observations
Using the above data classifiers, the results of each initial experiment is displayed in figures 7 to 9 in order of successful data classification.
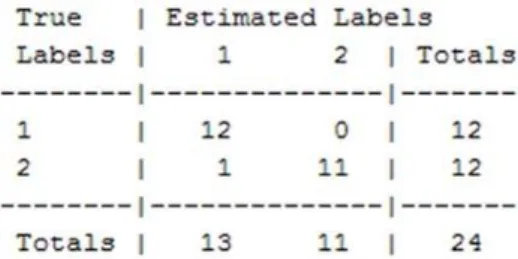
Each figure displays a confusion matrix which determines the distribution of errors across all classes [15]. It displays how successful each technique was at classifying normal and threat behaviour.
It shows true positive, false positive, true negative and false negative values. Diagonal elements show the performance of the classifier while off-diagonal presents errors.
The first confusion matrix, in Figure 7, presents the results for UDC, which shows 95.8% correct results for initial object classification.
Fig. 7 UDC Confusion Matrix 95.8%
In contrast, LDC produces results, which are lower. It is 83.3% successful in accurately classifying the data, into its correct groups. This is shown in the Confusion Matrix in Figure 8.
Fig. 8. LDC Confusion Matrix 83.3%
QDC again gives a lower percentage of 79.2 as shown in Figure 9).
Fig. 9 QDC Confusion Matrix 79.2%
The experiments show that abnormal behaviour is identified for improving the level of security and assisting the operator with attack detections. The best result is achieved using UDC, which has, in this case, 95.8% accurate classification of behaviour.
6. EVALUATION
In order to give a more accurate evaluation of which of the classifiers is most successful and consistent, the experiments were conducted 30 times. The reason the classification
experiments are conducted 30 times is to account for errors and to give consistency [16]. Statisticians identify that experiments conducted 30 times provide an adequate realistic average [16].
In this section, an evaluation of the classification algorithms used is presented along with a discussion on the results and how this approach will benefit critical infrastructure security.
6.1 Results
UDC scored best and is consistent throughout, with a mean average of 97.3 per cent accurate classification of system behaviour data overall.
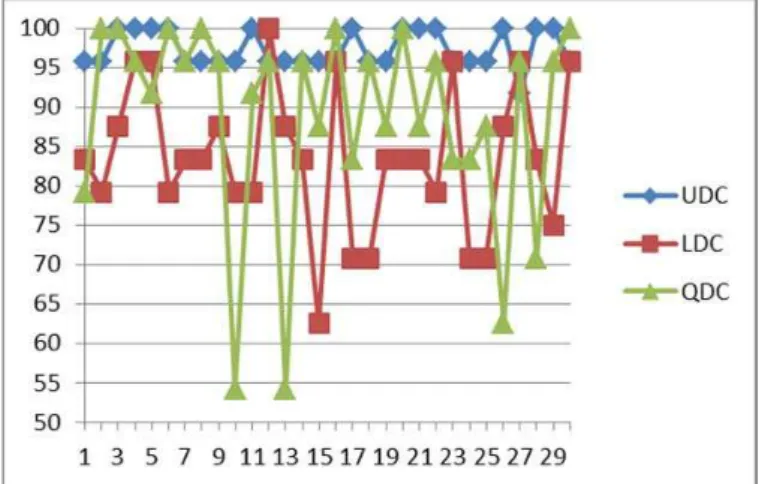
Fig 10 Graph of Classification Comparison
Figure 10 displays a line graph of the varying results of the data classification for the 30 times the classifiers were applied to the data.
Fig 11 Classification Mean Success Percentage
The evaluation of the performance of the three classifiers can be seen in Figure 11, which displays the mean average score of each approach to behavioural anomaly detection.
UDC performs consistently; however, LDC and QDC also achieve high results but have lower consistency. The highest result for each is 100 per cent, although the mode value for LDC (83.3 %), the value which occurs the most frequently, is
significantly lower than it is for both QDC (95.8 %) and UDC (95.8%) analysis. In table 2 the results from each of the 30 experiments for the three classifiers are displayed with the mean average for each presented.
Table 2 Classification Comparisons
6.2 Discussion
In our previous work, the best result was achieved using LDC, which had 80% accurate classification of behaviour [4]. This is a percentage of correctly classified data that is lower than what could be ideal in a critical infrastructure security environment. In the case of critical infrastructures, it is important to achieve a high success rate. In this paper, the results were improved on by the use of more detailed and constructive feature extraction as well as a larger number of features extracted from the system.
Our system will use all three classifiers and provide the operator with the ability to perform various analyses of the system to gain a more accurate insight into whether the system is under attack. Using and comparing three classifiers allows
UDC LDC QDC 1 95.8 83.3 79.2 2 95.8 79.2 100 3 100 87.5 100 4 100 95.8 95.8 5 100 95.8 91.7 6 100 79.2 100 7 95.8 83.3 95.8 8 95.8 83.3 100 9 95.8 87.5 95.8 10 95.8 79.2 54.2 11 100 79.2 91.7 12 95.8 100 95.8 13 95.8 87.5 54.2 14 95.8 83.3 95.8 15 95.8 62.5 87.5 16 95.8 95.8 100 17 100 70.8 83.3 18 95.8 70.8 95.8 19 95.8 83.3 87.5 20 100 83.3 100 21 100 83.3 87.5 22 100 79.2 95.8 23 95.8 95.8 83.3 24 95.8 70.8 83.3 25 95.8 70.8 87.5 26 100 87.5 62.5 27 91.7 95.8 95.8 28 100 83.3 70.8 29 100 75 95.8 30 95.8 95.8 100 Ave 97.3 83.6 88.9
for the number of false positives and false negatives to be kept to a minimum.
The experiments show that abnormal behaviour can be identified for improving the level of security and assisting the operator with attack detections.
6.3 System Function
The system functions by allowing the operator to customise data collection through use of an observer pattern. This is done with a HMI interface where, features to be extracted from system data, can be chosen.
The system enhances critical infrastructure security by monitoring physical behaviour of the system and allowing the operator to detect changes in behaviour which could be the result of an attack taking place. The changes in behaviour are detected using the data classification techniques presented in this paper, from data which is collected by an observer pattern.
7. CONCLUSION AND FUTURE WORK
Our research presents a way of improving critical infrastructure security by identifying threats, and unusual activity, through behavioural observation. Our technique, for critical infrastructure support, adds to the defence in depth that is currently in place. Using our approach, multi-level security is enhanced.
In this paper, a critical infrastructure simulation is used to create substantial datasets. The behaviour of the system remains consistent during each simulation however subtle changes in data patterns can be seen due to normal random variations in system behaviour. Using the data constructed we present a way of improving critical infrastructure security by identifying threats, and unusual activity, through behavioural observation.
The novel contribution of our work includes the collection of physical data from multiple components using an observer pattern and the classification of the data collected using data classification algorithms. Our research focuses on the use of component behaviour rather than network data to develop a system which can accurately identify threats to the system.
Future work will include the development of a hybrid model which would not only look at patterns of normal behaviour and identify deviations but also look at threat data. This combines both signature based detection with anomaly detection to produce a more effective security approach. We
will also investigate how patterns of behaviour, including threats, can be processed in real-time and investigate the use of multiple datasets and different attack scenarios to enhance our results further.
REFERENCES
[1] Removed for blind review. (2012). Behavioural Observation for
Critical Infrastructure Support. 13th Annual Post Graduate Symposium on the Convergence of Telecommunications, Networking and Broadcasting, June 2012.
[2] Removed for blind review. (2012). Operational Support for Critical
Infrastructure Security. ICESS 2012. The 9th IEEE International Conference on Embedded Software and Systems.
[3] Removed for blind review. (2012). Managing Critical Infrastructures
through Behavioural Observation. The 3rd IEEE International Conference on Networked Embedded Systems for Every Application (NESEA) 2012.
[4] Removed for blind review. (2013). Protecting Critical Infrastructures
through Behavioural Observation. Inderscience International Journal of Critical Infrastructures.
[5] Abu-Nimeh, S.; Foo, E.; Fovino, I. N.; Govindarasu, M.; Morris, T. (2013). Cyber Security of Networked Critical Infrastructures [Guest Editorial]. IEEE Network Jorunal Vol 27 (1) pp 3-4.
[6] B. Mukherjee, L. Heberlein and K. Levitt, Network intrusion detection, IEEE Network Journal, 8(3), 26-41, 1994.
[7] Y. Zhang, F. Deng, Z. Chen, Y. Xue and C. Lin, UTM-CM: A Practical Control Mechanism Solution for UTM System, Proceedings of the Second IEEE International Conference on Communications and Mobile Computing, pp. 86-90, 2010.
[8] T. Bass, Intrusion Detection Systems and Multisensor Data Fusion, Communications of the ACM, vol. 43(4), pp. 99-105. 2000.
[9] European Commission Press Release (2010) Digital Agenda: cyber-security experts test defences in first pan-European simulation. IP/10/1459
[10] E. Knapp, J. Broad. Industrial Network Security: Securing Critical Infrastructure Networks for Smart Grid, SCADA and Other Industrial Control Systems. Syngress, Elsevier, Waltham, MA 02451, USA, 2011. [11] European Commission Press Release (2010) Digital Agenda:
cyber-security experts test defences in first pan-European simulation. European Commission. Brussels, Belgium 04.11.2010.
[12] Davis, C., & Tate, J. (2006). SCADA cyber security testbed development. 2006. Power Symposium 2006. NAOS 2006 38th North American. IEEE. doi: 10.1109/NAPS.2006.359615
[13] L. I. Kuncheva, Ed., Combining Pattern Classifiers: Methods and Algorithms. NewYork: John Wiley & Sons, 2004.
[14] F. Lotte, "Study of Electroencephalographic Signal Processing and Classification Techniques towards the use of Brain-Computer Interfaces in Virtual Reality Applications " PhD, National Institute of Applied Sciences in Rennes, Rennes, 2009.
[15] N. D. Marom, L. Rokach, and A. Shmilovici, "Using the confusion matrix for improving ensemble classifiers," in Electrical and Electronics Engineers in Israel (IEEEI), 2010 IEEE 26th Convention of, 2010, pp. 000555-000559.
[16] N. J. Salkind, Statistics for people who (think they) hate statistics , 3rd ed. Sage Publications, 2008.