Trace: Tennessee Research and Creative
Exchange
Doctoral Dissertations Graduate School
5-2008
Evaluating Frame-of-Reference Rater Training
Effectiveness via Performance Schema Accuracy
Charles A. GormanUniversity of Tennessee - Knoxville
This Dissertation is brought to you for free and open access by the Graduate School at Trace: Tennessee Research and Creative Exchange. It has been accepted for inclusion in Doctoral Dissertations by an authorized administrator of Trace: Tennessee Research and Creative Exchange. For more information, please [email protected].
Recommended Citation
Gorman, Charles A., "Evaluating Frame-of-Reference Rater Training Effectiveness via Performance Schema Accuracy. " PhD diss., University of Tennessee, 2008.
I am submitting herewith a dissertation written by Charles A. Gorman entitled "Evaluating Frame-of-Reference Rater Training Effectiveness via Performance Schema Accuracy." I have examined the final electronic copy of this dissertation for form and content and recommend that it be accepted in partial fulfillment of the requirements for the degree of Doctor of Philosophy, with a major in Industrial and Organizational Psychology.
Joan R. Rentsch, Major Professor We have read this dissertation and recommend its acceptance:
David J. Woehr, R. Tom Ladd, Michelle Violanti
Accepted for the Council: Dixie L. Thompson Vice Provost and Dean of the Graduate School (Original signatures are on file with official student records.)
I am submitting herewith a dissertation written by Charles Allen Gorman entitled “Evaluating Frame-of-Reference Rater Training Effectiveness via Performance Schema Accuracy.” I have examined the final electronic copy of this dissertation for form and content and recommend that it be accepted in partial fulfillment of the requirements for the degree of Doctor of Philosophy, with a major in Industrial/Organizational
Psychology.
Joan R. Rentsch____ Major Professor
We have read this dissertation And recommend its acceptance: David J. Woehr_____________ R. Tom Ladd_______________ Michelle Violanti____________
Acceptance for the Council:
Carolyn R. Hodges_______________
Vice Provost and Dean of the Graduate School
EVALUATING FRAME-OF-REFERENCE RATER TRAINING EFFECTIVENESS VIA PERFORMANCE SCHEMA ACCURACY
A Dissertation Presented for the Doctor of Philosophy
Degree
The University of Tennessee, Knoxville
Charles Allen Gorman May 2008
Copyright © 2008 by Charles Allen Gorman All rights reserved.
Dedication
This dissertation is dedicated to the two loves of my life: my baby boy Jackson and his momma Annie. Without the two of you, none of this would be worth it.
Acknowledgments
I wish to thank all those who helped me complete my Doctor of Philosophy degree in Industrial/Organizational Psychology. I would like to thank Joan Rentsch for her help and guidance on this project. I would also like to thank the other members of my committee: Dave Woehr, Tom Ladd, and Michelle Violanti. Special thanks also go to my fellow graduate students for all their help and encouragement, including Lisa Delise, Carrie Blair, Joy Oliver, John Meriac, Josh Ray, Wes Davenport, and Melissa Zullo.
Abstract
Frame-of-reference (FOR) training has been shown to be an effective intervention for improving the accuracy of performance ratings (e.g., Woehr & Huffcutt, 1994). Despite evidence in support of the effectiveness of FOR training, few studies have empirically addressed the ultimate goal of FOR training, which is to train raters to share a common conceptualization of performance (Athey & McIntyre, 1987; Woehr, 1994). The present study tested the hypothesis that FOR-trained raters would possess schemas of
performance after training that are more similar to an expert schema than would control-trained raters. It was also hypothesized that schema accuracy would be positively related to rating accuracy. Results supported these hypotheses. Implications for FOR training research and practice are discussed.
Table of Contents Section Page I. INTRODUCTION...1 Purpose of Investigation... 1 Overview of Manuscript... 2 Rater Training... 2 Frame-of-Reference Training... 3
Cognitive Models of FOR Training Effectiveness... 5
Schemas... 6
Schema Accuracy and Training... 8
The Present Study... 9
II. METHOD...12
Participants... 12
Procedure... 12
Stimulus Materials... 13
Rating Form and Comparison Scores... 15
Rater Training... 18
Dependent Variables... 20
III. RESULTS... 24
Pilot Study... 24
Primary Study... 24
Analysis of Demographic Variables... 29
Rating Accuracy... 30
Performance Dimensions... 31
Performance Schema Accuracy - Rating Accuracy Relationships... 31
Declarative Knowledge... 32
Incremental Validity of Performance Schema Accuracy... 32
IV. DISCUSSION... 35
Summary of Present Study Results... 35
Contributions of the Present Study... 35
Limitations and Strengths of the Present Study... 38
Practical Implications... 40
Conclusion... 41
LIST OF REFERENCES... 43
APPENDICES... 53
List of Tables
Table Page
1. Means and Standard Deviations of Attractiveness Ratings by Candidate …………...16 2. Means and Standard Deviations of Performance Ratings by Dimension……….17 3. Means and Standard Deviations for Pilot Study Items by Training Condition………25 4. Means, Standard Deviations, and Intercorrelations for Study Variables………..26 5. Intercorrelations for Study Variables by Training Condition………...27 6. Means and Standard Deviations of Study Variables by Training Condition…………28 7. Analysis of Variance Results for the Five Accuracy Components………...31 8. Regression Results for the Incremental Validity of PSA………..33
I. Introduction
The evaluation of human performance in work settings has long been an interest of psychological researchers (Arvey & Murphy, 1998). Typically, human performance in organizations is evaluated using subjective performance ratings provided by the
employee’s supervisor(s), peers, and/or subordinates. The accuracy of these ratings is important to the success of a performance rating system, and some researchers have suggested that rating accuracy is the primary goal of performance evaluation (e.g., Werner & Bolino, 1997). Rating accuracy is typically evaluated by comparing an individual’s ratings across dimensions to ratings made by expert raters (i.e., “true”
scores). The closer these ratings are to the true score, the more accurate they are believed to be (Sulsky & Balzer, 1988).
Two general strategies have been advanced as ways of improving rating accuracy: rating scale development and rater training (Woehr & Huffcutt, 1994). With regard to rating scale development, the general finding from this literature was that the type of rating scale used made little difference in terms of improving ratings (Landy & Farr, 1980). Thus, recent research has tended to focus more on rater training as an intervention for improving the accuracy of performance ratings.
Purpose of Investigation
Despite the recent focus on the cognitive operations involved in rater training (e.g., Roch & O’Sullivan, 2003; Schleicher & Day, 1998; Sulsky & Kline, 2007), there has been surprisingly little attention paid to how raters cognitively structure performance information presented during training, or more importantly, the accuracy of these
understanding of the cognitive changes that occur as a result of rater training by examining the efficacy of performance schema accuracy as a measure of frame-of-reference rater training effectiveness.
Overview of Manuscript
This manuscript will begin with a brief discussion of the concept of rater training in general, followed by an introduction to a specific type of rater training, frame-of-reference training. Next, the idea of performance schema accuracy will be discussed as a tool for examining the cognitive changes that have been hypothesized to occur as a result of such training. Furthermore, specific and testable hypotheses will be offered with respect to the effects of frame-of-reference training on performance schema accuracy and rating accuracy. Then, the methods utilized in the present study will be addressed, followed by a summary of the study results. Finally, an interpretation of the study results will be presented, in addition to study limitations and future research directions.
Rater Training
Training raters to improve the accuracy of their ratings has been a major focus of research on performance ratings (Smith, 1986). In general, rater training has been shown to be effective (Spool, 1978) and has shown some promise for improving the accuracy of performance ratings (Woehr & Huffcutt, 1994). One of the first references to rater training in the literature is credited to Bittner (1948), who noted that training provided to American army officers on the performance dimensions of the military evaluation scale improved officers’ ratings of their soldiers’ performance. McIntyre, Smith, and Hassett (1984) identified two major benefits of rater training: (a) to enhance raters’ knowledge and skills for carrying out evaluations, and (b) to motivate raters to use the knowledge
and skills learned in the training program. Researchers have also found that employee perceptions of fairness, accuracy, and credibility of the performance rating process and the rater were positively affected by rater training (e.g., Bannister, 1986: Fulk, Brief, & Barr, 1985). Perhaps of even greater benefit, Werner and Bolino (1997) found that court judges showed some preference for performance rating systems that included rater training programs.
Woehr and Huffcutt’s (1994) quantitative review identified four general
approaches to rater training based on the content of the training: (a) rater error training, (b) performance dimension training, (c) behavioral observation training, and (d) frame-of-reference training. Of these four approaches, frame-frame-of-reference (FOR) training has received a considerable amount of recent research attention due to its relative
effectiveness at improving rating accuracy. Frame-of-Reference Training
FOR training is one of several training approaches that developed as a reaction to the inconsistent results of rater error training. Rater error training requires raters to recognize leniency, halo, and central tendency errors and avoid making these errors in future ratings. However, although rater error training resulted in fewer leniency and halo errors, it inadvertently lowered levels of rating accuracy (Bernardin & Pence, 1980; Landy & Farr, 1980; Smith, 1986). Others have suggested that rater error training actually produces a meaningless redistribution of ratings (Smith, 1986) and that rater errors may not be errors, but rather rater effects that reflect true variance (Arvey & Murphy, 1998; Hedge & Kavanagh, 1988). Moreover, Arvey and Murphy (1998)
suggested that rater errors are relatively unimportant and trivial when it comes to rating accuracy.
In response, Bernardin and Buckley (1981) proposed FOR training as an alternative to rater error training. FOR training focuses on providing raters with performance standards for each dimension to be rated (Woehr & Huffcutt, 1994). Specifically, FOR training involves matching ratee behaviors to their appropriate performance dimensions and correctly judging the effectiveness of those behaviors (Sulsky & Day, 1992, 1994). The ultimate goal of FOR training is to train raters to share and use common conceptualizations of performance when providing their ratings (Athey & McIntyre, 1987; Woehr, 1994). Accordingly, an abundant number of studies have demonstrated the effectiveness of FOR training for improving rating accuracy (Athey & McIntyre, 1987; Bernardin & Pence, 1980; Cardy & Keefe, 1994; Day & Sulsky, 1995; Hauenstein & Foti, 1989; McIntyre et al, 1984; Noonan & Sulsky, 2001; Pulakos, 1984, 1986; Schleicher & Day, 1998; Stamoulis & Hauenstein, 1993; Sulsky & Day, 1992, 1994; Woehr, 1994). In a meta-analytic review of the rater training literature, Woehr and Huffcutt (1994) found an average effect size d of .83 for FOR training compared to control or no training groups.
More recently, research on FOR training has focused on the application of FOR training methods for use in the training of assessment center (AC) assessors in the hopes of improving AC construct validity (e.g., Goodstone & Lopez, 2001; Lievens, 2001; Schleicher, Day, Mayes, & Riggio, 2002). This line of research has found generally positive results. For example, Lievens (2001) found that interrater reliability, rating accuracy, and discriminant validity were better for AC assessors in a FOR training
condition than assessors in control or data-driven training conditions. Likewise, in a study of 58 assessees and 122 assessors, Schleicher et al. (2002) found the FOR training was effective at improving the reliability, accuracy, convergent and discriminant validity, and criterion-related validity of AC ratings.
Cognitive Models of FOR Training Effectiveness
In an effort to explain why FOR training increases rating accuracy, many researchers have borrowed from various social-cognitive models of person perception and memory, including Carlston’s (1992, 1994) associated systems theory (Schleicher & Day, 1998), Klein and Loftus’s (1990) elaboration model (Woehr, 1994), and Wyer and Srull’s (1989) model of person memory and judgment (Day & Sulsky, 1995). Taken together, these models suggest that FOR training works by influencing how ratee information is processed and represented in raters’ memories. The primary evidence pointed to by FOR researchers in support of these models has been based on analyses of recalled performance information. Typically, participants are asked to recall as many behaviors as they can remember after having watched a number of simulations of ratee performance. The organization of recalled information can then be examined using various indexes such as the adjusted ratio of clustering (ARC; Roenker, Thompson, & Brown, 1971), which assesses the extent to which behaviors representing the same performance dimensions are recalled in clusters compared to the amount of clustering expected by chance alone. ARC scores of 1.0 represent perfect clustering, scores of 0.0 represent chance clustering, and negative scores indicate a clustering scheme other than the one being assessed.
Despite the continued use of clustering indexes such as the ARC, these indexes convey a limited amount of information regarding knowledge organization. For example, ARC scores are based only on the order in which behaviors are recalled. More
sophisticated data reduction techniques, such as multidimensional scaling, allow raters to make their own judgments about the interrelationships among behaviors regardless of the order in which they recall the information. The central premise of FOR training is to train raters to share and use common conceptualizations of performance when making ratings. This has only been partially tested. Furthermore, no research has examined the extent to which FOR training improves the accuracy of performance knowledge
structures. The present study seeks to extend the FOR training literature by highlighting how measuring the accuracy of performance knowledge structures (or schemas) can be instrumental in evaluating the success of FOR training. The following section will introduce the concept of a schema and detail its utility as a training outcome variable.
Schemas
The study of knowledge structures is nothing new to the expert-novice literature. Within this literature, several terms for knowledge structures have been used, including semantic nets (e.g., Leinhardt & Smith, 1985), mental models (e.g., Cannon-Bowers, Tannenbaum, Salas, & Converse, 1991), and schemas (e.g., Howell & Cooke, 1989). A schema is a knowledge structure developed from past experience used to organize new information and facilitate understanding (Noble, 1989; Poole, Gray, & Gioia, 1990). With advances in learning and domain-relevant experience, the organization of the schema changes as knowledge moves from declarative to procedural in nature (Cannon-Bowers et al., 1991; Kozlowski, 1998). As individuals become experts in their domain,
their schemas become more pattern-oriented and more highly integrated, and information is stored in larger chunks (Cannon-Bowers et al., 1991; Leinhardt & Smith, 1985). Expert schemas enable individuals to recognize the similarity between new and
previously experienced situations and to adapt old procedures for new situations (Noble, 1989).
The schema perspective has been especially influential in the team cognition literature. The team schema approach developed from simultaneous research on organizational climate, culture, and sense making. Simultaneously, research was developing related to shared mental models based on human factors research. A shared mental model is an organized mental representation of knowledge that is shared among a group of individuals (Cannon-Bowers, Salas, & Converse, 1993; Klimoski &
Mohammed, 1994). The shared mental models approach proposes that greater similarity of individuals’ mental models leads to greater shared expectations within a team, which in turn leads to superior team performance (Rouse, Cannon-Bowers, & Salas, 1992).
Rentsch and Hall (1994) recognized that the term shared mental models inadvertently suggests that individuals’ mental models must be identical to be shared. Thus, the authors introduced the term schema similarity, which refers to the degree to which individuals have similar knowledge structures for organizing and understanding concepts (Rentsch & Klimoski, 2001). The schema similarity approach proposes that individuals’ knowledge structures will become more similar over time with relevant experience, which then leads to greater team effectiveness (Rentsch & Hall, 1994). There is some research evidence that supports the notion of schema similarity. Rentsch,
conceptualized teamwork more precisely and in more abstract terms than less
experienced team members. Similar results were reported in a study by Smith-Jentsch, Campbell, Milanovich, and Reynolds (2001), who noted that more experienced navy personnel had more similar schemas than did less experienced navy personnel. Mathieu, Heffner, Goodwin, Salas, and Cannon-Bowers (2000) observed that team schema
similarity was related to subsequent team process and performance. Moreover, Rentsch and Klimoski (2001) reported that demography, team experience, team member
recruitment, and team size were significantly related to team member schema agreement, which in turn was related to team effectiveness.
Schema Accuracy and Training
If the goal of training is to create experts in the domain of interest, then it would seem beneficial to utilize schemas as training criteria (Cannon-Bowers et al., 1991). To this end, researchers have demonstrated that individual schemas can be manipulated through training (e.g., Koubek, Clarkston, & Calvez, 1994), and that expert schema similarity (or schema accuracy) can be used as a measure of learning during training. For example, in a training program for computer programming and naval decision making, Kraiger, Salas, and Cannon-Bowers (1995) found that trainees’ schemas were
significantly more similar to an expert schema after training than before. Moreover, using a card sorting technique, Smith-Jentsch et al., (2001) noticed that higher ranking navy personnel held mental models of teamwork that were more similar to an empirically derived model of expert team performance than lower ranking personnel. Furthermore, in a study of college students, Day, Arthur, and Gettman (2001) observed that similarity
of trainees’ schemas to an expert schema was correlated with skill acquisition and was predictive of skill retention and transfer.
Not only have schemas been shown to be useful as training criteria, but there is some evidence that schema measures convey unique information related to training not available in traditional measures of learning (Stout, Salas, & Kraiger, 1997). A study by Davis, Curtis, and Tschetter (2003), for example, indicated that schema assessment predicted performance self-efficacy over and above declarative knowledge. Likewise, Dorsey, Campbell, Foster, and Miles (1999) found that schema measures contain unique variance that does not overlap with traditional measures of declarative knowledge.
The Present Study
The concept of schema accuracy holds great promise for the study and application of FOR training. Although the hallmark of FOR training is the development of a
common view of performance that is shared by all raters (Goodstone & Lopez, 2001), there is little evidence that researchers have attempted to measure this shared view of performance. Thus, the research findings discussed in the previous section have clear implications for the current research proposal.
First, the schema similarity approach suggests that individuals’ schemas will become more similar over time with advances in learning (Rentsch & Hall, 1994). Therefore,
Hypothesis 1a: Individuals who receive FOR training will have performance schemas more similar to an expert schema (i.e., more accurate) after training than before training.
In addition, schema similarity research indicates that individuals with more experience on the task of interest have schemas that are more similar to an expert schema of performance than do those with less experience (e.g., Smith-Jentsch et al., 2001). Hence,
Hypothesis 1b: Individuals who receive FOR training will possess performance schemas that are more similar to an expert schema (i.e., more accurate) than will individuals who receive control training.
Second, previous research indicates that FOR training is an effective intervention for improving rating accuracy (e.g., Woehr & Huffcutt, 1994). Thus,
Hypothesis 2: Performance ratings from those who receive FOR training will be more similar to expert ratings (i.e., more accurate) than will performance ratings from those who receive control training.
Third, if FOR training is found to be a successful method of increasing performance schema accuracy, then rating accuracy should be positively related to performance schema accuracy. Hence,
Hypothesis 3: Five measures of rating accuracy will be positively related to performance schema accuracy.
Fourth, prior research has revealed that FOR training improves raters’ knowledge of performance-related information (e.g., Woehr, 1994). Consequently,
Hypothesis 4: Individuals who receive FOR training will score significantly higher on a measure of declarative knowledge than will those who receive control training.
Finally, research suggests that schema measures contain unique variance that does not overlap with traditional measures of declarative knowledge (e.g., Dorsey et al., 1999). Therefore,
Hypothesis 5: Performance schema accuracy will account for a unique amount of variance in all five measures of rating accuracy over and above that of a measure of declarative knowledge.
II. Method Participants
One hundred forty-four undergraduate students at a large southeastern university were solicited to participate in this study. Fifty-six percent of the participants were male, and 90 percent of the participants identified themselves as Caucasian. Sixty percent of participants held at least a part-time job, and 77 percent of participants had no experience rating the job performance of another person. Participants were randomly assigned to either a FOR-training condition (n = 73) or a control-training condition (n = 71). All participants were treated in accordance with the “Ethical Principles of Psychologists and Code of Conduct” (American Psychological Association, 2002).
Procedure
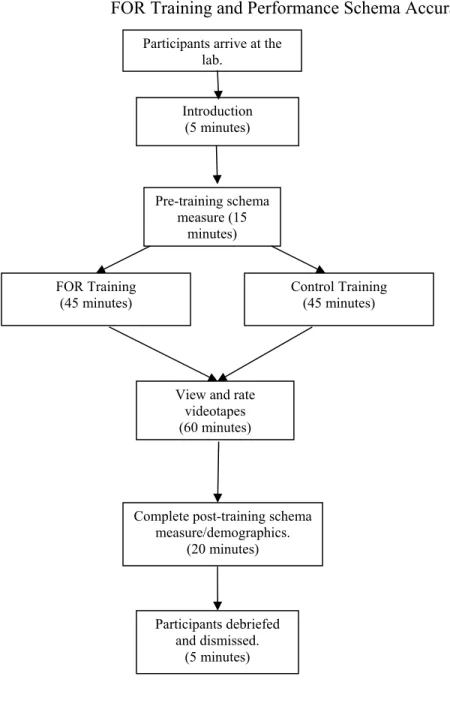
Participants who volunteered to take part in the study were telephoned the evening prior to their scheduled date of participation to remind them of the time and place of the study. Sessions were randomly divided into FOR training or control training conditions, and the attendance of each session ranged from 3 to 10 participants. The videotaped episodes were presented at individual computer terminals. Participants were informed that the purpose of the study was to examine the way people evaluate work performance. Before training, participants received a brief introduction to the session, after which they completed a pre-training performance schema measure. Next,
participants received either FOR or control training. After training, participants completed a measure of declarative knowledge and a post-training schema measure. Participants then viewed four videotaped performance episodes (described below) that were presented in random order across individual participants. During the presentation of
the videotapes, participants recorded specific behaviors as they observed them on a rating form. At the conclusion of each performance episode, participants recorded their ratings in the spaces provided on the form. Upon viewing and rating all of the episodes,
participants completed a demographic questionnaire (extracted and adapted from Organizational Research Group, 1998). (See Appendix A). At the conclusion of the session, each participant was debriefed, thanked, and dismissed. See Figure 1 on page 14 for a timeline of the study methods.
Stimulus Materials
The performance episodes that served as the stimuli in the present study consisted of videotaped performance episodes from a previously conducted developmental
assessment center at a large southeastern university. The videotapes depicted a role play exercise in which an assessment center candidate assumes the role of a manager and interacts with a subordinate, played by a trained assessor. See Appendix B for a character sketch of the role player in the assessment center exercise (extracted and
adapted from Tennessee Assessment Center, 2002). The exercises were designed to elicit behaviors from the candidate that can be grouped into the following performance
dimensions: Analysis, Decisiveness, Leadership, Confrontation, and Sensitivity. See Appendix C for dimension definitions and behavioral examples (extracted and adapted from Tennessee Assessment Center, 2002). These videotapes were rated by subject matter experts in order to develop comparison performance ratings (described below).
The candidates that appeared in the videotapes were executives enrolled in the same class of a professional MBA program at a large southeastern university. These candidates participated in the developmental assessment center as part of their first year
Participants arrive at the lab. Introduction (5 minutes) Pre-training schema measure (15 minutes) FOR Training (45 minutes)
View and rate videotapes (60 minutes)
Complete post-training schema measure/demographics. (20 minutes) Participants debriefed and dismissed. (5 minutes) Control Training (45 minutes)
curriculum. To control for the possibility of confounding effects due to candidate performance level and sex, each participant viewed two episodes of above average performance across most dimensions (one male and one female candidate) and two episodes of below average performance across most dimensions (one male and one female candidate).
To test for the possibility of confounding differences in the performance episodes due to candidate attractiveness, a pilot session was conducted in which six undergraduate participants viewed videotaped images of the candidates. While viewing the images, the participants responded to six items pertaining to the attractiveness of the candidates using a Likert-type scale ranging from 1 (Disagree very much) to 7 (Agree very much). (See Appendix D). The results of this pilot session revealed no significant differences between the candidates in terms of their attractiveness ratings, F(3, 20) = 1.27, ns. See Table 1 on page 16 for the means and standards deviations of the attractiveness ratings by candidate.
Rating Form and Comparison Scores
The rating form consisted of a blank sheet of paper with spaces to record the ratings for each dimension. (See Appendix E). Participants recorded candidate behaviors on their rating forms as they observed them. For each behavior that was recorded,
participants were instructed to place either a +, -, or 0 next to the behavior to indicate whether the behavior was a positive, negative, or neutral behavior. After reviewing each videotape, participants recorded their rating for each dimension in the spaces provided. Each dimension was rated using an 11-point Likert-type rating scale adapted from Tennessee Assessment Center (2002) (1.0 = extremely weak to 5.0 = exceptional). (See
Table 1
Means and Standard Deviations of Attractiveness Ratings by Candidate
Candidate M SD
Male/Below Average Ratings 4.28 .46 Male/Above Average Ratings 5.00 1.07 Female/Below Average Ratings 3.92 1.06 Female/Above Average Ratings 4.75 1.40
Appendix F). An overall evaluation scale was also included (an 11-point Likert-type scale ranging from 1.0 = extremely weak to 5.0 = exceptional).
In order for rating accuracy to be measured, a set of comparison scores was needed. Thus, using procedures recommended by Sulsky and Balzer (1988), three upper level graduate students in industrial and organizational psychology serving as subject matter experts (SMEs) independently observed and rated the videotaped episodes. Each of the SMEs was a trained assessment center assessor and thus, intimately familiar with the role play exercise and the dimensions being rated. After independently rating the performances, the SMEs met to discuss rating differences and, through consensus, generated a set of comparison scores. See Table 2 on page 17 for the consensus ratings for each dimension of each episode.
In addition to providing expert ratings, the SMEs also completed the performance schema instrument (described below). Following the recommendation of Day et al., (2001), the experts’ schema ratings were averaged to generate a referent schema that served as the comparison for evaluating performance schema accuracy.
Table 2
Means and Standard Deviations of Performance Ratings by Dimension
FOR (n = 73) Control (n = 71) Dimension Consensus Expert Rating M SD M SD Analysis Male/Below Average Male/Above Average Female/Below Average Female/Above Average 2.7 4.0 3.5 3.7 2.34 3.79 3.72 3.49 .53 .64 .76 .61 2.80 3.92 3.78 3.26 1.02 .80 .96 .99 Decisiveness Male/Below Average Male/Above Average Female/Below Average Female/Above Average 2.7 3.5 2.7 3.7 2.40 3.60 2.63 3.90 .81 .41 .82 .65 3.02 3.44 3.03 3.28 1.20 .90 1.12 1.08 Leadership Male/Below Average Male/Above Average Female/Below Average Female/Above Average 2.7 3.7 2.7 4.0 2.21 3.91 2.86 3.82 .75 .67 .69 .72 2.72 3.74 3.00 3.39 .98 .88 1.11 1.02 Confrontation Male/Below Average Male/Above Average Female/Below Average Female/Above Average 2.7 4.0 2.5 4.0 2.15 3.54 3.35 3.76 .67 .57 .62 .72 2.28 3.51 3.46 3.38 .87 1.02 1.16 1.12 Sensitivity Male/Below Average Male/Above Average Female/Below Average Female/Above Average 3.5 3.7 3.0 3.7 2.80 3.89 2.59 3.83 .93 .64 .96 .76 3.69 3.78 2.92 3.45 1.06 .88 1.17 .99 Note. FOR = frame of reference.
Rater Training
Participants were randomly assigned to either FOR or control training sessions. All training sessions were conducted by the author using a standard written set of procedures.
FOR training. See Appendix G for the script that was used by the experimenter for the FOR training condition. The FOR training proceeded according to the following set of procedures outlined by Pulakos (1984, 1986): (a) Participants are told that they will evaluate the performance of ratees on separate performance dimensions.
(b) Participants are given rating scales and instructed to read them as the trainer reads the dimension definitions and scale anchors aloud.
(c) The trainer discusses ratee behaviors that illustrate different performance levels for each scale.
(d) Participants are shown a videotape of a practice vignette and are asked to evaluate the ratee using the scales provided.
(e) Ratings are written on a blackboard and discussed by the group of participants. (f) The trainer provides feedback to participants explaining why the ratee should receive a particular rating (target score) on a given dimension.
Accordingly, participants in the FOR training condition were informed that they would be evaluating job performance on the five performance dimensions. The participants were given a copy of the rating form and the trainer read the definition of each dimension and the scale anchors aloud. Next, participants were read a partial list of example
behaviors and asked to indicate which dimension each behavior reflects. See Appendix H for the full list of example behaviors. The trainer then presented and discussed examples of behaviors that represent different levels of performance (i.e., good performance versus poor performance) on each dimension. To illustrate, behaviors representing a 2.0 on a particular dimension were differentiated from behaviors that represent a 4.0 on the same dimension. To further practice matching behaviors and dimensions, participants were given a list of sample behaviors (similar to those seen in the videotapes) and asked to indicate which dimension each behavior reflects (adapted from Tennessee Assessment Center, 2002). (See Appendix I). The trainer then discussed these behaviors and provided feedback as to the dimension and level of performance (weak or effective) represented by each behavior. Participants then observed and rated a practice videotape (also a role play exercise using another assessment center candidate) similar to the ones used as the rating stimuli. To ensure that participants had exposure to examples of both weak and effective performance, the practice videotape consisted of a mixed performance episode where the candidate displayed both positive and negative behaviors across the five dimensions. Next, the trainer collected the ratings, wrote them on the board, and discussed the ratings with the group. Finally, the trainer provided feedback to the participants, explaining why the candidate should have received a particular rating on each dimension according to the ratings of the SMEs. The entire training session lasted about 45 minutes.
Control training. See Appendix J for the script that was used by the experimenter for the control training condition. Participants in the control training were instructed that they would be evaluating job performance on the five performance dimensions. They
were also presented with the rating form and the trainer read over each of the dimension definitions. However, no other specific training was provided. Rather a broad training video on performance appraisal (adapted from Business & Legal Reports, Inc.) was shown. This particular training video was amenable to the control training condition because it used non-technical language and was intended for a broad audience. See Appendix K for the written consent from Business & Legal Reports, Inc., to use their performance appraisal lecture slides for the purposes of this study. The control training session also lasted approximately 45 minutes.
Dependent Variables
Rating accuracy. Using the formulas provided by Sulsky and Balzer (1988), rating accuracy was assessed via Cronbach’s (1955) four indexes of rating accuracy: (a) elevation (E), (b) differential elevation (DE), (c) differential accuracy (DA), and (d) stereotype accuracy (SA). Each index reflects a different portion of the distance between participants’ ratings and the target scores derived from the SMEs. Developed using an analysis of variance (ANOVA) framework, elevation represents the differential grand mean, differential elevation represents the differential main effect of ratees, stereotype accuracy refers to the differential main effect of dimensions, and differential accuracy refers to the differential Ratee x Dimension interaction (Sulsky & Balzer, 1988). Lower scores on these measures represent higher accuracy, whereas higher scores indicate lower levels of accuracy.
Borman’s (1977) differential accuracy (BDA) was also assessed. Borman’s differential accuracy is the average of the z-transformed correlation between a rater’s ratings for each dimension and the corresponding true scores across ratees. Higher scores
on the index reflect better rating accuracy. It has been argued that Borman’s differential accuracy is an index of rating validity as it provides correlational information and is thus insensitive to distances between ratings and true scores (Sulsky & Day, 1994).
Rather than utilizing a single overall accuracy index, multiple rating accuracy indexes were assessed because an overall accuracy index collapses across potentially important information that may be meaningful for understanding the effects of FOR training (Sulsky & Balzer, 1988). Moreover, some individual accuracy components may be more important in certain rating situations that others (Murphy, Garcia, Kerkar, Martin, & Balzer, 1982). However, FOR training should lead to improved accuracy with respect to all of the Cronbach component indexes (Sulsky & Day, 1994), and previous researchers have found increases in all of Cronbach’s indexes as a result of FOR training (e.g., Pulakos, 1986). In terms of the present study, multiple accuracy indexes will be needed to determine the relative influence of each component with respect to
performance schema accuracy.
Performance schema accuracy. Performance schema accuracy (PSA) refers to the degree to which individuals have schemas of performance that are similar to an expert schema of performance. Each participant’s performance schema was measured using a paired comparison computer program in which participants rated the degree of similarity of randomly paired job behavior statements. To select the behaviors to be included in the measure, four trained assessors were asked to rank order the behaviors within each dimension that were most relevant to the role play exercise used in the present study. The three behaviors from each dimension with the highest average rankings were retained for inclusion in the measure, for a total of 15 behavior statements. This resulted in a
measure consisting of 105 randomly paired comparisons (see Appendix L for the instructions for the measure (adapted from Organizational Research Group, 1998) and Appendix M for a list of the behavior statements used in the measure (adapted from Tennessee Assessment Center, 2002)).
To generate the referent, or expert, schema, the three SME similarity data
matrices were first analyzed using multidimensional scaling. The number of dimensions was determined by constraining the number of dimensions to be between 2 and 5 because (a) there were not enough behaviors per dimension to warrant asking for more than 5 dimensions (Kruskal & Wish, 1978), and (b) the number of underlying dimensions should not exceed the number of theoretical dimensions. The 5-dimensional solution provided the best fit with a substantial R2 of .99. Then, consistent with previous research using expert similarity data matrices (e.g., Day et al., 2001), the similarity ratings of the three SMEs were averaged to create the expert data matrix.
PSA was assessed using multidimensional scaling (MDS). MDS is a geometric modeling technique that has been found to be useful for representing the organization of knowledge (e.g., Forgas, 1981; Rentsch et al., 1994). MDS analysis provides an R2 value that indicates the variance accounted for by the dimensions produced in the MDS
solution (Kruskal & Wish, 1978). R2 can be interpreted as goodness-of-fit measure, and values of R2 range from 0 to 1 with higher values reflecting better fit. To measure PSA, individual differences Euclidian distance (INDSCAL) MDS analyses were conducted on the SME similarity data matrix and each participant’s similarity data matrix. The
resulting R2 value for each participant was operationalized as PSA in subsequent analyses.
Declarative knowledge. A behavioral classification measure was used to assess participants’ declarative knowledge. This measure required participants to match 15 managerial behaviors to their respective dimensions. (See Appendix H). The number of correctly classified behaviors was operationalized as declarative knowledge in
III. Results Pilot Study
To address potential concerns regarding participant fatigue due to the time length of the sessions in the present study, a pilot study was conducted in which 15
undergraduate students participated in a FOR training session, 7 of whom rated only 2 performance episodes and 8 of whom rated all 4 performance episodes. After rating the videotapes, each participant responded to a set of items designed to measure his/her level of fatigue. See Table 3 on page 25 for the list of items used and a summary of the results. Overall, the results of this pilot study revealed no significant increase in the fatigue levels of participants who rated all 4 episodes. Moreover, the two episodes shown in the 2-episode condition were shown last in the 4-2-episode condition, allowing for a test of fatigue-driven rating differences between the two conditions. A comparison of the elevation component of rating accuracy revealed no significant differences in elevation between the 2-episode condition (M = .62, SD = .17) and the 4-episode condition (M = .59, SD = .17), t (13) = .34, ns. Hence, the primary study was conducted as proposed using the original 4 episodes.
Primary Study
Intercorrelations and descriptive statistics for the study variables are reported in Table 4 on page 26. These same intercorrelations are reported separately for FOR- and control-trained participants in Table 5 on page 27. Means and standard deviations are reported separately for each condition in Table 6 on page 28.
Table 3
Means and Standard Deviations for Pilot Study Items by Training Condition
Item 2 videos 4 videos
(n = 7) (n = 8) 1. I felt tired after rating the 2(4) videotapes. 6.57a
(.79)
5.00b
(1.69) 2. I don’t think the quality of my ratings was affected by fatigue. 2.86a
(1.68)
4.88 b
(1.73) 3. 2 (4) videotapes was enough practice for me. 6.14
(1.57) (1.39) 5.25 4. By the end of the 2nd (4th) videotape, I was too tired to
concentrate. (2.06) 3.71 (1.16) 2.75 5. I would have been willing to rate more than 2 (4) videotapes in
this study. (1.25) 1.71 (2.33) 3.00 6. The amount of time I spent rating the videotapes was reasonable. 3.43
(1.81)
5.00 (1.07) Note. Participants responded to each item using a 7-item Likert-type rating scale (1 = disagree very much to 7 = agree very much). Values in parentheses are standard deviations. Means with different subscripts are significantly different at p < .05.
Table 4
Means, Standard Deviations, and Intercorrelations for Study Variables
Variable M SD 1 2 3 4 5 6 7 8 9 10 11 1. Gendera 1.56 .50 - 2. Age 21.44 3.73 .10 - 3. GPA 3.16 .41 .05 -.08 - 4. Rating experience .76 1.72 .11 .06 -.04 - 5. Knowledge score 10.92 2.45 .00 .04 .06 .14 - 6. Eb .73 .22 .03 -.07 -.08 .00 -.39** - 7. DE .40 .20 .05 .03 -.06 .08 -.23** .64** - 8. SA .28 .11 -.09 -.06 -.13 -.10 -.30** .62** .25** - 9. DA .37 .14 .07 -.15 -.16 -.06 -.36** .66** .09 .44** - 10. BDA .76 1.72 -.10 -.02 .11 .02 .40** -.64** -.44** -.44** -.46** - 11. PSA .89 .07 -.09 -.02 -.02 .03 .24** -.26** -.17* -.16* -.18* .31** -
Note. N = 144. GPA = grade point average. Rating experience = total number of times having rated the job performance of
another person. E = elevation. DE = differential elevation. SA = stereotype accuracy. DA = differential accuracy. BDA = Borman’s differential accuracy. PSA = performance schema accuracy.
a 1 = female, 2 = male.
b Correlations with E, DE, SA, and DA are negative because smaller values on these indexes represent greater accuracy.
Table 5
Intercorrelations for Study Variables by Training Condition
Variable 1 2 3 4 5 6 7 8 9 10 11 1. Gendera - .01 .16 .26* .29* -.12 -.07 -.25* .01 . 03 -.03 2. Age .18 - .07 .12 .12 -.17 .06 -.24* -.27** .17 -.06 3. GPA -.09 -.17 - .01 .22 -.24 -.07 -.29* -.32** .21 -.12 4. Rating experience -.05 .01 -.09 - .18 .02 .05 -.02 -.09 .10 .08 5. Knowledge score -.21 -.05 -.02 .11 - -.18 -.08 -.22 -.27* .30* .01 6. Eb .02 .03 -.05 -.04 -.27* - .54** .62** .63** -.57** -.02 7. DE .07 .04 -.15 .17 -.08 .59** - .22 -.09 -.26* -.11 8. SA -.02 .13 -.01 -.28* -.11 .36** -.06 - .44 -.47* .03 9. DA -.01 -.07 -.05 -.01 -.12 .35** -.04 .10 - -.47* .06 10. BDA -.07 .22 .17 -.09 .12 -.29** -.37** -.05 .07 - .08 11. PSA -.05 -.01 .08 .01 .21* -.21* .01 -.14 -.19 .25* -
Note. Frame-of-reference participants (n = 73) are below and control participants (n = 71) are above the diagonal. GPA =
grade point average. Rating experience = total number of times having rated the job performance of another person. E = elevation. DE = differential elevation. SA = stereotype accuracy. DA = differential accuracy. BDA = Borman’s differential accuracy. PSA = performance schema accuracy.
a 1 = female, 2 = male.
b Correlations with E, DE, SA, and DA are negative because smaller values on these indexes represent greater accuracy.
Table 6
Means and Standard Deviations of Study Variables by Training Condition
Variable FOR (n = 73) Control (n = 71) M SD M SD 1. Gendera 1.48 .50 1.63 .49 2. Age 21.52 4.33 21.37 3.02 3. GPA 3.12 .41 3.20 .41 4. Rating experience .77 1.56 .76 1.88 5. Knowledge score 11.93 1.89 9.89 2.53 6. Elevation .61 .12 .86 .23 7. Differential Elevation .32 .14 .48 .22 8. Stereotype Accuracy .24 .08 .32 .13 9. Differential Accuracy .31 .08 .42 .16
10. Borman’s Differential Accuracy 1.07 .44 .44 .55
11. Performance Schema Accuracy .91 .06 .87 .06
Note. FOR = frame of reference. GPA = grade point average. Rating experience = total number of times having rated the job
performance of another person. For elevation, differential elevation, stereotype accuracy, and differential accuracy, small numbers represent greater accuracy. For Borman’s differential accuracy, larger numbers represent greater accuracy.
Analysis of Demographic Variables
Prior to conducting any analyses concerning the study hypotheses, appropriate two-sample tests were conducted on all relevant demographic variables for the FOR-trained group and the control-FOR-trained group. Results of these analyses revealed no significant differences in the two training groups for age, t(142) = .25, gender, χ2(1) = 3.47, race, χ2(3) = .78, GPA, t(142) = 1.12, or rating experience, t(142) = .02.
Performance Schema Accuracy
Hypothesis 1a predicted that PSA would be significantly greater after FOR training than before FOR training. For each individual PSA analysis, the number of dimensions was constrained to be 5 because this was the number of dimensions derived in the expert solution. Hypothesis 2 was tested by conducting a paired-samples t-test on the means of the Fisher-z transformed square roots of the R2 values for FOR-trained
participants pre- and post-training. Results revealed that the mean R2 for the FOR-trained
group was significantly higher after training (M = .90, SD = .06) than before training (M = .87, SD = .03), t(72) = 5.95, p < .001 (one-tailed); Cohen’s d = .90. In contrast, there was no significant change in R2 from pre-training (M = .87, SD = .03) to post-training (M
= .87, SD = .06) for the control-trained group, t(70) = .95, ns. Hence, Hypothesis 1a was fully supported.
Hypothesis 1b predicted that PSA would be significantly greater for participants in the FOR training condition than for participants in the control training condition. To test this hypothesis, an independent-samples t-test was conducted on the means of the Fisher-z transformed square roots of the R2 values for participants in the FOR and control
group (M = .91, SD = .06) was significantly higher than the mean R2 for the
control-trained group (M = .87, SD = .06), t(142) = 4.30, p < .001 (one-tailed); Cohen’s d = .72. Hypothesis 1b was, therefore, fully supported.
Rating Accuracy
Hypothesis 2 predicted that FOR-trained participants would provide more accurate ratings than control-trained participants. As Schleicher et al., (2002) pointed out, because of the conceptual overlap of the five accuracy indexes and their statistically significant intercorrelations (see Table 4), a multivariate framework is more appropriate for testing this hypothesis. Thus, Hypothesis 2 was tested via multivariate analysis of variance, with training (FOR vs. control) as the independent variable and the five rating accuracy indexes as the multiple dependent variables. Hypothesis 4 was fully supported, as results revealed that ratings provided by FOR-trained participants were significantly more accurate than those made by control-trained participants, F(5, 138) = 16.66, p < .001; Wilks’s Λ = .62; partial η2 = .38. A summary of the accuracy means for each
training group is provided in Table 6 on page 28.
A follow-up discriminant analysis revealed one significant eigenvalue, p < .001, with training condition accounting for 100% of the variance in the accuracy composite. The structure coefficients from this analysis indicated that both elevation and BDA were driving the discrimination between the different training conditions (.50 and -.51,
respectively).
Follow-up univariate analyses of variance (ANOVAs) were calculated to estimate the effect size associated with each accuracy dependent variable. A summary of these results is provided in Table 7 on page 31. Overall, the results of this analysis are
Table 7
Analysis of Variance Results for the Five Accuracy Components
Accuracy FOR Control F p R2
Elevation .61 .86 66.23 < .001 .32
Differential elevation .32 .48 24.83 < .001 .15 Stereotype accuracy .24 .32 17.76 < .001 .11 Differential accuracy .31 .42 28.89 < .001 .17 Borman’s differential accuracy 1.07 .44 57.83 < .001 .29 Note. N = 144. For elevation, differential elevation, stereotype accuracy, and differential accuracy, small numbers represent greater accuracy. For Borman’s differential accuracy, larger numbers represent greater accuracy. FOR = frame of reference.
consistent with previous FOR research using assessment center simulations as stimuli (e.g., Schleicher et al., 2002), and they support the ubiquitous research finding that FOR training is an effective approach for improving rating accuracy.
Performance Dimensions
Further corroborating the efficacy of FOR training was the additional finding that FOR-trained participants (M = 4.44, SD = .42) used a significantly larger number of performance dimensions to code candidate behaviors on their rating sheets than did control-trained participants (M = 3.89, SD = .69), t(142) = 5.83, p < .001 (one-tailed); Cohen’s d = .98. This result was obtained by averaging the number of coded
performance dimensions across all four candidates for both training groups. Performance Schema Accuracy - Rating Accuracy Relationships
accuracy indexes. As evidenced in Table 3, this hypothesis was fully supported as PSA correlated positively and significantly with each of the five rating accuracy indexes.1 A closer inspection of Table 4 reveals that these correlations were generally larger in the FOR condition as compared to the control condition. However, none of these differences were statistically significant.
Declarative Knowledge
Hypothesis 4 predicted that FOR-trained participants would score higher on a measure of declarative knowledge than control-trained participants. This hypothesis was tested by conducting an independent-samples t-test on the mean knowledge scores for the two training conditions. Results indicated that FOR-trained participants (M = 11.93, SD
= 1.89) scored significantly higher on the declarative knowledge measure than did control-trained participants (M = 9.89, SD = 2.53), t(142) = 5.50, p < .001 (one-tailed), Cohen’s d = .92. Hypothesis 4 was, thus, fully supported.
Incremental Validity of Performance Schema Accuracy
Finally, Hypothesis 5 predicted that PSA would account for a unique amount of variance in all five measures of rating accuracy over and above that of a measure of declarative knowledge. This hypothesis was tested by conducting hierarchical regression analyses on each index of rating accuracy, whereby the declarative knowledge scores were entered into the regression equation as the first step and PSA was entered as the second step. As evidenced in Table 8 on page 33, PSA accounted for a significant
1 Correlations with elevation, differential elevation, stereotype accuracy, and differential accuracy are
Table 8
Regression Results for the Incremental Validity of PSA
Accuracy Index R R2 ΔR2 Elevation Step 1 Declarative Knowledge .39 .15 Step 2 PSA .42 .18 .03* Differential Elevation Step 1 Declarative Knowledge .23 .05 Step 2 PSA .26 .07 .01 Stereotype Accuracy Step 1 Declarative Knowledge .30 .09 Step 2 PSA .31 .10 .01 Differential Accuracy Step 1 Declarative Knowledge .36 .13 Step 2 PSA .37 .14 .01
Borman’s Differential Accuracy Step 1
Declarative Knowledge .40 .16 Step 2
PSA .46 .21 .05**
Note. N = 144. PSA = performance schema accuracy. *p < .05. **p < .01.
amount of unique variance in elevation and BDA over and above that of declarative knowledge. Thus, partial support was found for Hypothesis 5.
IV. Discussion Summary of Present Study Results
The purpose of the present study was to add to the literature on the cognitive effects of FOR training by examining the influence of FOR training on raters’ schemas of performance. Results of the present study indicated that PSA was greater for FOR-trained raters than control-FOR-trained raters after training, and PSA improved significantly from pre-FOR training to post-FOR training compared to no pre-post improvement in control-trained raters. Moreover, FOR-trained raters provided more accurate ratings than control-trained raters, and PSA was positively associated with multiple indexes of rating accuracy. Finally, FOR-trained raters scored higher on a measure of declarative
knowledge than did control-trained raters, and PSA added incremental variance to the prediction of two indexes of rating accuracy over and above that of a declarative knowledge measure.
Contributions of the Present Study
The results of the present study offer three important contributions to the FOR training literature. First, the present study complements previous work that has examined the extent to which FOR training influences raters’ schemas of performance knowledge. Previous researchers (e.g., Woehr, 1994) have studied rater schemas by analyzing the organization of recalled ratee behaviors. In the present study, a standardized paired comparison technique was utilized because it allowed for an evaluation of raters’ performance schema accuracy relative to an expert model.
Second, the present study is the first to examine the accuracy of FOR-trained rater schemas. Previous studies of the cognitive effects of FOR training are limited in that
they failed to assess the degree to which the cognitive variables that were measured compared to those of experts. This is surprising given that expert ratings have long been used in rater training research as a means of establishing rating accuracy. The present study addressed the issue of expert rater cognition, and perhaps this will prompt rater training researchers to consider experts not only as a source for developing “true” scores, but also as potential resources for evaluating the cognitive effects of training.
Third, the present study is also the first to provide a direct test of the cognitive changes that are hypothesized to occur as a result of FOR training. Previous studies have examined only the post-training cognitive effects of FOR training, inferring the existence of a change based on training-control differences. The results of the present study
provided direct evidence that rater schemas of performance become more accurate as a result of FOR training, whereas control-trained raters showed no increase in schema accuracy. A possible avenue for future research would be to examine changes in rater schemas over time. For example, Sulsky and Day (1994) found that FOR-trained raters provided significantly more accurate ratings than control-trained raters even after a 48-hour delay, and Roch and O’Sullivan (2003) found no significant decay in rating
accuracy after a two-week delay between FOR training and the rating task. Based on the results of the present study, a likely explanation for these findings might be that FOR training fosters the development of relatively stable schemas of performance, which in turn should account for the stability of rating accuracy over time. Further studies in this domain should consider the temporal stability of schema accuracy in addition to rating accuracy.
Results of the present study also further corroborate the vast number of studies documenting the efficacy of FOR training for improving rating accuracy. Specifically, the FOR training effect was strongest for elevation and BDA. There is some debate in the literature as to which components of rating accuracy are most relevant to FOR training. Schleicher and Day (2001), for example, argued that differential accuracy should be the primary component of interest because it directly assesses the degree to which performance is accurately rated per ratee on each dimension. Other studies, however, have found mixed results as to which components were influenced the most by FOR training. Based on results from the previously reviewed FOR training literature, the conflicting results appear to be due, at least in part, to choice of analysis (univariate vs. multivariate), and if multivariate, whether BDA was included in the analysis. In their discussion of these mixed findings, Sulsky and Day (1994) concluded that the specific components that are influenced most are likely to vary across studies. Perhaps future research could help shed some light on this issue by determining under what training conditions each component is most likely to be affected.
One interesting finding that emerged from the present study was the pattern of relatively large correlations between Cronbach’s rating accuracy components. This finding is in contrast to previous research that has indicated these components are empirically independent of one another (e.g., Roach & Gupta, 1992). One explanation for this finding may be found in the design of the present study. To be specific, the rating stimuli used in the present study were chosen to control for possible differences due to performance level. Thus, ratings across each dimension for the above average
dimension for the below average performance level candidates (see Table 2). This may have led to the large correlations between the elevation component and the other
accuracy components because raters were distinguishing between overall levels of ratee performance but were not making fine-grained distinctions between individual ratees and dimensions. It is not surprising, then, that elevation and Borman’s differential accuracy showed the largest rating accuracy differences across the two training conditions. It should be noted, however, that significant differences were found for all rating accuracy indexes between the FOR and control training conditions.
A second interesting finding from the present study was that rater age and gender was significantly correlated with some of the components of rating accuracy in the
control training condition, but not in the FOR training condition. It should be noted that a similar pattern of correlations was observed in the Schleicher et al. (2002) study,
although the authors did not attempt to interpret these results. One explanation may be that FOR training’s emphasis on creating a standard with which to judge performance has the added benefit of reducing certain rating biases. In other words, left to their own devices, raters may be more likely to use their own standards for evaluating performance, which then allows for the possibility that extraneous variables will systematically
influence their ratings. Although beyond the scope of the present study, this is an interesting research question that would be better answered by incorporating these demographic variables into the design of an experimental procedure.
Limitations and Strengths of the Present Study
As with any study, one must be cautious in generalizing the results of the present study. The present study utilized student raters who were previously unfamiliar with the
rating format and the rating situation. In addition, raters in actual organizational or assessment center (AC) rating situations would likely be expected to be more invested in the outcome of the training and, perhaps, the training itself. Moreover, the AC candidates that appeared in the stimulus episodes for the present study were relatively homogeneous with respect to some demographic characteristics (e.g., age and race), which may not be representative of the population of ratees who are assessed in some organizations and assessment centers. The inclusion of demographically diverse ratees as rating stimuli is a potentially valuable topic for further research.
Nonetheless, there are many methodological aspects of the present study that can be viewed as improvements upon previous FOR studies. The rating conditions associated with the present laboratory study are more associated with those of assessment centers than other studies. For example, FOR research has historically utilized standardized tapes of teaching performance in which confederate graduate students deliver a lecture that can be classified as generally favorable, unfavorable, or mixed with regards to teaching performance. The present study offers an alternative to this approach by utilizing tapes of actual managers engaged in an actual AC exercise. In contrast,
Schleicher et al. (2002) used tapes of business students participating in an undergraduate AC. Moreover, Schleicher and associates used only the first 5 minutes of their tapes “for control purposes and to keep the rating task manageable” (p. 738). Given that the first 5 minutes of a meeting is likely to revolve around superficial conversation, this can lead to a tremendous reduction in observable behaviors that may be important for making dimensional ratings. Finally, the present research answers, in part, Lievens (2001) call
for FOR training studies to employ additional AC exercises beyond presentation exercises.
Practical Implications
Two clear practical implications for FOR training emerged from the results of the present study. First, the finding that FOR-trained raters have greater levels of PSA than control-trained raters and that PSA predicted two indexes of rating accuracy (elevation and Borman’s differential accuracy) over and above declarative knowledge suggests that PSA may be considered a meaningful outcome variable of FOR training. This
implication is consistent with previous studies that have found that schema measures convey unique information about training that is not available in traditional measures of learning (e.g., Davis et al., 2003; Dorsey et al., 1999; Stout et al., 1997). Results of the present study indicate that PSA conveys meaningful information about the impact of FOR training and the development of rating accuracy. FOR training researchers might consider incorporating performance schema measures as training criteria in addition to traditional indexes of rating accuracy. Such information may be useful for determining which aspects of FOR training contribute most to the development of PSA. Incorporating performance schema measures may also lead to further refinements in the measurement of performance schemas, such as determining the ideal number of dimensions to include and which dimensions result in greater levels of PSA.
Second, PSA may be a potential tool for identifying idiosyncratic raters. Bernardin and Buckley (1981) originally proposed FOR training as a method for identifying raters with idiosyncratic frames of reference, a suggestion that has largely been ignored by FOR training researchers (Hauenstein & Foti, 1989). One reason for this
apparent oversight may be the lack of a standardized method for identifying idiosyncratic raters. PSA may provide useful information as to which raters have idiosyncratic
schemas (frames of reference). This information may be useful for determining which raters may require further training. Moreover, Hauenstein and Foti (1989) recognized that training raters who already possess an appropriate frame of reference may be a waste of training resources. PSA could be assessed pre-training to identify those who already possess an appropriate frame of reference and thus may not benefit from the training. Additional research in this area could be directed toward the development of a model of schema idiosyncrasy, including making an empirical connection between rating
idiosyncrasy and schema idiosyncrasy. Conclusion
Previous research has found consistently positive effects of FOR training for improving rating accuracy. Many researchers have recognized the need for a better understanding of the cognitive mechanisms involved in FOR training, and consequently, numerous FOR studies have been devoted to examining cognitive issues such as rater memory and recall for performance-related information. Despite the encouraging results of these studies, they failed to account for the positive effects of FOR training in AC and other rating situations in which memory and recall are not as important. In all fairness, most of the research on FOR training has been conducted with the intention of
generalizing the results to performance evaluations in organizations, in which memory and recall can become very salient factors with respect to rating accuracy. Only recently has FOR training been applied to AC rating situations, but this shift has signaled the need for more sophisticated cognitive measurement techniques that extend beyond memory
and recall. The results of the present study are only the first step toward attaining a more complete picture of the complex cognitive mechanisms that underlie rating accuracy.
List of References
American Psychological Association (2002). Ethical principles of psychologists and code of conduct. American Psychologist, 57, 1060-1073.
Arvey, R. D., & Murphy, K. R. (1998). Performance evaluation in work settings. Annual Review of Psychology, 49, 141-168.
Athey, T. R., & McIntyre, R. M. (1987). Effect of rater training on rater accuracy: Level of processing theory and social facilitation theory perspectives. Journal of Applied Psychology, 72, 239-244.
Bannister, B. D. (1986). Performance outcome feedback and attributional feedback: Interactive effects on recipient responses. Journal of Applied Psychology, 71, 203-210.
Bernardin, H. J., & Buckley, M. R. (1981). Strategies in rater training. Academy of Management Review, 6, 205-212.
Bernardin, H. J., & Pence, E. C. (1980). Effects of rater training: Creating new response sets and decreasing accuracy. Journal of Applied Psychology, 65, 60-66.
Bittner, R. H. (1948). Developing an industrial merit rating procedure. Personnel Psychology, 1, 403-432.
Borman, W. C. (1977). Consistency of rating accuracy and rating errors in the judgment of human performance. Organizational Behavior and Human Performance, 20, 238-252.
Business & Legal Reports, Inc. (n.d.). Performance appraisals: How to conduct effectively. Retrieved October 3, 2006, from http://hr.blr.com