SURFACE
SURFACE
Dissertations - ALL SURFACE
6-1-2015
Three essays on the impact of student assignment policies
Three essays on the impact of student assignment policies
Sun Jung OhSyracuse University
Follow this and additional works at: https://surface.syr.edu/etd Part of the Social and Behavioral Sciences Commons
Recommended Citation Recommended Citation
Oh, Sun Jung, "Three essays on the impact of student assignment policies" (2015). Dissertations - ALL. 264.
https://surface.syr.edu/etd/264
This Dissertation is brought to you for free and open access by the SURFACE at SURFACE. It has been accepted for inclusion in Dissertations - ALL by an authorized administrator of SURFACE. For more information, please contact surface@syr.edu.
This dissertation is comprised of three essays, which study the impact of student assignment policies. The first two papers investigate the impacts of the removal of school desegregation plans on school racial segregation and on ninth grade repetition rates in the U.S. The third paper examines the impact of the school choice policy in Seoul, Korea on school segregation by academic performance levels.
Over the last two decades, half of school districts that were subject to court desegregation orders in the U.S. were released from those court orders. In response, many school districts modified student assignment plans that had been adopted to integrate public schools. Chapter 1 documents the changes in school desegregation plans and examines the effect of the changes on racial school segregation in approximately 100 school districts. Analysis of student enrollment data from 1988 to 2012 suggests that recent changes in student assignment plans caused a moderate increase in school racial segregation. The results of additional analysis of the types of policy changes suggest that the overall effect on school segregation is driven by the school districts that replaced school desegregation plans with neighborhood-based assignment plans. Districts that replaced race considerations with socioeconomic factors and that expanded school choice options did not experience an increase in school segregation.
Chapter 2 examines the impact of the changes in school desegregation plans documented in the Chapter 1 on ninth grade repetition rates in the same districts. Analysis of data from 1988 to 2012 suggests that the removal of school desegregation plans caused a statistically significant increase in the ninth grade repetition rates of about 0.2 standard deviations. I also find that the
impact on the ninth grade repetition rates is driven by the school districts where school
segregation was substantially increased due to the changes in desegregation policies. The impact on the ninth grade repetition rate is driven by the school districts where school segregation was substantially increased by the changes in desegregation policies. In addition, I find no evidence that the desegregation policy changes affect student movements from other districts or private schools.
Chapter 3 examines the impact of school choice policy in Seoul, Korea on school segregation by student performance levels. Seoul, Korea replaced random assignment of schools with school choice in 2010. By exploiting the policy change, this paper examines the effect of school choice on student sorting by ability. I find that schools became segregated by student performance levels following the implementation of the school choice policy in Seoul. The results of this paper suggest that school choice increases school segregation by academic performance levels even in a racially homogenous country.
THREE ESSAYS ON THE IMPACT OF STUDENT ASSIGNMENT POLICIES
by Sun Jung Oh
M.A., Syracuse University, 2012 M.P.A., Syracuse University, 2011
Dissertation
Submitted in partial fulfillment of the requirements for the degree of Doctor of Philosophy in Social Science.
Syracuse University June 2015
Copyright © Sun Jung Oh 2015 All Rights Reserved
v
Acknowledgements
This research was supported by a grant from the American Educational Research Association which receives funds for its "AERA Grants Program" from the National Science Foundation under Grant #DRL-0941014. Opinions reflect those of the author and do not necessarily reflect those of the granting agencies.
I thank faculty members and friends at Syracuse University and my family and friends in Korea for their support. I especially thank Dr. Robert Bifulco Jr. and Dr. John M. Yinger for their comments on my dissertation. All errors are my own.
vi
Table of Contents
Chapter 1.The end of school desegregation plans: Policy changes and school segregation
1.1 Introduction ……….. 1
1.2 Background ……….. 4
1.3 Types of Policy changes ……….. 12
1.4 Data ……….. 15 1.4.1 Sample ……….. 15 1.4.2 Data Sources ………. 16 1.4.3 Outcome Measures ………... 17 1.4.4 Summary Statistics ………... 19 1.5 Empirical Strategy ……….... 21 1.6 Results ……….. 24 1.6.1 Primary Results ……… 24
1.6.2 School Segregation by School Types ………...26
1.6.3 Robustness and Sensitivity Checks ……….. 28
1.7 Conclusion ………... 32
References ……….. 34
Chapter 2.The impact of ending school desegregation plans on ninth grade repetition rates 2.1 Introduction ……….. 46 2.2 Background ……….. 49 2.3 Theoretical Framework ..……….. 52 2.4 Data ……….. 55 2.4.1 Sample ……….. 55 2.4.2 Data Sources ………. 56 2.4.3 Outcome Measurement …..………...58 2.4.4 Summary Statistics ………... 59 2.5 Empirical Strategy ……….... 62 2.6 Results ……….. 66 2.6.1 Primary Results ……….66
2.6.2 School Segregation and Ninth Grade Repetition Rates………. 68
2.6.3 Ruling out Alternative Explanations ……… 69
2.7 Conclusion ………75
References ……….. 77
Chapter 3. Effects of school choice on student sorting by ability: Evidence from Seoul, Korea 3.1 Introduction ……….. 92 3.2 Literature Review ...……….. 95 3.3 Background …………...………. 97 3.4 Data ……….. 102 3.5 Empirical Strategy ………... 107 3.5.1 School Segregation ……….. 107 3.5.2 School Preference ……… 109 3.6 Results ………. 110
vii
3.6.1 Test of Within-Attendance Zone Balance in Student Distribution in 2009…………. 110
3.6.2 Effects of Autonomous School Opening on Elite Students’ Movement ……….112
3.6.3 School Segregation ……….………. 114
3.6.4 School Preference ……… 118
3.7 Conclusion ………... 121
References ………. 123
viii List of Tables
Table 1-1 List of Sample Districts and Major Policy Changes since 1990 ……….……. 36
Table 1-2 Baseline Statistics of Sample Districts ………... 38
Figure 1-1 Trends in School Segregation ………..39
Table 1-3 Estimated Effects on School Segregation ………... 40
Table 1-4 Estimated Effects on School Segregation by School Types ………... 41
Table 1-5 Estimated Effects on School Segregation: Within-group Analysis ……….. 42
Table 1-6 Estimated Effects on School Segregation – Sensitivity Checks ………... 43
Table 1-7 Estimated Effects on School Segregation – Alternative Classification ……… 44
Table 1-8 Estimated Effects on School Segregation with Alternative Length of Time Period..45
Table 2-1 List of Sample Districts and Major Policy Changes since 1990 ………... 81
Table 2-2 Baseline Statistics of Sample Districts ……….. 83
Table 2-3 Estimated Effects on 9th Grade Repetition Rates ………..84
Table 2-4 Estimated Effects on 9th Grade Repetition Rates – Alternative Specification …..… 85
Table 2-5 Estimated Effects on 9th Grade Repetition Rates by School Segregation Impact ... 86
Table 2-6 Estimated Effects on Public School Enrollment by Race ………..87
Table 2-7 Estimated Effects on Public School Enrollment by Grade ……….... 88
Table 2-8 Estimated Effects on Private School Enrollment by Grade ………..…. 89
Table 2-9 Estimated Effects on 9th Grade Repetition Rates by the Number of Schools …..…..90
Table 2-10 Estimated Effects on 9th Grade Repetition Rates – Tests of Bias by Other Events..91
Figure 3-1 School and Administrative Districts in Seoul (2009) ...……...……....……....….. 125
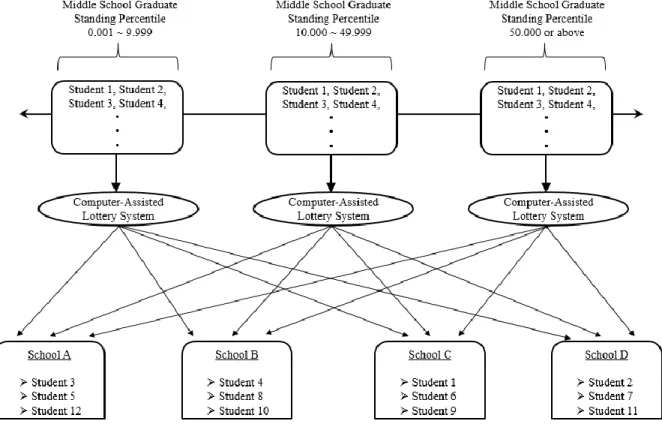
Figure 3-2 Student Random Assignment Mechanisms (2009) ……….………….126
Table 3-1 List of Attendance Zones in Seoul and High School Characteristics in 2009 ...……127
Table 3-2 Changes in School Segregation ……….………….………….……….. 128
Table 3-3 Average Oversubscription Rates of Each Attendance Zone by School Types (2010) 129 Table 3-4 Tests of Within-Attendance Zone Balance in Baseline Achievement (2009) ……... 130
Table 3-5 Changes in Proportions of the Upper-ranked Students between 2009 and 2010 ... 131
Table 3-6 Estimated Effects on School Segregation by Student Academic Performance …... 132
Table 3-7 Estimated Effects on School Segregation using Greater Attendance Zones …….…133
Table 3-8 Estimated Effects on School Segregation using Smaller Attendance Zones …..…...134
Table 3-9 Estimated Effects on School Segregation by Free Lunch Eligibility ……… 135
Table 3-10 School Characteristics by High School Attendance Zones in Seoul (2009) ..……. 136
Chapter 1. The end of school desegregation plans: Policy changes and school segregation
1.1. Introduction
Over the last two decades, half of the school districts that were ever under court
desegregation orders have been released from their obligation to maintain desegregated schools (Reardon, Grewal, Kalogrides, & Greenberg, 2012).1 A number of studies have found racial segregation across schools within a district tends to increase following the district’s release from desegregation court orders (Clotfelter, Vigdor, & Ladd, 2006; Lutz, 2011; Orfield & Eaton, 1996; Reardon et al., 2012). A small number of studies have also examined the effect of these changes on residential location patterns (Billings, Deming, & Rockoff, 2014; Liebowitz & Page, 2014; Lutz, 2011; Weinstein, 2013). No studies find any impact of these changes on residential segregation, but Lutz (2011) and Liebowitz and Page (2014) find residential movements of whites into the districts that removed desegregation plans and into whiter school attendance zones within the same district, respectively.
In addition to the impact on segregation, studies have found that the recent changes in school desegregation plans negatively affect student outcomes. Billings et al. (2014) find that the end of race-based busing in Charlotte-Mecklenburg, North Carolina negatively affects high school test scores for both white and minority students, high school graduation and four-year college attendance for whites, and crime rates for minority males in majority-minority schools. Using approximately 100 school districts, Lutz (2011) also finds that dismissal of a court order leads to small increases in black dropout rates in non-Southern districts. Oh (2015) finds that the
1 According to Reardon et al. (2012), 754 districts with enrollments greater than 2,000 were subject to court
desegregation orders. Among these districts, 372 were released from the orders. Four school districts that were identified as being under court orders as of early 2009 by Reardon et al. (2012) were released from the orders later (Tucson, AZ in 2011; Orange, FL in 2010; Chicago, IL in 2009; Philadelphia, PA in 2009; and Ector, TX in 2010).
recent changes in school desegregation increase the ninth grade repetition rate which is closely related to high school dropout rates.
Previous studies that examined a large number of districts focus solely on court rulings that release districts from desegregation requirements, so they may provide a limited view of the effects of changes in school desegregation plans. First, the changes in school desegregation plans associated with court rulings have been quite varied, and subsequent effects on segregation are likely to depend on the nature of these changes. Examining the average effect of being released from school desegregation orders ignores the differences in student assignment plans adopted by school districts, so focusing on the average effect may miss important policy implications. Second, because the timing of court rulings is often not contemporaneous with changes in school desegregation plans, focusing on court rulings can provide misleading estimates of the effects of these changes. There can be a substantial time gap between the year of the court decision and the changes in school desegregation plans. Initial desegregation plans were often implemented closely after desegregation court orders. Nonetheless, most studies use variation in the years that major school desegregation plans were implemented rather than the years of initial desegregation orders in order to identify the effect of school desegregation (Baum-Snow & Lutz, 2011; Guryan, 2004; Reber, 2005; Weiner, Lutz, & Ludwig, 2009). However, despite a much weaker connection between the timing of court decisions that release a district from school desegregation obligations and the removal of desegregation plans, studies that examined re-segregation have relied solely on variation in the year of the court decision to identify policy effects (Clotfelter et al., 2006; Lutz, 2011; Reardon et al., 2012).
This paper extends previous studies examining the effects of ending court desegregation orders on school segregation in two ways. First, based on in-depth archival research of roughly
100 school districts, I document the year of the major changes in school desegregation plans and classify the types of the policy changes that occurred following release from court-ordered desegregation plans or under continuing desegregation obligations. Second, I examine how ending school desegregation plans has affected school segregation, and whether these effects depend on the type of school assignment policies adopted.
In the sample districts examined here, the most common change to student assignment policies is that school districts ended cross-town busing plans and started assigning students to neighborhood schools. A second, smaller set of school districts have replaced student
assignment plans designed to promote racial balance across schools with the plans designed to promote balance on socioeconomic (SES) factors. A third set of districts have responded to being released from desegregation obligations by expanding parent’s opportunities to choose the public school their child attends (e.g., open enrollment plans, interdistrict transfers, and
specialized magnet schools).
Existing research does not tell us how these various types of changes in student
assignment policies are likely to influence racial segregation across schools. Many have feared that a return to neighborhood assignment policies would lead to the re-segregation of schools by race (Orfield & Eaton, 1996). Studies, however, have tended not to clearly distinguish
neighborhood assignment policies from other types of policy changes. In addition, the impact of the SES balancing plans is unknown. Chaplin (2002) and Kahlenberg (2001) argue that student assignment policies designed to promote balance on SES factors will maintain school racial integration. Using simulations, however, Reardon, Yun, and Kurlaender (2006) find that income integration is no guarantee of racial integration and that the extent of racial integration produced by an income-integration policy will depend on the size of racial income disparities and the
specifics of an income-integration policy. Neither of the studies test these predictions using actual cases, so the impact of using SES factors is not clear. Finally, several studies have found that many programs which expand parental choice of schools increase school segregation (Bifulco, Ladd, & Ross, 2006; Cullen, Jacob, & Levitt, 2005; Hastings, Kain, & Staiger, 2005), but these empirical studies did not specifically examine the effect of replacing school
desegregation plans with the policies that expand school choice options.
Based on econometric models that use variation in the timing of the changes in school assignment policies and control for district-specific trends in outcomes, I find that changes in the assignment policies associated with being released from desegregation obligations increase school racial segregation and that the effect is driven by the districts that adopted neighborhood assignments. The districts that adopted socioeconomic balancing plans and expanded school choice plans did not experience an increase in school segregation. These differential effects on school segregation imply that districts’ choice of student assignment policies is important in maintaining school integration in the post desegregation era.
The paper proceeds as follows. Section 1.2 provides background on the end of school desegregation. Section 1.3 details the changes in school desegregation plans. Section 1.4 describes the data. Section 1.5 explains the empirical strategy, Section 1.6 presents results, and Section 1.7 concludes.
1.2. Background
The history of school desegregation is well-documented (see, among others, Armor, 1995; Clotfelter, 2004). The monumental Brown v. Board of Education2 decision in 1954 established the principal that “[separate] educational facilities are inherently unequal (347 U.S. at 494-495).” In the first decade following the Brown (1954) decision, however, little progress was made
toward reducing segregation. The second Brown3 decision in 1955 delegated direction and oversight of desegregation efforts to federal district courts. While whites in many school districts across the South actively resisted desegregation, many lower courts placed minimal requirements on desegregation plans and often granted district officials delays in implementing those plans. In 1964, only 1.2 percent of black public school students in the eleven
ex-Confederate states attended schools that had any white pupils (Thernstrom & Thernstrom, 1997). The first important landmark on the path to meaningful desegregation after the Brown (1954) decision was the passage of the Civil Rights Act of 1964. The Act authorized the Department of Justice to initiate and join in class-action lawsuits, and empowered the secretary of Health, Education, and Welfare (HEW) to deny federal funding to any school district that it found to be operating segregated schools. When combined with the Elementary and Secondary Education Act of 1965, which promised substantial federal funding to many school districts, the later provision of the Civil Rights Act provided many school districts a financial incentive to desegregate their schools. In addition, the Act prompted HEW to disseminate guidelines on desegregation, which required more significant segregation remedies than many federal district courts had, and which districts were required to satisfy to avoid the threat of losing federal funding.
Next, a series of U.S. Supreme Court rulings starting with the case of Green v. New Kent County (1968)4 established several important legal principles, which effectively required massive desegregation efforts, first across the South and later in other regions. The three most significant principles established in Green (1968) were: (1) school districts found to be operating state-compelled dual systems had “the affirmative duty” to convert to a school system “in which racial
3 349 U.S. 294 (1955). 4 391 U.S. 430 (1968).
discrimination would be eliminated root and branch”; (2) delays in converting school systems were no longer tolerable; and (3) eliminating racial discrimination required establishing a system “without a ‘white’ school and a ‘Negro’ school, but just schools.” The last principle established the requirement that districts eliminate racially identifiable schools. In addition, the Supreme Court recognized the “inextricable connection” between schools and housing and sanctioned the use of transportation as a remedial tool in Swann v. Charlotte-Mecklenburg Board of Education (1971).5
In the years immediately following these decisions, school districts across the South adopted desegregation plans which were often designed to achieve explicit racial balance targets. Racial balance targets could be specified either in terms of the number of predominantly one-race schools, or more frequently, in terms of maximum and/or minimum proportions of black or white students for each school in the district. In small districts, such targets could often be achieved by drawing sufficiently tailored geographic attendance zones (Armor, 1995)—a
technique labelled by Welch and Light (1987) as “rezoning.” In larger districts, achieving racial balance targets often required drawing non-contiguous attendance zones or transporting students between pairs or clusters of schools located in distant neighborhoods (Armor, 1995). These types of school desegregation techniques are referred to by Welch and Light (1987) as “pairing/clustering” plans.6 Implementation of these plans resulted in rapid and dramatic increases in school integration. According to Clotfelter (2004), in the ex-Confederate states of the South, the percentage of black students attending schools that were 90 percent or more black fell from 78 percent in 1968 to 25 percent just four years later. Although changes in the extent of
5402 U.S. 1 (1971).
6 The term “busing” has frequently been used in discussions of school desegregation, but it has no clear meaning.
Any of the desegregation techniques discussed in this section, including those characterized below as using mandatory assignment and those relying on voluntary choices, might result in transportation that could be called “busing.” However, “pairing/clustering” may be the one technique that is most associated with the term “busing.”
segregation in regions outside the South were not as dramatic, many districts outside the South were required to implement desegregation plans that involved rezoning and pairing/clustering provisions similar to the plans implemented in the South.
In the late 1970s, in efforts to reduce whites’ resistance to school desegregation, school districts sought, and courts began to approve, alternative techniques to achieve desegregation goals. For example, in 1977, the San Diego School District in California adopted a plan to integrate schools by encouraging minority students to voluntarily transfer from their
neighborhood schools to predominantly white schools located elsewhere in the district, referred to as “majority-to-minority transfer” programs by Welch and Light (1987), and by attracting white students to “magnet schools”7 in predominantly minority neighborhoods that offered specialized programs. Unlike rezoning and pairing/clustering techniques that rely on mandatory student assignment, these transfer and magnet programs rely on voluntary choices to achieve racial integration goals.
In the mid-1980s, some districts, including Yonkers in New York and San Jose in California adopted “controlled choice” programs that eliminated attendance zones, required parents to select schools, and then assigned students to satisfy racial balancing targets while maximizing assignment of students to the schools their families select. Even though parental choice is emphasized, parents could be denied their first choice of schools in order to satisfy racial balancing targets. Thus, “controlled choice” programs are difficult to categorize as primarily employing either voluntary choice or mandatory assignment techniques.
In addition to establishing the principle of eliminating racially identifiable schools, the Green (1968) decision introduced the concept of “unitary” status. When a school district
7 Magnet schools are public schools “of voluntary enrollment designed to further integration by drawing students
away from their neighborhoods and private schools through distinctive curricula and high quality” (Missouri v. Jenkins, 495 U.S. 33, 110 S. Ct. 1651, 1657 n.6, 109 L. Ed. 2d 31, 1990).
successfully eliminated a dual school system that separates black and white students, it is said to have achieved unitary status. The Green (1968) decision clarified that in order to eliminate the vestiges of discrimination from a dual school system, school districts needed to address all aspects of school operations including (1) student assignment, (2) faculty assignment, (3) staff assignment, (4) transportation, (5) extracurricular activities, and (6) facilities—the so-called “Green factors.” The Green (1968) decision also emphasized that districts found to be operating a dual school system should remain under the supervision of the courts until unitary status is achieved. One result of this principle is that districts under federal court orders to desegregate were often required for many years to seek prior approval from the courts before making any policy changes that might affect one of the Green factors.
The Green (1968) decision left two sets of questions about unitary status unanswered. One set of questions concerned what districts needed to do to achieve unitary status. Particularly controversial was the question of whether a district needed to achieve and maintain specific racial balancing targets in order to achieve unitary status, and if so, for how long did the district need to maintain those targets. A second set of questions concerned the obligations faced by a district that had achieved unitary status. Some language in Green (1968) and subsequent decisions suggests that as long as it did not adopt policy changes with discriminatory intent, a district that had achieved unitary status was not obligated to maintain school desegregation plans or seek to achieve racial balancing targets. However, in several cases, lower courts did continue to oversee and require maintenance of desegregation plans in districts that the courts had
declared unitary.
The Supreme Court remained largely silent on questions of unitary status during the 1970s and 1980s, but finally clarified several issues in two important cases in the early 1990s. In
Dowell v. the Oklahoma City Board of Education (1991),8 the majority opinion of a divided Supreme Court established several influential principles. The first principle was that court supervision of districts that had been found to be operating dual school systems should be
temporary. The second principle was that good faith compliance with desegregation court orders and elimination of the vestiges of past discrimination “to the extent practicable” were sufficient to be declared unitary. The third principle was that, once a district is declared unitary, it no longer needs court approval for policy changes and is not obligated to maintain racial balancing plans. In Freeman v. Pitts (1992),9 the majority opinion further clarified that so long as the district made good faith efforts to comply with court orders and had eliminated vestiges of discrimination to the extent practicable, it did not need to achieve or maintain specific racial balance targets in order to attain unitary status. The Freeman (1992) decision also established that a district could be declared unitary and released from court supervision with respect to one or more of the Green factors without having achieved unitary status on all of the Green factors. That is, a district that was declared unitary on student assignment is not yet considered as achieving unitary status, but it is able to modify student assignment plans that were adopted to desegregate schools. This partial unitary status on student assignment is often the reason why school districts under school desegregation orders frequently modified student assignment plans.10
These decisions in the early 1990s effectively relaxed the requirements for achieving unitary status and allowed districts that had achieved unitary status to move away from student assignment policies designed to achieve racial balancing requirements. In subsequent years, scholars and leading civil rights groups have claimed that these changes had resulted in a retreat
8 498 U.S. 237 (1991). 9 503 U.S. 467 (1992).
from the goals of integrated schooling and in substantial increases in segregation (Orfield & Eaton, 1996). As a result, researchers have been concerned with determining what changes have taken place since the early 1990s in districts that had formerly implemented desegregation plans.
Much of the recent research on this question has focused on the effects of achieving unitary status and being released from desegregation consent decrees and court orders. Clotfelter et al. (2006) examine the 100 largest school districts in the South and Border states over the period 1993 to 2003 during which time the share of districts released from court orders increased from 12 to 45 percent. They find that these districts experienced an increase in the share of minority students attending predominantly non-white schools. Using a national sample of mid- and large-size districts, Lutz (2011) finds that being released from court orders is associated with a moderate increase in racial segregation. Reardon et al. (2012) confirm the Lutz (2011)’s findings on school segregation using a larger sample of districts. Both Lutz (2011) and Reardon et al. (2012) find that the increase in racial segregation is more pronounced in the South.
Rather than focusing on the effect of achieving unitary status, this present study focuses on the effect of actual changes in school assignment policies in districts that were employing meaningful desegregation plans prior to the Dowell (1991) and Freeman (1992) decisions. Focusing on the effects of changes in school assignment policies rather than the effects of being declared unitary is useful for several reasons.
First, there are an important set of districts that voluntarily adopted desegregation plans without ever being subject to court orders. These districts adopted plans to avoid loss of federal funding under provisions of the Civil Rights Act of 1964, in response to administrative actions by the Office for Civil Rights, or in order to avoid anticipated law suits. For instance, Seattle in Washington, Wake County in North Carolina, and Cambridge in Massachusetts, each have
employed widely studied student assignment policies that have been used as models for other districts, but none of these districts have ever been subject to desegregation court orders.
Although the legal obligations of these districts are not directly influenced by the Dowell (1991) and Freeman (1992) rulings, the choices these districts make about student assignment policies can be influenced by the potential legal ramifications of any policy changes and by norms which are shaped by the choices of districts whose legal obligations are more directly influenced by the decisions. Examination of these districts can help to provide more complete evidence on the effects of changes in school desegregation plans.
Second, for several reasons, the timing of actual policy changes often differs substantially from the date that unitary status is achieved. Most districts that were declared unitary prior to the 1990s did not substantially modify their school assignment policies until after the Dowell (1991) and Freeman (1992) rulings clarified that they could abandon their school desegregation plans. In these cases, the date of being declared unitary tells us almost nothing about the timing of policy changes.11 The oversight of desegregation orders by the Office for Civil Rights (OCR) also contributed to maintaining school desegregation plans in some school districts that had been declared unitary.12 Also, the date of being declared unitary and being released from court
supervision is often ambiguous. In some cases, districts may have achieved unitary status with respect to student assignment but still remain under court supervision with respect to other Green
11 For example, when the Omaha Public Schools in Nebraska had attained unitary status in 1984, the district court
stated that the district remains under an unquestionable legal duty to maintain integrated school system, so the district kept desegregation plans in place until 1999.
12 For example, Palm Beach County Schools in Florida achieved unitary status in 1979, but, due to the OCR's
segregation allegation in 1989, the district submitted new desegregation plans to the OCR in 1991. After the OCR stopped monitoring the district in 1999, the district replaced previous desegregations with alternative choice plans in 2000. Also, Fort Wayne Community Schools in Indiana, not considered as achieving unitary status (Reardon et al., 2012), substantially changed its desegregation plans after the OCR dropped all potential segregation charges against the district in 1976 (except the teacher assignment issue).
factors.13 In other cases, even after the Dowell (1991) and Freeman (1992) decisions, districts entered into legally binding agreements to maintain desegregation efforts for some period of time as a condition of being declared unitary, and thus, actual release from court supervision did not occur for a number of years after being declared unitary.14 Finally, it is possible that important changes in a district’s student assignment policies led to legal challenges that resulted in a declaration of unitary status, in which case the relevant policy changes preceded the declaration of unitary status.15
Third, it is important for policy purposes to examine whether the impacts of changes in student assignment policies associated with the achievement of unitary status depend on the type of policies selected in districts. Many districts that formerly were or currently are implementing student assignment policies designed to promote racial school integration face a wide range of assignment policy options. Information on the effects of different kinds of policy options can be an important input into the choices these districts make.
1.3. Types of Policy Changes
Two approaches can be taken to characterize the policy changes that school districts adopted after the Dowell (1991) and Freeman (1992) decisions. Desegregation plans adopted in the two decades following the Green (1968) decision tended to employ rezoning,
pairing/clustering, majority-to-minority transfers, magnet schools, or controlled choice. One
13 For example, the district court ordered that the Tucson Unified School District in Arizona AZ be declared partially
unitary in student assignment in 2008, so the district replaced its desegregation plans before achieving unitary status in 2011.
14For example, in 1994, Judge Barefoot Sanders declared Dallas Independent School District in Texas unitary
pending the elimination of some problems related to school desegregation plans. Nine years after the 1994 decision, Dallas became unitary after addressing some of the issues.
15For example, a Chinese-American parent sued over the admission policy at the competitive Lowell High School in San Francisco, California where Asians had to score higher than other ethnic groups to gain admission because of the court mandate of not having more 40 percent of the enrollment of a school of one ethnic group. In 1999, a federal judge held that the school board could not consider children’s race and ethnicity. In the same year, San Francisco school officials stopped using race and ethnicity as determining factors in assigning students to school, and the district was eventually declared unitary in 2005.
approach to characterizing policy changes is to describe how districts modified or discontinued the use of specific desegregation techniques. This approach presents several challenges. The first problem is that each district uses a unique mix of student assignment techniques and makes unique changes in that mix of techniques. Nearly all desegregation plans employ a number of the tools and techniques listed above in a great variety of combinations, so a district can experience simultaneous changes in several desegregation policies at the same point of time. Thus, it is difficult to develop a small set of policy change types that adequately captures meaningful variation across districts. The second problem is that a district can make frequent changes to its desegregation plan. If a district redrew school attendance zone boundaries to assign students to neighborhood schools after several changes in the boundaries that focused on maintaining racial balancing targets, the approach focusing solely on the assignment techniques would classify each of these changes as the same type of change. The third problem is that it is often difficult to determine which of the several techniques a school district employs is the most important, or even the most extensive part of their desegregation plan. Focusing on the changes in desegregation techniques would not capture the relative importance of the several techniques used in a district.
Another approach to characterizing changes in student assignment policies is to focus on the goals and priorities of the assignment policies. Any student assignment policy needs to balance several disparate objectives: promoting racial integration of schools, maintaining neighborhood schools, avoiding socioeconomic isolation of students, and providing families choices of schools and educational programs. The key aspect of the Dowell (1991) and Freeman (1992) decisions is that these decisions made it easier for school districts to deemphasize the goals of promoting racial integration in their student assignment policies. As several scholars
have suggested (Chaplin, 2002; Frankenberg, 2011; Kahlenberg, 2001; Holley-Walker, 2010; Reardon et al., 2006), one way to characterize changes in student assignment plans is by identifying whether racial integration goals were replaced with the goals of: (1) increasing neighborhood assignments; (2) avoiding the isolation of socioeconomically disadvantaged students; or (3) expanding parental ability to choose schools. Because it avoids the problems created by focusing on the changes in previous assignment techniques and focuses on what are likely to be substantively important distinctions between student assignment policies, this approach is employed in the present study.
This approach to characterizing changes in student assignment policies by the goals is not without challenges. The main challenge is identifying how the priorities embodied in a set of student assignment policies have changed. Usually it is clear when a district has deemphasized the achievement of racial balancing targets. However, a district that deemphasized racial balancing targets might increase the emphasis on several other goals. For example, the
Charlotte-Mecklenburg Schools (CMS) in North Carolina replaced their racial balancing plans with assignment plans that district officials refer to as an “open enrollment” program. The plan allowed parents to rank preferences among public schools, and the district made efforts to assign students to their highest priority schools. The plan, however, also guaranteed students’
admission to their neighborhood school, which greatly limits the ability of students outside of higher income neighborhoods to attend their first choice schools. Although the plan nominally emphasized the goal of expanding choice, the objective of allowing students to attend their neighborhood schools was the more dominant objective in this student assignment plan.
The objectives emphasized in some student assignment plans are unambiguous, but for many districts, judgments about the relative importance of neighborhood schools, socioeconomic
balancing criteria, and parental choice in newly adopted plans have to be made. An extensive appendix to this paper provides a summary description of the changes made in student
assignment plans in each district in the sample and the classification of the policy changes in terms of the three categories listed above.
1.4. Data
This section is divided into four subsections. The first discusses the sample, the second discusses the data sources, the third discusses the outcome measures, and the fourth presents summary statistics.
1.4.1. Sample
A study by Welch and Light (1987), commissioned by the OCR, provides information on a sample of school districts that implemented school desegregation plans. This sample has several advantages for purposes of this study. First, the target population for this study is school districts that had adopted substantial desegregation plans prior to 1991, either by court orders, OCR orders, or voluntary choices. While other data sources provide information on which school districts were subject to court desegregation orders (Logan & Oakley, 2004; Reardon et al., 2012), the dataset assembled by Welch and Light (1987) is the only data source that includes the districts that implemented desegregation plans by OCR orders, state legislation, and
voluntarily. Also, Welch and Light (1987) provide information on the details of school desegregation plans implemented in school districts, which makes it possible to determine the changes in desegregation policies made after 1990. The Welch and Light (1987) sample includes around one half of the school districts that were ever subject to school desegregation
orders with the enrollment greater than 10,000 and with the proportion of black students between 10 and 90 percent in 1990.16
The current study excludes the following districts from the Welch and Light sample. First, the 16 districts in the sample that did not adopt any desegregation plans are excluded. As this study focuses on estimating the effect of major changes in school desegregation plans, it is inappropriate to include districts that did not have desegregation plans. The districts excluded by this restriction are 15 districts with the “No plan” classification and one district (New Orleans in Louisiana) which only gave students options to voluntarily transfer to another school (a
“Freedom of choice” plan by Welch and Light, 1987).17 Second, 11 more districts were excluded because they have a white population of less than 10 percent or a black population of less than 10 percent in the first year that each district appeared in data.18 These exclusions leave a sample of 98 school districts, which are listed in Table 1-1.19
1.4.2. Data Sources
I used several sources to document the exact timing of changes in student assignment policies in the sample districts. First, school desegregation lawsuit decisions were found using Lexis-Nexis, the summary document of unitary status used for Clotfelter et al. (2006), and the data section of “Desegregation Court Cases & School Demographic Data” of the Initiative in
16 Author’s calculation using the data of Reardon et al. (2012)
17 Yonkers in New York and Lorain in Ohio adopted desegregation plans in the late 1980s, so they are treated as
having desegregation plans.
18 Some of these 14 districts are the “No plan” districts and the “Freedom of choice” districts. The full sample
includes eight districts with a white population of less than 10 percent and six districts with a black population of less than 10 percent in the earliest year when student enrollment by race appears in the data are excluded. The eight excluded districts with less than 10% white population are Birmingham, AL; Oakland, CA; Harford, CT; Atlanta, GA; Detroit, MI; New Jersey, NJ; Memphis, TN; and San Antonio, TX. The six excluded districts with less than 10% black population are Tucson, AZ; San Jose, CA; Amarillo, TX; Ector, TX; El Paso, TX; and Raleigh, WV.
School-level information in Georgia, Missouri, and Virginia first appeared in 1993, 1991, and 1992 NCES survey, respectively.
19 New Castle County District in Delaware had been formed by school desegregation order of the U.S. District Court
in 1978 and was treated as a single district by Welch and Light (1987). The county district was divided into four racially balanced districts, Brandywine, Christina, Colonial, and Red Clay in 1981, and I treat the four districts as separate districts.
Spatial Structures in Social Sciences (S4) project at Brown University.20 Second, school district websites,local newspapers, the electronic archives of Education Week, and websites of the Civil Rights Project and the Integration Reports were searched for additional information beyond legal documents.21 Third, district officials were contacted to verify conflicting information on student assignment policies. Appendix A lists key sources of information on school assignment policy for the districts that I classified as adopting any of the three types of policy changes.
The data to measure school segregation come from the Common Core of Data (CCD) of the National Center for Education Statistics (NCES). Public Elementary/Secondary School Universe (PSU) Survey of the CCD has reported student enrollment by race since 1987.22 The primary unit of analysis of this paper is a school district, and the CCD provides school-level data with district identifiers.
1.4.3. Outcome Measures
Segregation is measured using a dissimilarity index, an exposure index, and the
percentage of minority students attending schools that were 90 percent or more minorities. The dissimilarity index is a district-level measure that characterizes the distribution of two groups across the schools within a district. The exposure index measures the degree of potential contact between two groups within the schools of a district. The percentage of minority students in 90-100 percent minority schools measures racial isolation.
The black/white dissimilarity index can be computed as: Di = 1 2 ∑ | bij Bi n j=1 − wij Wi|
20 Duke University Faculty Database: http://fds.duke.edu/db/attachment/282
Spatial Structure in Social Science Project: http://www.s4.brown.edu/schoolsegregation/desegregationdata.htm
21 The Civil Rights Project: http://civilrightsproject.ucla.edu/
The Integration Reports: http://theintegrationreport.wordpress.com/
where bij and wij refer to the number of blacks and whites in school j in district i, respectively, and Bi and Wi refer to the total number of black and white students in the district, respectively. The dissimilarity index measures the degree to which blacks and whites are evenly spread among schools. It ranges from 0 to 1, with higher values representing more segregation and lower values representing a more even distribution of blacks and whites across schools. More
generally, the dissimilarity index can be interpreted as the proportion of blacks (or whites) who would have to move from schools where they are overrepresented to schools where they are underrepresented to achieve a racial composition in each school that matches the racial
composition of the district as a whole. Dissimilarity indices can be computed for any two groups. For instance, the non-white/white dissimilarity index can be computed by replacing the number of blacks with the number of non-whites (blacks and Hispanics) in the equation above.
An index of exposure of black students to white students (denoted as the black/white exposure index) can be computed as:
Ei = ∑ bij Bi n j=1 wij (bij+wij)
where bij, wij, andBi are defined as in the previous equation. This index can be interpreted as the proportion of students who are white in the typical black student’s school, and thus, higher values represent greater exposure of black students to white students. An exposure index captures the likelihood that a person from one group will encounter and interact with a person from another group in a particular setting, in this case a school. Like the non-white/white dissimilarity index, the non-white/white exposure index can be computed by replacing the number of blacks with the number of non-whites (blacks and Hispanics) in the equation above.
As a measure of racial isolation, I also compute the percentage of black students attending schools that were 90 percent or more black and the percentage of non-white students attending schools that were 90 percent or more minorities.
1.4.4. Summary Statistics
Table 1-1 presents the major policy change of each district since 1990. Among the 98 districts in the study sample, 50 districts made changes to their desegregation plans during the 1990s or 2000s. In 29 of these cases, the districts implemented assignment policies focusing on the goal of promoting neighborhood schools; in 9 cases, the districts shifted emphasis from achieving racial balance to achieving socioeconomic balance; and in 12 cases, the districts deemphasized the goal of racial balance and sought to expand parental school choice.
Table 1-2 presents baseline statistics of the sample districts in 1990 or the earliest year that the district appears in data. The mean black/white dissimilarity index of the sample districts is 0.37, which means 37 percent of black students would have to move from schools where black students are overrepresented to schools where they are underrepresented to achieve perfect school integration. The mean non-white/white dissimilarity index is 0.35, which is similar to the black/white dissimilarity index. The mean black/white exposure index is 0.47, and the mean non-white/white exposure index is 0.43. When all school districts in my sample had school desegregation plans, 11 percent of black students attended schools that were 90 percent or more blacks, and 16 percent of non-white students attended schools that were 90 percent or minorities. In terms of student composition, 51 percent of students in the districts are white, 37 percent of students are black, and 17 percent of students attend private schools. The average number of students is approximately 60,000.
Summary statistics by the type of policy change reveal that the districts adopting changes that emphasize neighborhood schools (neighborhood policies) and districts replacing racial balancing consideration with SES balancing consideration (SES policies) are more similar to each other than districts that expanded school choice (choice policies). Among the districts that changed student assignment policies, districts that adopted choice policies have the lowest baseline level of school segregation and the highest percentage of white students.
Districts that did not change assignment policies in the 1990s and 2000s (no change group) are slightly different from the districts that changed the policies. Compared to the districts with any types of policy changes, school districts in the no change group have the highest level of school segregation and the largest student enrollment. However, the racial composition of students of the no change districts is similar to the sample average. In terms of the number of school districts that belongs to each Court of Appeals, there is variation in the number by policy change types. All districts in Circuits 6 and 10 that changed their assignment policies chose neighborhood assignments.
As presented in Table 1-1, the year of the policy change is evenly distributed in the 1990s and 2000s. There are 25 districts that changed their policies in the 1990s, and 25 districts that did so in the 2000s. More districts adopted the neighborhood assignments in the 1990s than in the 2000s. In contrast, slightly more districts replaced their desegregation policies with the SES and the choice policy groups in the 2000s than in the 1990s.
Figure 1 plots the trends in school segregation measured in the non-white/white
dissimilarity index, one of the three segregation measures used in this study.23 Panel A of Figure 1 presents the trends of districts with and without changes in student assignment policies by
23 Figures using the black/white dissimilarity index are similar to the figures using the non-white/white dissimilarity
index. Because Welch and Light (1987) presented the effects of school desegregation plans in terms of the non-white/white dissimilarity index, I use the same measure to draw figures.
school year. The level of school segregation in the 1990s is higher for the districts in the no change group than the districts with any policy changes, which is consistent with the baseline statistics of school segregation presented in Table 1-2. However, school segregation increases rapidly in the districts that changed their policies, and, after 2000, the segregation level of the policy change group becomes higher than the level of the no change group. Panel B of Figure 1 plots the trends in school segregation only for the districts with the policy changes by time since the policy is enacted. This reveals that, in all three policy groups, school segregation trends upward even before the policy change. Panel B of Figure 1 also reveals that school segregation in the neighborhood policy group increased sharply in the first year of the policy change. In the districts that adopted neighborhood assignments, the percent increase in school segregation between the year of the policy change and the previous year is approximately five times greater than the average percent increase in the five years prior to the policy change. There is no discontinuity in the segregation outcome in the districts in both SES and choice policy groups. Panels A and B of Figure 1 suggest that the changes in student assignment policies may have contributed to the increase in school segregation, especially for the districts in the neighborhood policy group. In the next two sections, I formally test the effects of the policy changes on school segregation.
1.5. Empirical Strategy
The empirical strategy of this paper uses the variation in the timing of policy changes across districts to estimate the effect of the changes (an interrupted time series design). This design with trend controls identifies the association between a policy change and a particular outcome by comparing deviations from outcome trends in districts that have implemented the policy change to deviations from outcome trends during the same year in districts that have not
(yet) implemented the policy change. In studies where the introduction of the policy change is initiated at different times in different districts, this design can help to address potential bias from the other events associated with the outcome of interest. Specifically, such time-specific events can threaten causal inferences only if they occurred at the same time as the introduction of the policy change, which is unlikely if the change is introduced at different points in time in different districts and the timing of adoption is unrelated to district characteristics that might influence outcome trends (Shaddish, Cook, & Campbell, 2001).
The interrupted time series design can be estimated by the following regression equation: Yict = β Dict + θi + δi Tt + ct + Zictꞌψ + ɛict. (1) In this equation, i, c, and t index district, court circuit, and year, respectively. Y is the outcome of interest, one of the school segregation measures. D is an indicator of the policy changes that takes the value of 1 in years after the district changed student assignment policies and 0
otherwise. θi is district-fixed effects. A time counter variable (T) takes on a value of 1 for the first year of the time series and increases by one for each subsequent year. δi is the slope of a district specific trend line. ct is circuit specific year fixed-effects which control for year specific events and account for the differences among the circuit courts in the probability of policy changes found by Reardon et al. (2012). The vector of Zict includes controls of total enrollment, percent of white students, percent of black students, and percent of black students squared.24 ɛict is a random error term, and, because observations for multiple years are used for each district, standard errors are clustered at the district levels. β indicates the average effects of the changes in student assignment policies. β specifically tells how much, on average, school segregation measures deviate from district-specific trends following the policy changes controlling for how
24 Because these control variables may have been affected by the assignment policy changes, I also examined the
much the measures in the districts in the same federal circuit without policy changes deviate from their specific time trend in the same years.
The district-specific time trend (T) is included in the regression for the following reasons. First, as shown in Figure 1, the dissimilarity index was trending upwards prior to the changes in school assignment policies. Second, the student demographic controls included in the vector Zict was also trending. Third, unobservable trending factors that affect school segregation might also be correlated with the control variables. Without including the treads, β will capture a spurious relationship between Yict and control variables (Wooldridge, 2003).
The effects by the type of policy change can be estimated by the following regression: Yict = β1 D1ict + β2 D2ict + β3 D3ict + θi + δi Tt + ct + Zictꞌψ + ɛict (2) This equation (2) includes three types of policy changes: increasing neighborhood assignments (D1); avoiding the isolation of socioeconomically disadvantaged students (D2); and expanding parental ability to choose schools (D3). Estimates of the policy change parameters (β1, β2, and β3) indicate how much, on average, a school segregation measure deviates from district-specific trends following the adoption of the corresponding policy change (D1, D2, and D3), controlling for how much the segregation measure in the districts in the same federal circuit without policy changes deviate from their specific time trend in the same years.
I limit the sample to observations that are ten or fewer years prior to or ten or fewer years following the implementation of policy changes for three reasons.25 First, as shown in Panel B of Figure 1, the effect of the changes in student assignment plans seems immediate. Thus, school segregation outcomes that are far away from the year of the policy change may not be
25 Because the number of units (districts) is sufficiently large relative to the number of time periods in the data used
for this study, I can assume rough independence in the cross section (See Wooldridge, 2002). Nonetheless, I also tested the sensitivity of primary findings to changes in the length of the time period used (all years, five years, and three years). These results are robust to the length of the time period used.
relevant for predicting the counterfactual school segregation. Second, for school districts that adopted changes in the early 1990s, using more than ten years prior to the policy changes might reflect the effect of school desegregation plans. Third, using lengthy time-series is susceptible to the inconsistency of standard errors due to auto-correlation and relies more heavily on functional form assumptions.
1.6. Results
This section presents the results of school segregation analysis. Section 1.6.1 presents primary results of school segregation, and Section 1.6.2 presents additional results of school segregation by school types, and Section 1.6.3 presents the results of robustness and sensitivity tests.
1.6.1. Primary Results
Table 1-3 presents estimated effects of student assignment policy changes on school segregation. Even numbered columns present the results of black to white segregation, and odd numbered columns present the results of non-white to white segregation. Average policy effects on school segregation are computed using equation (1) which controls for court circuit-by-year and district fixed-effects with district-specific time-trends.
Panel A of Table 1-3 presents the average effects of assignment policy changes on school segregation. I find that the replacement of school desegregation plans with alternative student assignment plans, on average, increases the black/white school dissimilarity index by 0.03. The estimated effect for non-white to white school segregation is similar to the effect of black to white segregation. Both estimates are statistically significant at the 1 percent level. The average effects of assignment policy changes on school segregation are 8 percent of the sample mean of
the dissimilarity index and 18 to 19 percent of the 1990 cross-sectional standard deviation of the index.
The impact estimates measured using the exposure index are -0.011 for black/white segregation and -0.009 for non-white/white segregation, which indicates that the assignment policy changes decrease the exposure index by about 0.01. The estimates are statistically significant at the 1 percent level. The average effects estimated using the exposure index are 2 percent of the sample mean of the exposure index and 5 to 6 percent of the 1990 cross-sectional standard deviation of the index. The impacts estimated using the exposure index are relatively small, but this measure is sensitive to the changes in demographic changes. If the district-specific trend controls cannot fully address the downward trends in the black/white and non-white/white exposure indices due to the decline in white enrollment in public schools,26 the impact of the assignment policy changes could be underestimated using the measures.
The replacement of school desegregation plans with alternative student assignment plans, on average, increases the percentage of black or non-white students in 90-100 percent black or minority schools by three percentage points. Because the baseline share of such students was small (11 percent for blacks and 16 percent for minorities), the three percentage point increase is a substantial increase in racial isolation.
Using all three measures, I consistently find that the assignment policy changes increased school racial segregation. The magnitude of impacts on school segregation is greater in terms of the changes in the evenness of students’ racial distribution and racial isolation than the changes in the degree of potential contact between different racial groups in schools.
26 “From fall 2001 through fall 2011, the number of White students enrolled in prekindergarten through 12th grade
in U.S. public schools decreased from 28.7 million to 25.6 million, and their share of public school enrollment decreased from 60 to 52 percent” (The Condition of Education, NCES retrieved from
Panel B of Table 1-3 presents the estimated effect of each policy type which is computed using equation (2) with three different policy indicator variables. Estimating effects by each policy type reveals that school segregation increased only in the districts that adopted
neighborhood assignments. The impact estimates indicate that returning to neighborhood school assignments increased the black/white dissimilarity index by 0.056. The estimated effect on the non-white/white dissimilarity index is 0.051 which is slightly smaller than the effect on black to white segregation. The effects of neighborhood assignments are 16 to 17 percent of the sample mean and 38 to 40 percent of the standard deviation. The estimated effects of neighborhood assignments on segregation are more than 80 percent larger than the average effect of the assignment policy changes.
The estimated impacts of neighborhood assignments on school segregation are also larger than the average impacts when measured using either the exposure index or the racial isolation measure. The impact estimates of the neighborhood assignments measured using the exposure index are -0.022 for black/white segregation and -0.018 for non-white/white segregation, which is twice as large as the overall effect of the policy change. In terms of racial isolation, the impact estimates of the neighborhood assignments are also approximately 80 percent larger than the average effects on school segregation. All coefficients of the neighborhood assignments are statistically significant at the 1 percent level. Using all three measures, the impact estimates of adopting socioeconomic balancing policies and expanding school choice policies on school segregation are small in magnitude (less than 0.01) and statistically insignificant.
1.6.2.School Segregation by School Types
School attendance zones are typically smaller for elementary and middle schools than for high schools, so the impacts of neighborhood assignments on school segregation are likely to be
larger for elementary and middle schools than for high schools. Thus, I analyze the impact on school segregation separately for elementary and middle schools and for high schools.27 Table 1-4 presents the results of this analysis. As expected, segregation effects for elementary and middle schools are at least 10 percent larger than the main results measured using all types of schools. The biggest difference between the main results of all types of schools and the results of elementary and middle schools appears when the racial isolation measure is used. The impact estimates measured using the racial isolation measures indicate that the assignment policy changes increase the percentage of minority students attending schools that were 90 percent or more minorities by 7 percentage points, which is 20 percent larger than the main results.
In contrast, segregation effects for high schools are smaller than the main results measured using all types of schools. Consequently, segregation effects for high schools are substantially smaller than the segregation effects for elementary and middle schools. When school segregation is measured using the dissimilarity index, the impact estimates on high school segregation indicate that the overall changes in student assignment policies increase high school segregation by 0.019 and the neighborhood assignments increase high school segregation by 0.032 to 0.036. The magnitude of the impacts is 32 to 43 percent smaller than the main results estimated using all types of schools and 40 to 54 percent smaller than the results estimated using elementary and middle schools. These results are statistically significant at the 1 or 5 percent level depending on the sample used.
When school segregation is measured using the exposure index, the estimated effects on school segregation are only statistically significant for neighborhood assignments. The impacts of neighborhood assignments on high school segregation are 60 to 70 percent smaller than the
27 Segregation indices are computed using schools only serving grades between K and 8 (elementary and middle
impacts of neighborhood assignments on elementary and middle school segregation. The impact estimates measured using the racial isolation measures are small and statistically insignificant. Because a large proportion of minority students drop out from high school, the exposure index and the racial isolation measure are likely to capture both the impact of the assignment policy changes and the impact of the decrease in minority enrollment in high schools on the measures.
Using the dissimilarity index which is least sensitive to the demographic changes, the size of the impact estimates for high school segregation is about half the size of the impact estimates for elementary and middle school segregation. Based on the fact that attendance zones of
elementary and middle schools are geographically smaller than attendance zones of high schools, the results presented in Table 1-4 support that the impact of the assignment policy changes on school segregation is driven by student reallocation across attendance zones.
1.6.3.Robustness and Sensitivity Checks
Table 1-5 presents the impact estimates measured using the districts that adopted the same type of policy. Because school districts with the same type of policy change are likely to be similar to one another, policy effects measured using the districts with the same type of policy change can address the concerns about the endogeneity of student assignment policies. In Table 1-5, the left-hand side columns under the subtitle of “Neighborhood”, the middle columns under the subtitle of “SES”, and the right-hand side columns under the subtitle of “Choice” present the estimated effects measured only using the school districts that implemented neighborhood school assignments, the school districts that implemented socioeconomic balancing policies, and the school districts that expanded school choice policies, respectively.
Depending on the school segregation measure used, the estimated effects of
estimated effects. However, the within-group analysis consistently finds the statistically
significant increase in school segregation regardless of the school segregation measure used. In contrast, in the SES and Choice groups, the assignment policy changes have no impact on school segregation. The estimated effects of the SES balancing and choice policies of the within-group analysis are small and statistically insignificant, which is similar to the main estimate effects. These similar results between the within-group analysis (Table 1-5) and the across-group
analysis (Table 1-3) suggest that the main findings of this paper are not likely to be biased due to the endogeneity of policy types adopted in districts.
Next, I test whether the estimated effects on school segregation are biased due to the subsequent changes in student assignment polices. There are districts that experienced more than one policy change at different points in time, and the characteristics of the subsequent policy change are often different from the characteristics of the initial policy change. Because the main analysis is based on the initial policy change, the estimated effects of each policy option on school segregation may be biased by using the observations after the second policy change that can be classified as a different policy option from the initial policy change. Columns (1) to (6) of Table 1-6 present the results estimated using only observations before the second policy change. The results of this analysis are virtually same as the main results estimated using all the observations, which suggests that the main findings of this paper are not biased due to the
subsequent changes in student assignment plans. These results also suggest that the initial policy change is most important in estimating the impact of the removal of school desegregation plans and subsequent policy changes are not as influential as the initial policy change.
In addition, I test whether the results of the socioeconomic balancing policies are sensitive to including other school districts that implemented the similar policies out of the