CMPO Working Paper Series No. 03/084
Girls Rock, Boys Roll: An Analysis of the Age
14-16 Gender Gap in English Schools
Simon Burgess*
Brendon McConnell**
Carol Propper*
Deborah Wilson
***
CASE, LSE, CEPR and CMPO, The University of Bristol **
CMPO, The University of Bristol
Abstract:
The aim of this paper is to examine gender related differences in performance at age 16. We investigate a number of possible explanations for the underachievement of boys relative to girls, the so-called ‘gender gap’. We employ a national dataset of the matched exam results of the entire cohort of pupils who took Key Stage 3 tests in 1999 and GCSEs in 2001: over half a million pupils in over 3000 schools. Our key result is the sheer consistency of the gender gap, across both the attainment and the ability dis tribution, with regard to both raw outcomes and value added. It is primarily driven by performance differentials in English. We show that it is not related to whether a school performs well or poorly, or whether it is effective or ineffective. Nor is it affected by any of the leading observable school characteristics. The generality of the gender gap suggests that its source is not within-school practice, which in turn means that policy directed at improving such practice may be misplaced. Keywords:education, gender gap
JEL Classification: H4, I2, L3 Acknowledgements
Thanks to the Leverhulme Trust for funding this work through the Leverhulme Centre for Market and Public Organisation, and to the Department for Education and Skills for supplying the data. The views expressed in this paper are our own.
Address for Correspondence Department of Economics University of Bristol 12 Priory Road Bristol BS8 1TN Simon.Burgess@bristol.ac.uk Tel: +44 (0) 117 954 8436 Fax: +44 (0) 117 954 6997
1. Introduction
The differential educational achievements of boys and girls in the UK have generated debate since the 1970s (Ofsted 2003). Early work focused on raising the participation of girls, particularly in the traditional boys’ subjects of maths, science and technology. The recent focus of this debate, however, has been the perceived underachievement of boys relative to their female peers – the so-called ‘gender gap’ – as measured in the UK by results attained at the four Key Stages of the Nationa l Curriculum. The gender gap at age 16 (when pupils take GCSEs) is seen as cause for particular concern, illustrated by the degree of media coverage given to the annual publication of results. While gender-related differences in performance are also of interest internationally (OECD 2003; Elwood and Gipps 1999; Shaw 2002), we focus here on the gender differentials in English secondary schools in measured outcomes at age 16.
The purpose of this paper is to investigate more fully gender differentiated patterns of performance and to go beyond the “average” statistics that grab the headlines. We employ a national dataset of the matched exam results of the entire cohort of approximately half a million pupils who sat the compulsory exams at age 14 (known as Key Stage 3 tests) in 1999 and took school leaving exams at age 16 (these are GCSEs or GNVQs) in 2001. We consider the gender gap, at subject level and in aggregate, with respect to three measures of attainment: the percentage of boys and girls gaining at least 5 GCSEs (or equivalent) at grade C or above (%5A*-C); their total GCSE points and a measure of value added between 14 and 161. We investigate patterns of differential performance both across the attainment (performance at age 16 in GCSEs or GNVQs) distribution and across the ability distribution, as proxied by a pupil’s average performance at Key Stage 3. We compare differences across different types of schools, in terms of good or poor performance, gender mix, admissions policy and percentage of pupils eligible for free school meals. We also consider whether Local Education Authorities (LEAs) have an impact on the gender gap in schools within their boundaries.
1
This first measure is widely used, by the government and the media, to rank schools according to pupils’ performance.
Our key result is that the gender gap is effectively constant across all the ways we cut the data. It is consistent across both the attainment and the ability distributions, whether we use raw GCSE test scores or value added as the outcome measure. It is not affected by school quality, nor by a wide range of observable school characteristics. We sho w that the gender gap is primarily driven by performance differentials in English. We find that it is negatively related to an increase in eligibility for free school meals (a marker of the poverty of pupils attending a school) and to the proportion of boys in the within-school cohort.
The rest of the paper is structured as follows. Section 2 briefly reviews the related literature and section 3 details our dataset. Section 4 presents our results and the final section concludes.
2. Previous Literature
First, we review the evidence on the existence of and changes in the gender gap. We then consider both the potential explanations for and the possible strategies that have been put forward to reduce it.
In England in 2001, girls outperformed boys on average at each Key Stage (DfES 2002a). In all Key Stage 1 tests, taken at age 7, a higher percentage of girls achieved the expected level than boys, with a much larger gap between their respective performances in reading and writing than in mathematics. By the age of 11 (Key Stage 2), girls outperformed boys in English and science, with boys doing slightly better in maths. At Key Stage 3 (age 14) there was no difference in performance in science, but the gender gap was maintained in the other subjects. In 2001 at Key Stage 4 (GCSEs/GNVQs), 44.8% of boys achieved 5 or more passes at grades A*-C compared to 55.4% of girls (DfES 2002b). An analysis of 1995 data found a similar picture across all Key Stages (Arnot et al 1998). Stobart et al (1992) found a gender difference in maths GCSE in favour of boys, but noted that this was steadily decreasing. Certainly by 1999, the gender differential in England in GCSE maths had been reversed (Atkinson and Wilson 2003). Similarly, in Scotland, girls’ relative
performance in Higher Grade maths was better than boys for the first time in 1995 (Powney 1996). Subject level studies of the gender gap reveal it to be greater in English than in maths or science (Arnot et al 1998; Gorard et al 1999; DfES 2000b; Atkinson and Wilson 2003).
There is conflicting evidence on whether the gender gap is widening through time across successive cohorts. The gender gap appears to be narrowing among younger pupils (between KS1 and KS2) (Ofsted 2003). Younger and Warrington (2002) identify a trend of the gap increasing at GCSE between 1988 and 1999, which concurs with the finding of Arnot et al (1998) that girls’ performance improved more rapidly than that of boys between 1984 and 1994. In contrast, Gorard et al (1999) use Welsh data and find evidence that the gap, in terms of aggregate measures of achievement at each Key Stage, has decreased since 1992. With regard to within-cohort changes in the gender gap, Atkinson and Wilson (2003) provide some evidence that the gender gap widens – in favour of girls – during Key Stage 4, i.e. between the ages of 14 and 16.
There is also conflicting evidence regarding which type of students may be driving the average performance statistics. Gorard et al (1999) find that the gender gap is not uniformly distributed across the range of attainments; rather it is primarily driven by boys’ underachievement at the highest grades in any assessment. In contrast, Boaler et al (2000) suggest that there is underachievement by girls at the top end of the ability distribution that may be linked to the high pressure, high expectation environments in top-set classes. Younger and Warrington (2002), in a detailed analysis of one co-educational comprehensive school, find that the gender gap in terms of value added is only significant if students have a Cognitive Ability Test (CAT) score below level 4, i.e. towards the lower end of the ability range.
Research into possible explanations for the gender gap has primarily focused on within-school factors, rather than external factors such as ethnicity, social class, etc (Salisbury et al 1999). The within-school factors that have been identified as possible (non- mutually exclusive) explanations include: modes of assessment (Arnot et al 1998); curriculum and question setting (Salisbury et al 1999); tiering or setting practices (Elwood and Murphy 2002; Boaler et al 2000); peer group effects (Hoxby
2000). More generally, there is a concern about the anti- learning “laddish culture” that is seen to be pervasive in at least some schools2. The relationship between gender and performance is seen as complex and multi- faceted, often largely dependent on local context and conditions.
The possible explanations inform the many strategies that have been put forward to try and reduce the gender gap. Again, these have a predominantly within-school focus, and include: single-sex teaching, both at school and classroom level (Younger and Warrington 2002; Sukhnandan et al 2000; Elwood and Gipps 1999); ensuring gender-neutral modes of assessment, curriculum content and question setting (Arnot et al 1998); good teaching and classroom management (Ofsted 2003); mentoring and the use of positive role models (Sukhnandan et al 2000). There is no conclusive evidence of the effectiveness of any of these strategies (Salisbury et al 1999).
3. Data
For this analysis we employ one of the national matched exam datasets released by the Department for Education and Skill (DfES). The dataset contains matched examination information for both Key Stage 3 (KS3) and GCSE/GNVQ, generally sat by pupils at the ages of 14 and 16 respectively. Individual exam results can be identified within the dataset, allowing complete information about the subjects studied by pupils, which is complemented by information on pupils’ gender. We present results for the 1999-2001 cohort, but also utilise school performance data from the 1997-1999 cohort.
The focus of the analysis is on state maintained secondary schools in England. We omit independent and special schools, as well as other academic centres such as hospital schools and detention centres, from our dataset. The pupil level matched dataset is augmented with data from two other school level datasets. Information on pupil eligibility for free school meals (a marker of poverty amongst the school population) (FSM) and school size is obtained from the Annual School Census
2
(ASC)3, whilst School Performance Table data further supplements the matched dataset with information on schools’ admission policy (comprehensive, secondary modern, grammar school or City Technology College (CTC)) as well as funding status: community, foundation, voluntary aided or voluntary controlled (see Atkinson and Wilson (2003) for further details on these funding categories)4.
We have matched examination data on over half a million pupils in 3103 schools, 87% of which are co-educational. Summary statistics are presented in Table 1. Comprehensive schools make up the majority (88%) of our dataset, with secondary modern and grammar schools composing 6% and 5% respectively. The re are only 15 City Technology Colleges (CTCs), all of which are co-educational. A larger proportion of girls (6.45%) attend single sex schools than boys (4.75%), resulting in boys constituting the larger component (51.6%) of co-educational school pupils.
4. Results
We present our results, considering the gender gap across different cuts of our data. In England in 2001 girls outperformed boys by five points at GCSE on average – equivalent to one pass at grade C. We go beyond such averages, by examining gender-related differences in performance by ability (measured by attainment at Key Stage 3), both on aggregate and at subject level; by within-school cohort gender mix; by the performance of the school, and by a measure of deprivation experienced by the families at different schools. Since we have a very large dataset, and since we approach this problem with no strong priors, we present the results graphically in order to impose as little structure as possible, and to allow any heterogeneity to appear. Finally, we summarise all this in a set of regressions. We examine two rather different measures of outcomes at age 16: GCSE results in isolation, and value added from age 14. We present results for GCSE point score rather than the percentage of pupils achieving 5 GCSEs at grade C or above. Not surprisingly, as the latter is a summary statistic of the former, the two yield similar results5.
3
Also known as ‘Form 7’.
4
CTCs are distinct from other schools both in terms of funding status and admissions policy.
5
a) The distribution of the gender gap by ability
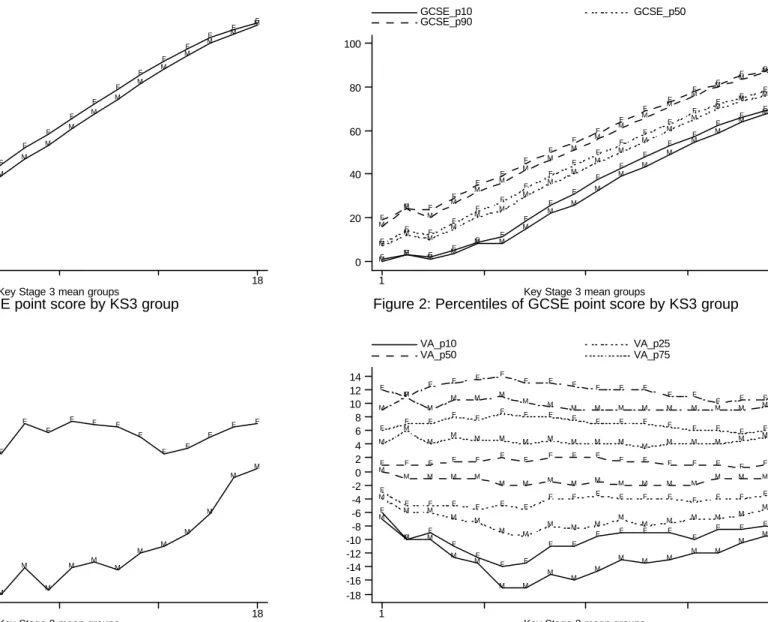
We do not have measures of exam performance earlier than Key Stage 3 (KS3) so proxy ability by attainment at KS3. We use each student’s mean over the three subjects tested (English, maths and science). Figures 1 and 2 present the GCSE points outcome for each mean KS3 group, separately for girls (denoted ‘F’ in the graph) and boys (denoted ‘M’); Figure 1 shows the mean, and Figure 2 some detail of the distribution. Looking at the mean first, we see that there is a clear and consistent gap of about 4 points throughout the distribution. The lines do not cross or touch at any point on the figure, indicating that for each ability group female students score more highly on average than male students. In fact, between mean KS3 groups of 6 and 14, the gap is almost constant. There is, if anything, some narrowing toward the tails of the distribution, a finding confirmed by later regression. Figure 2 shows that this pattern holds for the rest of the outcome distribution. For all but the very lowest two KS3 groups (which account for 1.3% of the distribution of prior attainment), the gender gap is clear and remarkably constant at the 10th, 50th and 90th percentiles of the outcome distribution across the ability distribution. Within each KS3 group, high achieving girls do better than high achieving boys, and low achieving girls do better than lo w achieving boys, by about 3 and 4 points respectively.
This fact sits alongside the other clear outcome of the figure – namely that ability (prior attainment) has a very substantial impact on GCSE outcomes, and an impact that is much greater than the ge nder gap. For example, a girl with KS3 score at the 75th percentile of the female distribution achieves a GCSE score better than 66.3% of girls; a boy with the same KS3 mean, scores better than 58.4% of girls. Thus the “ability gap” is far greater than the gender gap, a fact that should not be overlooked in the policy debate on this issue.
Figures 3 and 4 repeat this exercise using as the outcome variable the value-added over the ages 14 to 16. Figure 3 shows the mean and Figure 4 some details of the distribution (Wilson (2004) discusses how this value-added measure is calculated). Again the pattern is that the gender gap is always in the same direction6. It is clear that
6
the overall gap in value-added is driven by the collapse of value-added for boys in the middle of the distribution: boys with average KS3 scores make much less progress over the age range 14 – 16 than do girls. The detailed distributional picture in Figure 4 backs this up, with the worst performing (bottom 10%) boys starting from average KS3 scores doing much worse than the worst performing girls starting from the same prior attainment.
b) Subject differences in the gender gap
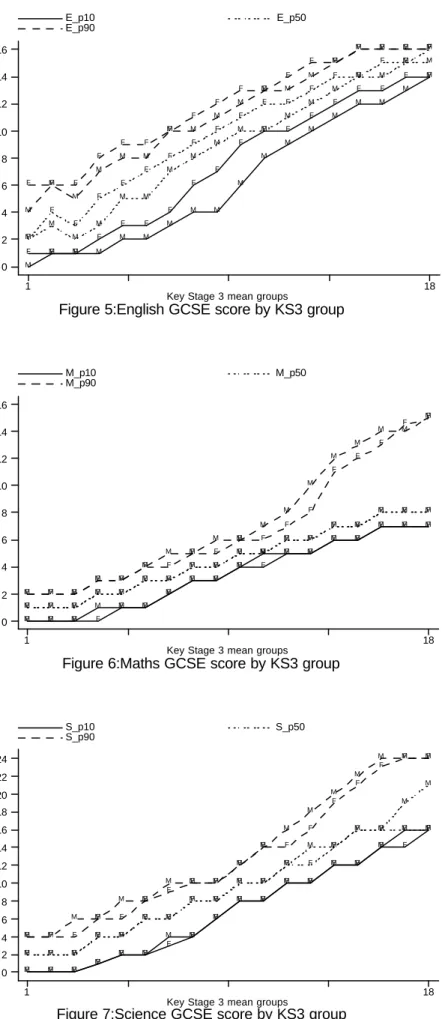
The literature on the gender gap has noted differential performance in different subjects. We therefore analyse the gender gap in GCSE scores by subject and ability (prior attainment). It is important to avoid potential selection effects and so only consider subjects that are compulsory for all pupils to do, so we focus on English, maths and science7. Mean GCSE scores are shown by gender and ability in Figures 5 (English), 6 (maths) and 7 (science). It is clear from these that the English scores are driving the overall gender gap, with wide differences between the genders at all levels of the prior attainment distribut ion, and across the GCSE outcome distribution, though particularly at the lower quartile. However, in maths and science, the picture is rather different. For almost all prior attainment levels, the median boy and the median girl achieve the same maths GCSE score. There are also few differences at the lowest decile. But looking at the high performers (top decile) from each prior attainment level, boys score higher GCSE points in maths than do girls. The average gap is of the order of half a point. The same is true for science: no gap at the median, but boys outperforming girls at the 90th percentile. It is of course received wisdom that “girls do better in English, boys do better in maths”. These results suggest that there is still some truth in that; whether this is the simply the last remaining bastion of male superiority about to fall, or an enduring difference awaits further data to tell.
c) Gender mix and the gender gap
We turn now to consider possible correlates of the gap. Given our data and the literature, our focus is on school characteristics. We begin with gender peer group
7
We cannot avoid selection effects completely as (some) pupils can choose to do double or triple science, or more than one maths paper, for example.
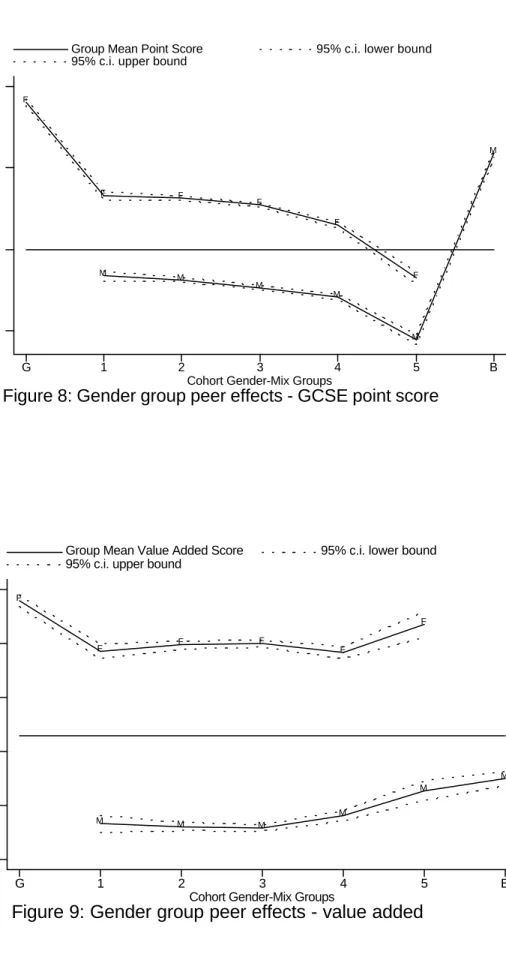
effects, measuring this as the proportion of a pupil’s school-cohort that is female8. We separate out pupils in single sex schools (labelled “G” and “B” on the figures)9, and split the remainder of the schools into 5 gender- mix categories, with schools in group 1 having the lowest percentage of boys in the cohort, and group 5 the highest. Note these refer to the gender mix of the 14 – 16 cohort of we are studying in each school, not the school as a whole, so it is immediately relevant to the pupils10. We graph two measures of attainment – the school mean GCSE points score (Figure 8) and the school mean value-added (Figure 9).
It is clear that girls outperform boys across both measures of attainment and across the full spectrum of cohort gender mix. There is evidence of different outcomes for both boys and girls in single sex schools, but it is impossible to tell whether this is a “single sex” effect or a “grammar school” effect, given the high degree of correlation between single sex schools and grammar schools. Across all co-educational schools, the mean girl GCSE score exceeds the mean boy score. Interestingly, both genders perform less well in GCSE terms the higher the fraction of boys in the school, although the effect disappears in the value-added calculation. This suggests there is a negative peer effect from higher proportions of boys, the impact of which is accounted for by Key Stage 3 (age 14).
d) The gender gap across good schools and poor schools
Is it the case that high performing or highly effective schools are able to reduce the gender gap relative to poorly performing schools? We investigate the extent to which the gender gap is related to observable indicators of school quality, rather than to gender differences per se. It may be that good teachers or good school procedures reduce or eliminate the gap: indeed, as our review of the literature illustrates, current thinking regarding strategies to reduce the gap is primarily focused on improving best practice within the school and classroom. We define high (poorly) performing schools as those in the top (bottom) 20% of the performance distribution as measured by the
8
See Hoxby (2000) for a discussion of the gender balance as peer group effect.
9
Note that very few of the schools in our dataset are single sex (only 4.75% of pupils are in boy-only schools, and only 6.45% in girl-only schools), and that being single -sex is highly correlated with being a grammar school, i.e. one that selects pupils on the basis of ability.
10
We have repeated this procedure using instead the whole -school gender mix; the results are the same and are not reported here.
%5A*-C indicator, and highly effective (ineffective) schools as those in the top (bottom) 20% of the value-added distribution. In each case we use lagged performance data taken from the 1997-1999 cohort.
Figures 10 to 13 show that there is no substantial difference in the gender gap across these different schools, and across the distribution of pupils’ abilities within those schools. That is to say, the distribution of the gap between girls’ GCSE scores and boys’ GCSE scores is about the same in schools with highly effective teaching, as it is in schools with ineffective teaching11. This is true at the mean, and also across the achievement distribution. Since the schools in the top performance category are different from the schools in the top effectiveness category (see Table 2 for the degree of overlap), this is quite a strong result, and suggests that quality differences between schools have little impact on the gender gap. We pursue this further below. A related question is the impact of school admission policy: whether schools are non-selective (comprehensive or secondary modern) or do select on ability (grammar schools). Again, our results show little impact on the gender gap of admissions policy (graphs not shown here, but see the regressions below).
e) The gender gap and free school meals eligibility
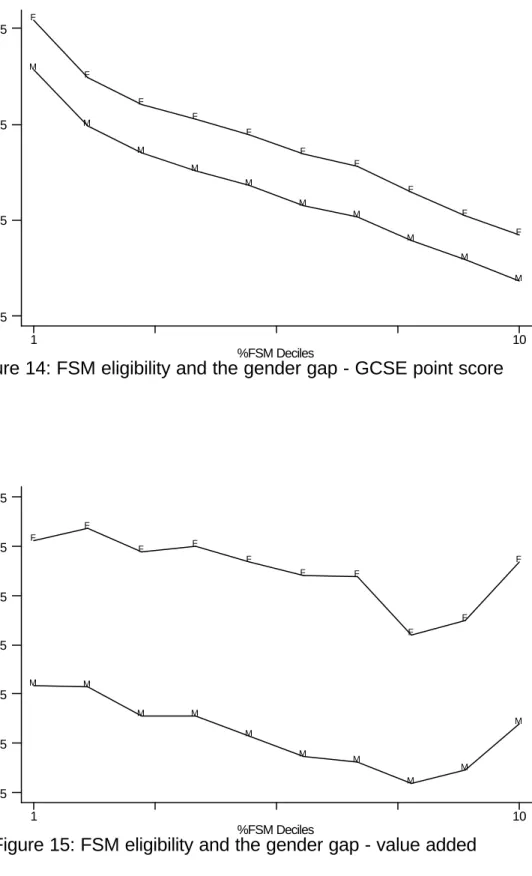
It is well known that pupil attainment is to a considerable degree influenced by the home environment, and that poverty at home reduces achievement on average (see Sparkes (1999) and references therein). The standard measure of this in the UK is the percentage of pupils at a school eligible for free school meals (FSM). We therefore examine whether this is correlated with the gender gap. If true, this would provide some suggestive evidence (no more) that boys and girls respond differently to a deprived home environment.
Figures 14 and 15 show that as expected, both school mean GCSE points and value-added decline as FSM eligibility increases. Note again that, just as with the “ability gap”, the impact of differences in FSM eligibility, the “poverty gap”, is much greater than the gender gap. But the differences in poverty have little impact on the size of
11
the gender gap: the gap is 5 GCSE points in schools in the second decile of FSM eligibility, and is the same in schools in the bottom decile. Similarly, the gender gap in value-added is essentially invariant to FSM eligibility. This suggests that differential response to poverty levels at home is unlikely to be a major determinant of the gender gap.
f) Explaining the gender gap across schools
We now turn to analysing the gender gap across the whole population of schools in England. The preceding sections have hinted at very few systematic differences in the gender gap between schools in terms of effectiveness and contextual factors. To examine this further we graph the school mean gender gap in GCSE points for all co-educational schools in England in Figure 16, and by the three core compulsory subjects in Figures 17 (English), 18 (maths) and 19 (science). These are plotted against the school’s rank in terms of overall average GCSE score (Figure 16) and the respective average subject level scores (Figures 17-19).
The graphs show a number of features. First, there is no relationship between the gender gap and average school achievement, on aggregate or at subject level. Second, for almost all schools, the gender gap is positive – the gender gap is pervasive across all schools, emphatically not simply driven by a few outliers. In fact, looking at overall GCSE points score, only 7.73% of schools (208 out of 2690) have boys doing better than girls, and this number may be pure random variation12. For a value added outcome measure, 5.76% of schools have boys doing better than girls. Third, we see the important difference between subjects reflected here too: there is a significant difference between the plot for English, and for science and maths.
Regression Analysis
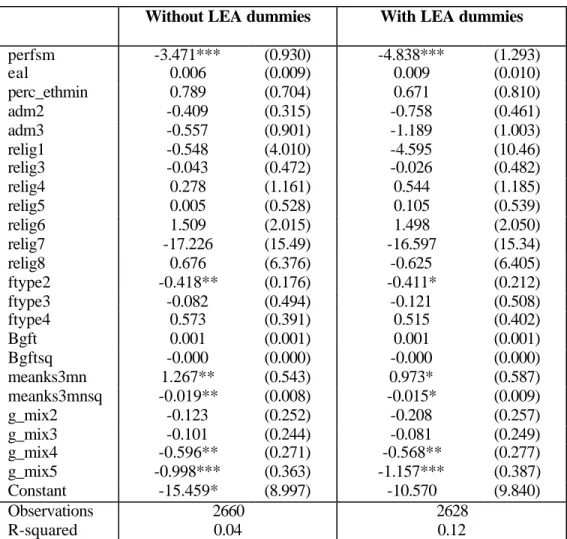
We summarise our discussion by means of regression analysis. We compute the school level gender gap, i.e. the mean difference between girls’ and boys’ GCSE total point score (GBdiff) and regress this on a set of school characteristics. These include:
12
Assuming that the distribution of the gap is normal, with a mean of 4.813 and a standard error of 3.546, we would expect 8.7% of observations to have a gap of zero or less.
the percentage of pupils eligible for free school meals (perfsm), the percentage for whom English is a second language (eal), the percentage of minority ethnic (non-white) pupils (perc_ethmin), admissions policy, religious denomination, funding status, number of pupils (bgft), school mean Key Stage 3 (KS3) score and within-school cohort gender mix, as described in section (c) above. In a second regression we include all the above plus a set of LEA dummies13. We might expect individual LEAs to have an impact on the gender gap. LEAs differ both in terms of education policy and across various other dimensions. Such differences may include: admissions policy; proportion of single sex schools; size; population density; whether predominantly urban or rural. The results of both regressions are in Table 3.
The first point to note is the extremely low R2, equal to 4% in the first regression and rising to just 12% with the inclusion of the LEA dummies. While some variables are significant, the explanatory power is so low that we can say that the gender gap is essentially random across schools relative to the (quite rich) set of characteristics we are able to examine. Second, we turn to the significant variables. In the first regression school KS3 mean score is significant and positive, while its square is significant and negative. In the second regression these are no longer significant but maintain the same signs. This reflects our earlier finding that the gender gap is greatest in the middle of the ability or prior attainment distribution. The FSM eligibility variable,
perfsm, is significant and negative in both regressions, showing that controlling for all else, as poverty falls, the gender-related performance differential rises. Finally, again in both regressions, the highest two groups of gender mix are significant and negative: as the proportion of boys in the within-school cohort increases, the gender gap decreases. This could be due either to boys doing relatively better or girls doing relatively worse in a cohort containing a higher proportion of boys. LEA dummies are significant as a group. Little else approaches significance. We conclude from this that the gender gap is not greatly influenced by any of the widely used observable school characteristics. This makes it very hard for policy to be designed to address it. It also suggests that the source of the gap is not related to the behaviour of schools and teachers, but is more generic. Whether this is societal or physiological in nature is beyond the scope of this study.
13
We omit the 11 LEAs with less than five co-educational schools, which leaves us with 138 dummy variables. These are not included in the results reported here but are available on request.
5. Conclusion
The aim of this paper was to examine gender related differences in performance at age 16, both in terms of GCSE results and in terms of the value added between the ages of 14 and 16. We have investigated a number of possible explanations for the underachievement of boys relative to girls. Our striking result is the sheer consistency of this gender gap, across both the attainment and the ability distribution, on aggregate and at subject level, with regard to both raw outcomes and value added. We show that it is not related to whether the school performs well or poorly, or whether it is effective or ineffective. Nor is it affected by a wide range of other observable features of schools such as admissions policy, religious denomination or funding status.
There is a clear difference between subjects. The gender gap is primarily driven by performance differentials in English, while boys and girls are still obtaining similar results in maths and science. This may be the result of a slow moving socialisation process, in which case we might expect girls to eventually outperform boys in these “traditionally male” subjects as well. Or it could be that the different cognitive demands and processes required by the subjects is giving us a clue that the gender gap is rooted in different rates of cognitive maturation between boys and girls, that itself happens at varying rates for different cognitive processes.
Our analysis suggests that the 14 – 16 gender gap is something very general and is not much affected by any of the leading observable school characteristics. This suggests that the source of the gap is not within-school practice, which in turn means that policy directed at improving such practice may be misplaced. In fact, given our findings regarding the size of both the “ability” and the “poverty” gaps relative to the gender gap, focus on the reasons behind these performance differentials may lead to better results in terms of improvements in both boys’ and girls’ educational attainment. With the release of the national pupil level annual schools census (PLASC), which contains pupil level information on free school meal eligibility and ethnicity as well as gender, we aim to further investigate more fully the patterns of differential performance of different types of pupil.
References
Arnot, M, Gray, J, James, M, Rudduck, J, with Duveen, G (1998), Recent research on gender and educational performance, OFSTED Reviews of Research, London, HMSO
Atkinson, A and Wilson, D (2003), Measuring Pupil Attainment in English Secondary Schools: A Preliminary Analysis, CMPO, University of Bristol, Working Paper
03/063
Boaler, J, William, D and Brown, M (2000), Students’ experiences of ability grouping – disaffection, polarisation and the construction of failure, British Educational
Research Journal, 26(5): 631-648
DfES (2002a), National Curriculum Assessments of 7, 11 and 14 year olds in England – 2001, http://www.dfes.gov.uk/statistics/DB/SBU/b0333/index.html
DfES (2002b), GCSE/GNVQ and GCE A/AS/VCE/Advanced GNVQ Examination Results 2000/2001 – England,
http://www.dfes.gov.uk/statistics/DB/SBU/b0334/index.html
Elwood, J and Gipps, C (1999), Review of Recent Research on the Achievement of Girls in Single-Sex Schools, Institute of Education, University of London
Elwood, J and Murphy, P (2002), Tests, tiers and achievement: gender and
performance at 16 and 14 in England, European Journal of Education, 37(4): 395-416
Hoxby, C (2000), Peer effects in the classroom: learning from gender and race variation, NBER working paper 7867
Gorard, S, Rees, G and Salisbury, J (1999), Reappraising the apparent underachievement of boys at school, Gender and Education, 11(4): 441-454
OECD (2003), Literacy Skills for the World of Tomorrow: Further Results from PISA 2000, http://www1.oecd.org/publications/e-book/9603071E.pdf
Ofsted (2003), Boys’ Achievement in Secondary Schools,
http://www.ofsted.gov.uk/publications/docs/3316.pdf
Powney, J (1996), Trends in gender and attainment in Scotland, Scottish Council for Research in Education, http://www.scre.ac.uk/spotlight/spotlight64.html 11/2/03
Salisbury, J, Rees, G and Gorard, S (1999), Accounting for the differential attainment of boys and girls at school, School Leadership and Management, 19(4): 403-426 Shaw (2002)
Shaw, L (2002), Schools’ gender gap concern now is boys, Seattle Times, 30/09/02,
http://seattletimes.nwsource.com/text/134545336_gender30m.html 11/2/03
Sparkes, J (1999), Schools, Education and Social Exclusion, CASE, LSE, Working Paper 29
Stobart, G, White, J, Elwood, J, Hayden, M and Mason, K (1992), Differential performance at 16+: English and mathematics, London, HMSO
Sukhnandan, L, Lee, B and Kelleher, S (2000), An investigation into gender differences in achievement, Phase 2: school and classroom strategies, National Foundation for Educational Research, www.nfer.ac.uk 10/02/03
Younger, M and Warrington, M (2002), Single-sex teaching in a co-educational comprehensive school in England: an evaluation based upon students’ performance and classroom interactions, British Educational Research Journal, 28(3): 353-374
Wilson, D (2004), Which ranking? The impact of a ‘value added’ measure of secondary school performance, Public Money and Management, forthcoming
Table 1: Summary statistics
Admission Policy Comprehensive CTC* Secondary Modern Grammar Total
Pupil 15844 0 1917 7483 25244 Boys Only School 109 0 16 61 186 Pupil 23370 0 3011 7875 34256 Girls Only School 145 0 20 62 227 Pupil 444325 2548 19374 5280 471527 Co-educational School 2490 15 144 41 2690 Pupil 483539 2548 24302 20638 531027 Total School 2744 15 180 164 3103
*CTC: City Technology College
Table 2a: Overlap between high performing and effective schools % 5A*-C Good Schools 0 1 Total Value - 0 2046 401 2447 Added 1 404 221 625 Total 2450 622 3072
Source: Department for Education and Skills
Table 2b: Overlap between poorly performing and ineffective schools
% 5A*-C Poor Schools 0 1 Total Value - 0 2117 364 2481 Added 1 374 217 591 Total 2491 581 3072
Table 3: Regressions of school level gender gap, with and without LEA dummies
Without LEA dummies With LEA dummies
perfsm -3.471*** (0.930) -4.838*** (1.293) eal 0.006 (0.009) 0.009 (0.010) perc_ethmin 0.789 (0.704) 0.671 (0.810) adm2 -0.409 (0.315) -0.758 (0.461) adm3 -0.557 (0.901) -1.189 (1.003) relig1 -0.548 (4.010) -4.595 (10.46) relig3 -0.043 (0.472) -0.026 (0.482) relig4 0.278 (1.161) 0.544 (1.185) relig5 0.005 (0.528) 0.105 (0.539) relig6 1.509 (2.015) 1.498 (2.050) relig7 -17.226 (15.49) -16.597 (15.34) relig8 0.676 (6.376) -0.625 (6.405) ftype2 -0.418** (0.176) -0.411* (0.212) ftype3 -0.082 (0.494) -0.121 (0.508) ftype4 0.573 (0.391) 0.515 (0.402) Bgft 0.001 (0.001) 0.001 (0.001) Bgftsq -0.000 (0.000) -0.000 (0.000) meanks3mn 1.267** (0.543) 0.973* (0.587) meanks3mnsq -0.019** (0.008) -0.015* (0.009) g_mix2 -0.123 (0.252) -0.208 (0.257) g_mix3 -0.101 (0.244) -0.081 (0.249) g_mix4 -0.596** (0.271) -0.568** (0.277) g_mix5 -0.998*** (0.363) -1.157*** (0.387) Constant -15.459* (8.997) -10.570 (9.840) Observations 2660 2628 R-squared 0.04 0.12
Standard errors in parentheses
Group Mean Point Score
Figure 1: Mean GCSE point score by KS3 group
Key Stage 3 mean groups
1 18 0 20 40 60 80 F F F F F F F F F F F F F F F F F F M M M M M M M M M M M M M M M M M M
Figure 2: Percentiles of GCSE point score by KS3 group
Key Stage 3 mean groups
GCSE_p10 GCSE_p50 GCSE_p90 1 18 0 20 40 60 80 100 F F F F F F F F F F F F F F F F F F M M M M M M M M M M M M M M M M M M F F F F F F F F F F F F F F F F F F M M M M M M M M M M M M M M M M M M F F F F F F F F F F F F F F F F F F M M M M M M M M M M M M M M M M M M
Group Mean Value Added Score
Figure 3: Mean value added by KS3 group
Key Stage 3 mean groups
1 18 -3 -2 -1 0 1 2 3 F F F F F F F F F F F F F F F F F F M M M M M M M M M M M M M M M M M M
Figure 4: Percentiles of value added by KS3 group
Key Stage 3 mean groups
VA_p10 VA_p25 VA_p50 VA_p75 1 18 -18 -16 -14 -12 -10 -8 -6 -4 -2 0 2 4 6 8 10 12 14 F F F F F F F F F F F F F F F F F F M M M M M M M M M M M M M M M M M M F F F F F F F F F F F F F F F F F F M M M M M M M M M M M M M M M M M M F F F F F F F F F F F F F F F F F F M M M M M M M M M M M M M M M M M M F F F F F F F F F F F F F F F F F F M M M M M M M M M M M M M M M M M M F F F F F F F F F F F F F F F F F F M M M M M M M M M M M M M M M M M M
Figure 5:English GCSE score by KS3 group Key Stage 3 mean groups
E_p10 E_p50 E_p90 1 18 0 2 4 6 8 10 12 14 16 F F F F F F F F F F F F F F F F F F M M M M M M M M M M M M M M M M M M F F F F F F F F F F F F F F F F F F M M M M M M M M M M M M M M M M M M F F F F F F F F F F F F F F F F F F M M M M M M M M M M M M M M M M M M
Figure 6:Maths GCSE score by KS3 group Key Stage 3 mean groups
M_p10 M_p50 M_p90 1 18 0 2 4 6 8 10 12 14 16 F F F F F F F F F F F F F F F F F F M M M M M M M M M M M M M M M M M M F F F F F F F F F F F F F F F F F F M M M M M M M M M M M M M M M M M M F F F F F F F F F F F F F F F F F F M M M M M M M M M M M M M M M M M M
Figure 7:Science GCSE score by KS3 group
Key Stage 3 mean groups
S_p10 S_p50 S_p90 1 18 0 2 4 6 8 10 12 14 16 18 20 22 24 F F F F F F F F F F F F F F F F F F M M M M M M M M M M M M M M M M M M F F F F F F F F F F F F F F F F F F M M M M M M M M M M M M M M M M M M F F F F F F F F F F F F F F F F F F M M M M M M M M M M M M M M M M M M
Group Mean Point Score
Figure 8: Gender group peer effects - GCSE point score Cohort Gender-Mix Groups
Group Mean Point Score 95% c.i. lower bound
95% c.i. upper bound
G 1 2 3 4 5 B 35 40 45 50 F F F F F F M M M M M M
Group Mean Value Added Score
Figure 9: Gender group peer effects - value added
Cohort Gender-Mix Groups
Group Mean Value Added Score 95% c.i. lower bound
95% c.i. upper bound
G 1 2 3 4 5 B -3 -2 -1 0 1 2 F F F F F F M M M M M M
Group Mean Point Score
Figure 10: The gender gap in high performing schools
8 quantiles based on Key Stage 3
1 2 3 4 5 6 7 8 15 25 35 45 55 65 75 F F F F F F F F M M M M M M M M
Group Mean Point Score
Figure 11: The gender gap in effective schools
8 quantiles based on Key Stage 3
1 2 3 4 5 6 7 8 15 25 35 45 55 65 75 F F F F F F F F M M M M M M M M
Group Mean Point Score
Figure 12: The gender gap in low performing schools8 quantiles based on Key Stage 3
1 2 3 4 5 6 7 8 10 20 30 40 50 60 70 F F F F F F F F M M M M M M M M
Group Mean Point Score
Figure 13: The gender gap in ineffective schools8 quantiles based on Key Stage 3
1 2 3 4 5 6 7 8 10 20 30 40 50 60 70 F F F F F F F F M M M M M M M M
Group Mean Point Score
Figure 14: FSM eligibility and the gender gap - GCSE point score
%FSM Deciles 1 10 25 35 45 55 F F F F F F F F F F M M M M M M M M M M
Group Mean Value Added Score
Figure 15: FSM eligibility and the gender gap - value added
%FSM Deciles 1 10 -3.5 -2.5 -1.5 -.5 .5 1.5 2.5 F F F F F F F F F F M M M M M M M M M M
Figure 16: School mean gender gap-GCSE point score
ranked schools
School Mean Gender Gap Fitted values
1 2690 -5 0 5 10 15 20
Figure 17: School Mean Gender Gap - GCSE English
ranked schools
School Mean Gender Gap Fitted values
1 2690
-2.5 0 2.5 5
Figure 18: School Mean Gender Gap - GCSE Maths
ranked schools
School Mean Gender Gap Fitted values
1 2690 -4 -2 0 2 4
Figure 19: School Mean Gender Gap - GCSE Science
ranked schools
School Mean Gender Gap Fitted values
1 2690 -5 -2.5 0 2.5 5