UNIVERSIDAD COMPLUTENSE DE MADRID
FACULTAD DE CIENCIAS ECONÓMICAS Y
EMPRESARIALES
TESIS DOCTORAL
Climate change impacts on renewable energy generation and
electricity demand
Impactos del cambio climático en la generación de energía
renovable y en la demanda de electricidad
MEMORIA PARA OPTAR AL GRADO DE DOCTOR
PRESENTADA POR
Kepa Solaun Martínez
Director
Emilio Jaime Cerdá Tena
Madrid
Climate Change Impacts on Renewable Energy
Generation and Electricity Demand
Impactos del cambio climático en la generación de energía
renovable y en la demanda de electricidad
Kepa Solaun Martínez
25 September 2019
Director: Emilio Cerdá Tena
P R O G R A M A D E D O C T O R A D O E N E C O N O M Í A
DECLARACIÓN DE AUTORÍA Y ORIGINALIDAD DE LA TESIS PRESENTADA PARA OBTENER EL TÍTULO DE DOCTOR
Kepa Solaun Martínez, estudiante en el Programa de Doctorado en Economía, de la Facultad de Ciencias Económicas y Empresariales de la Universidad Complutense de Madrid, como autor de la tesis presentada para la obtención del título de Doctor y titulada:
“Climate Change Impacts on Renewable Energy Generation and Electricity Demand”
y dirigida por: Emilio Cerdá Tena
DECLARO QUE:
La tesis es una obra original que no infringe los derechos de propiedad intelectual ni los derechos de propiedad industrial u otros, de acuerdo con el ordenamiento jurídico vigente, en particular, la Ley de Propiedad Intelectual (R.D. legislativo 1/1996, de 12 de abril, por el que se aprueba el texto refundido de la Ley de Propiedad Intelectual, modificado por la Ley 2/2019, de 1 de marzo, regularizando, aclarando y armonizando las disposiciones legales vigentes sobre la materia), en particular, las disposiciones referidas al derecho de cita. Del mismo modo, asumo frente a la Universidad cualquier responsabilidad que pudiera derivarse de la autoría o falta de originalidad del contenido de la tesis presentada de conformidad con el ordenamiento jurídico vigente.
En Madrid, a 18 de septiembre de 2019.
ἀρχὴ ... τῶν ὄντων τὸ ἄπειρον ... ἐξ ὧν δὲ ἡ γένεσίς ἐστι τοῖς οὖσι͵ καὶ τὴν φθορὰν εἰς ταῦτα γίνεσθαι κατὰ τὸ χρεών· διδόναι γὰρ αὐτὰ δίκην καὶ τίσιν ἀλλήλοις τῆς ἀδικίας κατὰ τὴν τοῦ
χρόνου τάξιν
Principle and beginning ... of beings is the limitless ... where beings have their beginning, therein also have their end according to necessity; for they pay penalty and retribution to each other for their injustice in
accordance with the arrangement of time.
Acknowledgments
This Thesis has benefited greatly from the generous contribution of many people:
Emilio Cerdá responded with understanding and affection to all the inconveniences and
challenges encountered during the process. His mathematical expertise and meticulousness improved very significantly the manuscripts.
Acciona, Endesa and Ente Vasco de la Energía provided very useful data and ideas for
the papers.
Itxaso Gómez and Iker Larrea (from Factor) provided very useful feedback to most
manuscripts. Eider de Miguel provided invaluable support.
Elvira de la Rubiera and Maria del Mar Vich (from Meteoclim) helped with
climatological data.
Mario Soliño provided a very valuable contribution in topics related to econometrics.
Helen Poliquin and Christina Garcia reviewed the use of English in the manuscripts.
Many participants in workshops and seminars where the papers were presented
provided very valuable ideas and suggestions to improve the texts. Particularly the attendees to the seminars organized by the Universidad Complutense de Madrid. But it would have been impossible without the support and understanding of my family and friends.
ix
Index
MOTIVATION AND STRUCTURE OF THE THESIS ... 1
1.MOTIVATION ... 1
2.OBJECTIVES OF THE THESIS ... 1
3.STRUCTURE OF THE THESIS ... 1
REFERENCES ... 3
CLIMATE CHANGE IMPACTS ON RENEWABLE ENERGY GENERATION. A REVIEW OF QUANTITATIVE PROJECTIONS ... 4
1. INTRODUCTION ... 4
2.METHODOLOGY ... 4
3.HYDROELECTRIC POWER PLANTS ... 5
3.1. Overview, impacts and methodological issues ... 5
3.2. Main projections in literature ... 6
4.WIND GENERATION ... 13
4.1. Overview, impacts and methodological issues ... 13
4.2. Main projections in literature ... 15
5.SOLAR GENERATION ... 21
5.1. Main impacts and methodological issues ... 21
5.2. Main projections in literature ... 22
6.OTHER RENEWABLE SOURCES ... 27
7. DISCUSSION ... 28
REFERENCES ... 30
APPENDIX.CLIMATECHANGEIMPACTSONBIOMASSGENERATIONANDMOSTRELEVANTSTUDIESON OTHERSOURCESOFGENERATION ... 41
THE IMPACT OF CLIMATE CHANGE ON THE GENERATION OF HYDROELECTRIC POWER—A CASE STUDY IN SOUTHERN SPAIN ... 44
1.INTRODUCTION ... 44
2.METHODOLOGY ... 45
2.1. Description of the Plants ... 45
2.2. The Physical Model ... 46
2.3. Historical Reconstruction ... 49
3.PRODUCTION PROJECTIONS ... 50
3.1. Hypothesis for the Projections ... 50
3.2. Results ... 51
3.3. Historical Background ... 53
3.4. Alternative Sources of Information... 55
4.ECONOMIC ANALYSIS ... 56
4.1. Hypothesis ... 56
4.2. Analysis of Operating Margin ... 58
x
5.DISCUSSION ... 59
6.CONCLUSIONS ... 59
REFERENCES ... 61
IMPACTS OF CLIMATE CHANGE ON WIND ENERGY POWER – FOUR WIND FARMS IN SPAIN ... 63
1.INTRODUCTION ... 63
2.METHODOLOGY ... 64
2.1. Description of the plants ... 64
2.2. Methodological outline for the projections ... 65
2.3. Methodological outline for the economic analysis ... 69
3.PROJECTION ... 71
3.1. Results ... 71
3.2. Context in literature ... 72
4.ECONOMIC ANALYSIS... 74
4.1. Analysis of operating margins ... 74
4.2. Investment analysis ... 76
5.DISCUSSION ... 76
6.CONCLUSIONS ... 77
REFERENCES ... 78
THE INFLUENCE OF CLIMATE ON ELECTRICITY DEMAND IN THE BASQUE COUNTRY IN THE CONTEXT OF CLIMATE CHANGE ... 82
1.INTRODUCTION ... 82
2.METHODOLOGY ... 83
3.ELECTRICITY DEMAND IN THE BASQUE COUNTRY ... 84
4.CLIMATE EVOLUTION ... 86
5.CORRELATION BETWEEN TEMPERATURE AND ENERGY CONSUMPTION... 87
6.FUTURE CLIMATE PROJECTIONS ... 88
7.DISCUSSION ... 90
REFERENCES ... 92
SUPPLEMENTARY MATERIAL.CORRELATION ANALYSIS AND TEST OF STATISTICAL SIGNIFICANCE. ... 95
CONCLUSIONS AND FURTHER RESEARCH ... 98
1.OVERVIEW ... 98
2. IMPACTS ON SUPPLY ... 98
3. IMPACTS ON DEMAND ... 99
4. LIMITATIONS AND FUTURE RESEARCH ... 100
REFERENCES ... 101
RESUMEN ... 102
xi
Index of figures
CHANGE IMPACTS ON RENEWABLE ENERGY GENERATION.A REVIEW OF QUANTITATIVE PROJECTIONS
FIGURE 1.TECHNOLOGICAL SCOPE OF ANALYSED PAPERS. ... 28
FIGURE 2.GEOGRAPHICAL SCOPE OF ANALYSED PAPERS. ... 28
THE IMPACT OF CLIMATE CHANGE ON THE GENERATION OF HYDROELECTRIC POWER—ACASE STUDY IN SOUTHERN SPAIN FIGURE 1.LOCATION OF THE THREE PLANTS ALONG THE GUADALQUIVIR BASIN. ... 46
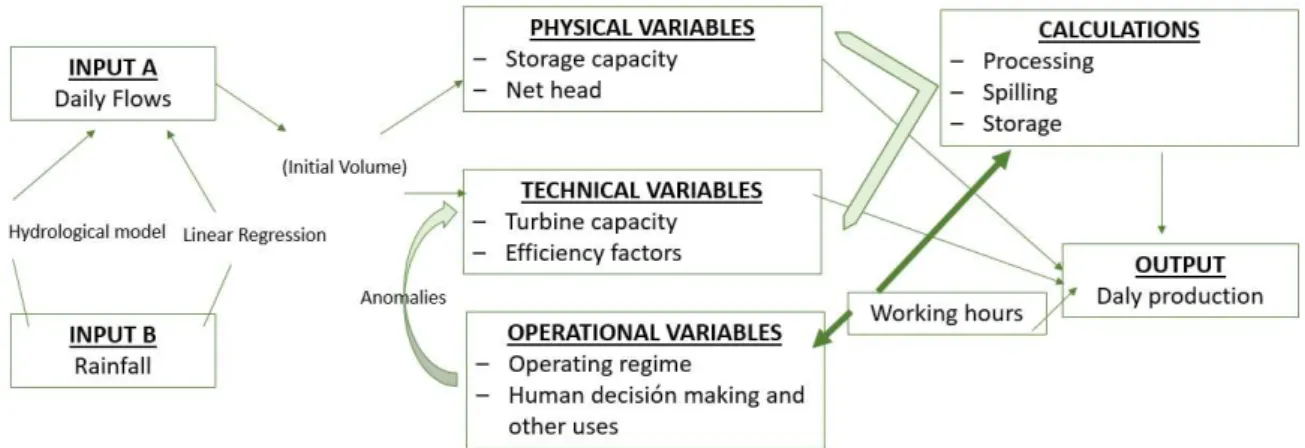
FIGURE 2.OPERATION OF HYDROCLIM PHYSICAL MODEL. ... 47
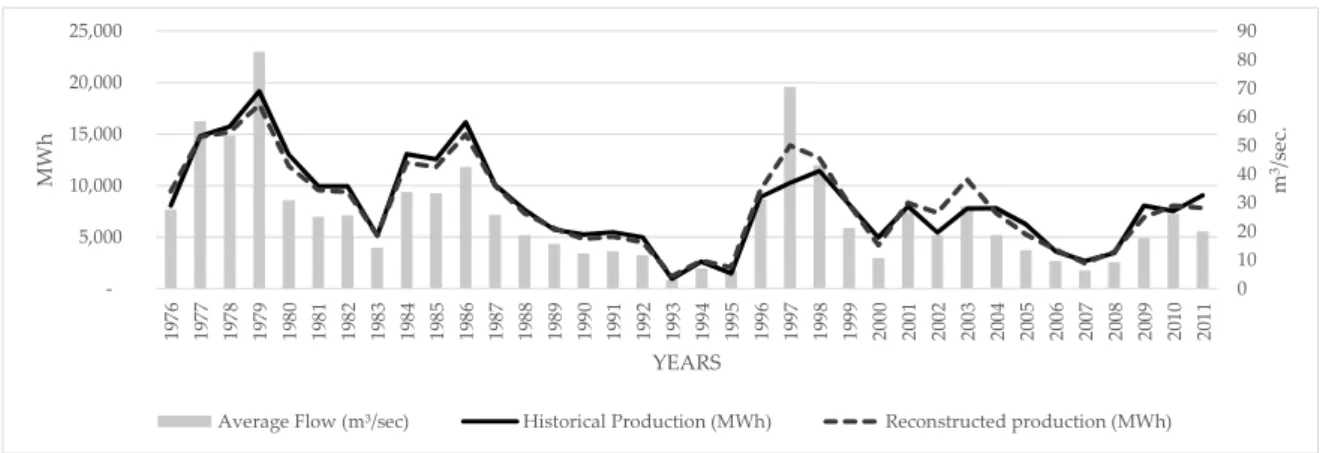
FIGURE 3.HISTORICAL PRODUCTION AND RECONSTRUCTION AT THE MENGÍBAR PLANT. ... 49
FIGURE 4.HISTORICAL PRODUCTION AND RECONSTRUCTION AT THE CALA PLANT.. ... 49
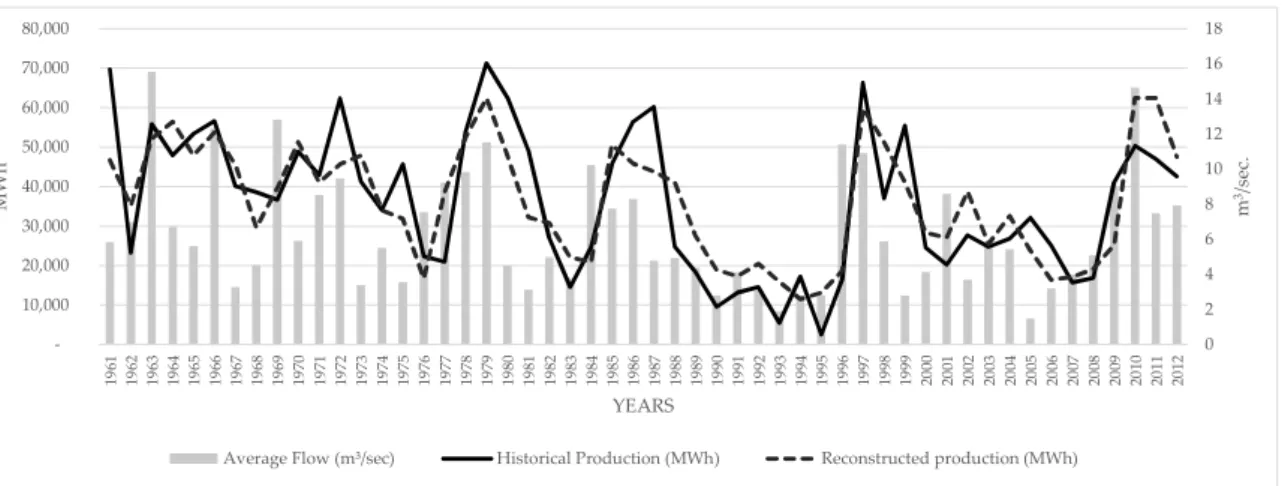
FIGURE 5.HISTORICAL PRODUCTION AND RECONSTRUCTION AT THE TRANCO DE BEAS PLANT.. ... 50
FIGURE 6.PROJECTED PRODUCTION FOR CALA IN MWH (A2). ... 51
FIGURE 7.PROJECTED PRODUCTION AT MENGIBAR IN MWH (A2). ... 51
FIGURE 8.PROJECTED PRODUCTION FOR TRANCO IN MWH (A2)... 52
FIGURE 9.COMPARISON OF PROJECTIONS AND CLIMATE TRENDS. ... 52
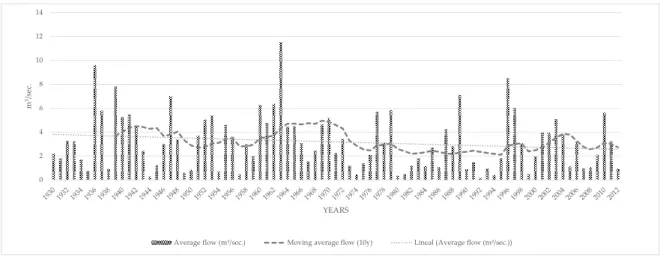
FIGURE 10.HISTORICAL EVOLUTION OF FLOW AT THE CALA CENTER. ... 53
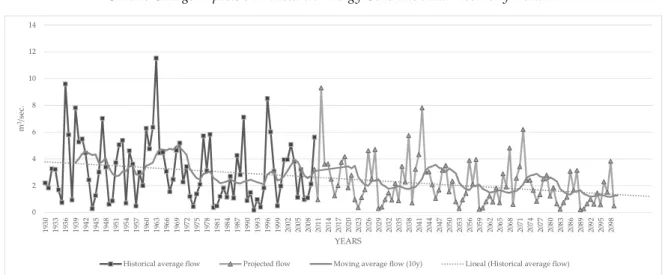
FIGURE 11.HISTORICAL AND PROJECTED FLOW (M3/S),CALA CENTER.S. ... 54
FIGURE 12.HISTORICAL AND PROJECTED FLOW (M3/S),MENGIBAR CENTER.. ... 54
FIGURE 13.HISTORICAL AND PROJECTED FLOW (M3/S),TRANCO CENTER.. ... 54
FIGURE 14.FLOW AND RAINFALL DATA (1967–2012),TRANCO DE BEAS CENTER.. ... 55
IMPACTS OF CLIMATE CHANGE ON WIND ENERGY POWER –FOUR WIND FARMS IN SPAIN FIGURE 1.LOCATION OF THE WIND FARMS. ... 65
FIGURE 2.SEASONAL PRODUCTION (IN %) BY WIND FARM. ... 72
FIGURE 3.REANALYSIS AND PROJECTIONS.. ... 74
THE INFLUENCE OF CLIMATE ON ELECTRICITY DEMAND IN THE BASQUE COUNTRY IN THE CONTEXT OF CLIMATE CHANGE FIGURE 1.ELECTRICITY DEMAND IN THE THREE PROVINCES FROM 2000 TO 2017. ... 85
FIGURE 2.QUANTITY OF HDD AND CDD PER CITY OVER TIME.. ... 87
FIGURE 3.THE AVERAGE PROJECTED EVOLUTION OF HDD AND CDD PER PROVINCE COMPARED WITH THE REFERENCE PERIOD (2012-2017).. ... 89
xii
Index of tables
CLIMATE CHANGE IMPACTS ON RENEWABLE ENERGY GENERATION.A REVIEW OF QUANTITATIVE PROJECTIONS
TABLE 1.MAIN THREATS AND IMPACTS ON HYDROPOWER GENERATION. ... 6
TABLE 2.MOST RELEVANT STUDIES ON CLIMATE CHANGE IMPACTS ON HYDROPOWER GENERATION. ... 9
TABLE 3.MAIN THREATS AND IMPACTS ON WIND GENERATION. ... 13
TABLE 4.MOST RELEVANT STUDIES ON CLIMATE CHANGE IMPACTS ON WIND ENERGY GENERATION. ... 17
TABLE 5.MAIN THREATS AND IMPACTS ON SOLAR PV. ... 21
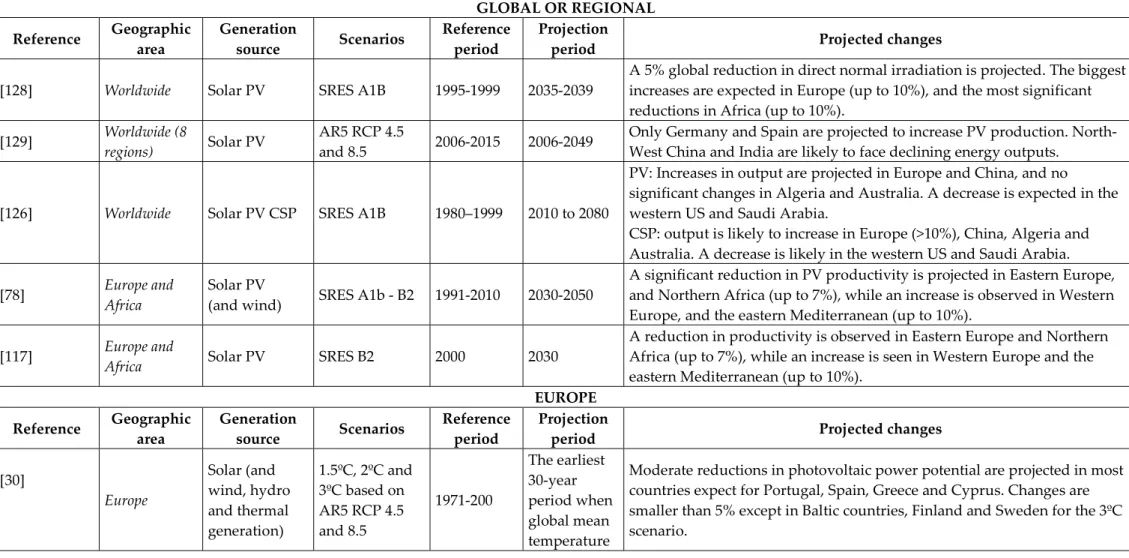
TABLE 6.MOST RELEVANT STUDIES ON CLIMATE CHANGE IMPACTS ON PV GENERATION. ... 24
TABLE 7.MAIN THREATS AND IMPACTS ON BIOMASS GENERATION. ... 41
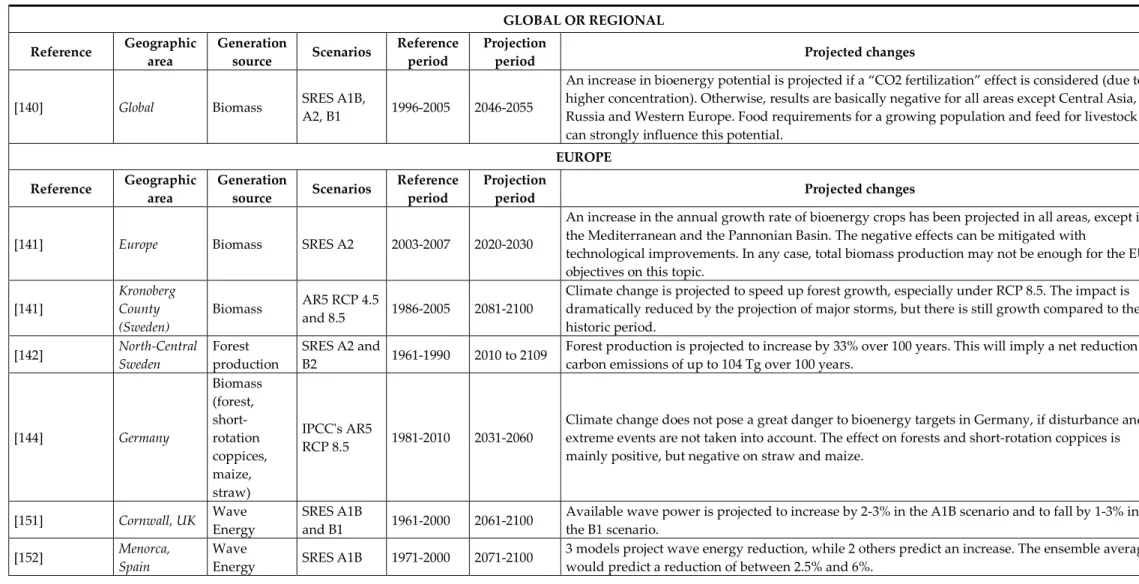
TABLE 8.MOST RELEVANT STUDIES ON CLIMATE CHANGE IMPACTS ON OTHER RENEWABLE SOURCES OF GENERATION. ... 42
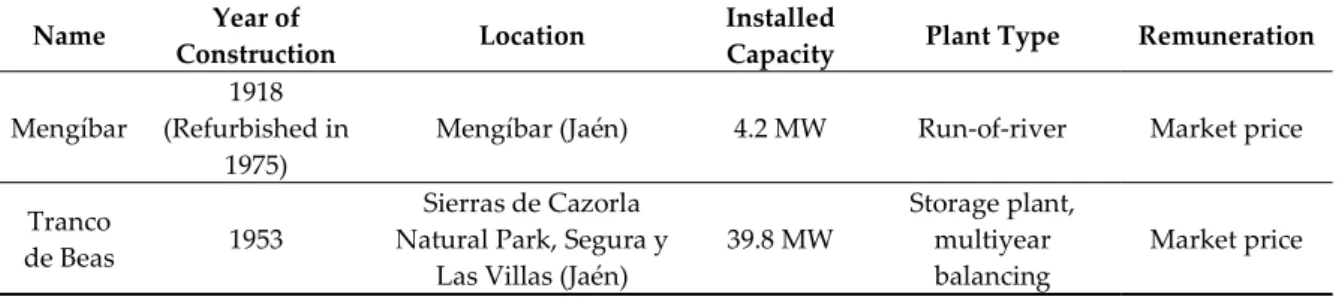
THE IMPACT OF CLIMATE CHANGE ON THE GENERATION OF HYDROELECTRIC POWER—ACASE STUDY IN SOUTHERN SPAIN TABLE 1.CHARACTERISTICS OF THE ANALYZED PLANTS.. ... 45
TABLE 2.VARIATION OF AVAILABLE RESOURCE (RUNOFF) BASED ON CEDEX AVERAGE PROJECTIONS FOR THE GUADALQUIVIR, COMPARED WITH 1961–1990.SCENARIOS A2 AND B2.. ... 50
TABLE 3.HISTORICAL AND PROJECTED PRODUCTION TO POWER RATIO (AVERAGE ANNUAL PRODUCTION (MWH)/CAPACITY (INSTALLED MW)).. ... 53
TABLE 4.PROJECTED REDUCTIONS IN PRODUCTION (%).CEDEX VS.REGIONAL GOVERNMENT OF ANDALUSIA. ... 55
TABLE 5.CAPITAL COSTS AT HYDROPOWER PLANTS. ... 56
TABLE 6.ALIGNMENT RATIO FOR HYDROELECTRIC POWER STATIONS. ... 57
TABLE 7.EVOLUTION OF OPERATING MARGINS AT PILOT CENTERS. ... 58
TABLE 8.EVOLUTION OF OPERATING MARGINS (%) OVER TIME. ... 58
TABLE 9.NET PRESENT VALUES OF INVESTMENTS IN PILOT CENTERS,A2 AND B2 SCENARIOS. ... 59
IMPACTS OF CLIMATE CHANGE ON WIND ENERGY POWER –FOUR WIND FARMS IN SPAIN TABLE 1.CHARACTERISTICS OF THE ANALYZED PLANTS. ... 64
TABLE 2.RESULTS FOR THE ADJUSTED PRICE (AP), SEASONAL DEVIATION (SD) AND ALIGNMENT RATIO (AR). ... 70
TABLE 3.CAPEX AND OPEX VALUES FROM LITERATURE (CLOSEST VALUES TO SPAIN HAVE BEEN INCLUDED WHEN AVAILABLE). .. 70
TABLE 4.HISTORICAL AVERAGE WIND SPEED VERSUS MEDIUM AND LONG-TERM PROJECTIONS.. ... 71
TABLE 5.HISTORICAL AVERAGE PRODUCTION VERSUS MEDIUM AND LONG-TERM PROJECTIONS.. ... 72
TABLE 6.FULL LOAD HOURS AT EACH WIND FARM. ... 74
TABLE 7.OPERATING MARGINS AT EACH PLANT IN THE REFERENCE PERIOD AND IN THE PROJECTIONS UNDER OFFICIAL COST PARAMETERS.. ... 75
TABLE 8.OPERATING MARGINS AT EACH PLANT IN THE REFERENCE PERIOD AND IN THE PROJECTIONS UNDER COST PARAMETERS PROVIDED BY ACCIONA. ... 75
TABLE 9.OPERATING MARGINS AT EACH PLANT IN THE REFERENCE PERIOD AND IN THE PROJECTIONS UNDER OFFICIAL COST PARAMETERS. ... 75
xiii
THE INFLUENCE OF CLIMATE ON ELECTRICITY DEMAND IN THE BASQUE COUNTRY IN THE CONTEXT OF CLIMATE CHANGE
TABLE 1.SECTOR DISTRIBUTION OF ELECTRICITY DEMAND FROM 2012-2017.. ... 85 TABLE 2.CORRELATION BETWEEN DEMAND AND HDD+CDD BY PROVINCE AND SECTOR. ... 87 TABLE 3.ANALYSIS OF SENSITIVITY OF CORRELATIONS IN THE RESIDENTIAL SECTOR TO HDD AND CDD THRESHOLDS. ... 88 TABLE 4.THE PROJECTED DECREASE IN CONSUMPTION, ECONOMIC SAVINGS, AND EMISSIONS REDUCTIONS IN THE RESIDENTIAL
xiv
Acronyms and abbreviations
- AR5: Fifth Assessment Report of the
IPCC.
- AEMET: State Meteorology Agency of
Spain.
- CDD: Cooling Degree Days.
- CAPEX: capital expenditure.
- CEDEX: Center for Studies and
Experimentation of Public Works (CEDEX) under the Ministry of Public Works in Spain.
- CFSR: Climate Forecast System
Reanalysis by the National Centers for Environmental Prediction.
- CIRA: Climate Change Impacts and
Risk Analysis Project from the US Environmental Protection Agency.
- CSP: Concentrated Solar Power.
- ENSO: El Niño–Southern Oscillation.
- EURO-CORDEX: Regional climate
model inter-comparison project.
- EVE: Basque Energy Agency (Basque
Government).
- GCM: Global Circulation Model.
- GDP: Gross Domestic Product.
- GHG: Greenhouse Gas.
- GW: Gigawatt.
- HDD: Heating Degree Days.
- IDAE: Institute for the Diversification
and Saving of Energy under the Ministry for the Ecological Transition in Spain.
- IEA: International Energy Agency.
- INE: Spanish Statistical Office.
- IPCC: Intergovernmental Panel on
Climate Change.
- IRENA: International Renewable
Energy Agency.
- IS: Investment subsidy.
- kWh: Kilowatt hour.
- LCOE: Levelised Cost of Energy.
- MERRA 2: Modern-Era Retrospective
analysis for Research and
Applications, Version 2, by NASA.
- MW: Megawatt.
- MWh: Megawatt hour.
- NCEP: Climate Forecast System
Reanalysis, by the National Center for Environmental Prediction (NCEP) in the US.
- OECD: Organisation for Economic
Co-operation and Development.
- OMIE: Operador del Mercado Ibérico
(Iberian Market Operator).
- OPEX: operational expenditure.
- PV: Photovoltaic.
- RCM: Regional Circulation Model.
- RCP: Representative Concentration
Pathway of the IPCC.
- SAIH: Automatic Hydrologic Data
Collection System, of the Ministry for the Ecological Transition in Spain (former Ministry of Agriculture, Food and Environmental Affairs).
- SRES: Special Report on Emissions
Scenarios by the IPCC.
- UK: United Kingdom.
- UKCP: UK Climate Projections.
- US, USA: United States of America
1
Motivation and structure of the Thesis
1. Motivation
Climate change has become an increasingly important area of research and as a result an exponential increase of scholarly publications on this topic has been registered in the last few years [1,2]. Within climate related areas, risks and adaptation played a smaller role in literature and in the reports by the Intergovernmental Panel on Climate Change (IPCC) until its Fourth Assessment Report [1,3]. This gap is still relevant in practical issues like climate finance [4].
Climate change is not a yes or no issue. We are already dealing with changes caused by climate change, and irrelevant to the scenario and how quickly or in what capacity the international community reacts to reduce the causes of anthropogenic climate change, humans will have to face these impacts [5].
The paradox of electricity generation is that it is the economic sector with the highest Greenhouse Gas (GHG) emissions due to the use of fossil fuels [6]. But at the same time, it will be severely affected by the impacts of climate change [7,8]. This will impact electricity supply and also demand, as it can alter consumption patterns in various sectors [9].
Renewable energies are usually mentioned as one of the most promising solutions the sector can offer reduce of GHGs [10,11]. But they rely on resources that depend on climate variables and therefore can also be affected by climate change [12].
2. Objectives of the Thesis
This thesis addresses climate change impacts on renewable energies and demand, building upon existing literature and trying to provide specific examples so that the impacts can be understood and valued. To do so, the papers included here provide economic estimates of the identified changes, which is one gap that has been found in most existing research on this topic.
The objective, therefore, is to analyse and quantify the specific effect on the generation and demand of electricity in real scenarios. In this sense, we focus on certain plants or limited geographical areas in order to provide useful methods and approaches for decision makers.
To this end, the thesis combines a first opening chapter, which summarizes the state of the art in terms of impacts on renewable energy, with three quantitative chapters. Each of the latter is dedicated to unravelling the specific impact of climate change on hydroelectric and wind generation, as well as on demand. To do so, we use different numerical methods that allow for the inclusion of climate projections in models that explain the operation of each system.
Quantifying these specific impacts is not simple, due to the large number of variables that can affect the energy sector in the long term. The approach used is based on applying the expected
changes to each ceteris paribus reference scenario. This does not prevent the analysis of other physical,
economic, or regulatory variables that may be relevant in each case and vary the expected scenario. In the same regard, due the large number of issues that could influence the areas analysed in the long term, each chapter focuses on the most relevant climatic variable for the field of study (runoff, wind speed, and temperature), which will be adapted to the needs of the models used and interrelated with the context of each chapter.
In all chapters we have worked together with parties directly related to the object of the study, such as managers of the hydroelectric and wind plants, public administrations, and autonomous bodies in charge of energy. The responsibility, in any case, is solely and exclusively of the authors. 3. Structure of the Thesis
The thesis as a whole is made up of four chapters. All of them have been published or accepted for publication as papers in various scientific journals. A reference will be made at the beginning of each chapter.
2
The first chapter was originally intended as an introduction to the thesis, but soon became a piece of research in and of itself. It provides an overview of existing studies that offer quantitative projections of climate change impacts on renewable generation. It addresses hydropower, wind generation, solar and other renewable sources and summarizes the impacts and the most relevant studies on each topic.
To do so, this chapter analyses more than 150 references on the matter in an attempt to offer a guide for researchers and decision makers on the existing projections for each field and technology, while also showing the methodological divergences and uncertainties that they address. The results should be interpreted with caution for these reasons and, furthermore, because most references are very recent, as explained in the text. In any case, important consequences for the sector can be drawn from the observations of the trends shown. Those working in the field called for such a review, which also provides a broad context as an introduction to the remaining chapters.
The second and third chapters focus on hydropower and wind generation, respectively. Both papers use some modelling to project production under climate change scenarios and provide economic estimates of the changes as well as conclusions for the design of policies in this area. They are, as far as we know, the only existing works that combine a specific and concrete analysis for generation plants with an economic study of operating margins and investment parameters.
The second chapter analyses three hydroelectric power plants in Southern Spain combining climatological, technical and economic data and projections. A physical model is applied to reproduce the plants’ operations and project future flow and production under climate scenarios. The operation of these plants is simulated using an engineering model, which quantifies how the production of different types of plants changes based on variables such as plant’s net height, expected daly flow rate, or efficiency factors. The model has been adjusted to the different types of plants studied: run-of-river (Mengíbar), annual reservoir (Cala), and multiannual (Tranco de Beas).
An analysis of operating margins and investment parameters is conducted showing that climate change may pose a significant threat to the operation of the plans and to future investments. In the context analysed in the first chapter, these implications are highly relevant for much of Southern Europe. The analysed loss of hydroelectric production would not only have implications for direct costs, but also for supply security and the mitigation of climate change.
The third chapter is dedicated to wind power generation and studies four wind farms in Spain. Several methods were tested and the projection was eventually based on ex post power curves, obtained by analyzing the historical performance of each farm. This means calculating the average active power per bin of wind speed throughout the historical period.
A projection of wind speed is later carried out by conducting a downscaling of an ensemble of climate models for two scenarios. Results show how these scenarios may affect production, operating margins and investment parameters. The seasonality of production is also expected to change. In the study, climate change impacts are compared with current and ongoing changes in the sector’s regulatory framework.
The fourth paper analyses climate change impacts in electricity demand in the Basque Country (Spain). The methodology is based on the analysis of the thermal distance on cold and warm days
with respect to established thresholds (Heating Degree Days and Cooling Degree Days). This distance
was found to be better correlated with demand in the residential sector than in others. Based on climate projections, the future demand is projected. The implications in terms of demand, economic savings and emissions are discussed.
The main conclusions of the article are that it appears likely, in the context of the assumptions presented, that climate change will imply net economic savings, as well as a reduction in both consumption and emissions. The fundamental reason being that, although the increase in temperature is expected to be greater in summer than in winter, in a climate like that of the Basque Country the deviations from comfort temperatures are more significant in the winter. In any case, research must continue in order to confirm these results, given that there is an open debate on this in the literature.
3
References
[1] R. Haunschild, L. Bornmann, W. Marx,
Climate Change Research in View of Bibliometrics, PLoS One. 11 (2016) e0160393.
doi:10.1371/journal.pone.0160393.
[2] A. Hillier, R.P. Kelly, T. Klinger,
Narrative style influences citation frequency in climate change science,
PLoS One. 11 (2016) 1–13.
doi:10.1371/journal.pone.0167983.
[3] T.J. Bassett, C. Fogelman, Déjà vu or
something new? The adaptation concept in the climate change literature,
Geoforum. 48 (2013) 42–53.
doi:10.1016/j.geoforum.2013.04.010.
[4] I. Larrea, I. Galarraga, K. Solaun, Las
finanzas del clima. Una revisión,
Ekonomiaz. (2018) 246–266.
http://www.euskadi.eus/web01-a2reveko/es/k86aEkonomiazWar/ekon omiaz/abrirArticulo?idpubl=89®istr o=16.
[5] Intergovernmental Panel on Climate
Change (IPCC), Climate Change 2014 Synthesis Report Summary Chapter for Policymakers, IPCC, 2014 Clim. Chang. 2014 Synth. Report. Contrib. Work. Groups I, II III to Fifth Assess. Rep. Intergov. Panel Clim. Chang. [Core Writ. Team, R.K. Pachauri L.A. Meyer (Eds.)]. IPCC, Geneva, Switzer. (2014) 31. doi:10.1017/CBO9781107415324.
[6] Intergovernmental Panel on Climate
Change (IPCC), Climate Change 2014 Mitigation of Climate Change, 2014.
doi:10.1017/CBO9781107415416.
[7] J. Ebinger, W. Vergara, Climate Impacts
on Energy Systems: key issues for energy sector adaptation, The World Bank, Washington, DC, USA, 2011.
[8] P.C. Johnston, Climate Risk and
Adaptation in the Electric Power Sector,
Asian Development Bank -
Publications, Manila, Phillippines, 2012. https://www.adb.org/sites/default/files /publication/29889/climate-risks-adaptation-power-sector.pdf.
[9] L. Wenz, A. Levermann, M.
Auffhammer, North – south
polarization of European electricity consumption under future warming,
(2017) 1–9.
doi:10.1073/pnas.1704339114.
[10] OECD/ IEA, Energy and Climate Change. World Energy Outlook Special Report, International Energy Agency,
Paris, France, 2015.
doi:10.1038/479267b.
[11] IRENA, Global Energy Transformation. A roadmap to 2050, International Renewable Energy Agency, Abu Dhabi, United Arab Emirates, 2018.
[12] R. Contreras-Lisperguer, K. de Cuba, The Potential Impact of Climate Change on the Energy Sector in the Caribbean
Region, OAS Pap. (2008).
http://www.oas.org/dsd/documents/eff ects_of_climate_on_energy_dsd_energ y_division.pdf
4
Climate Change Impacts on Renewable Energy
Generation. A review of quantitative projections
1
Abstract: Research on climate change impacts on renewable energy is becoming increasingly relevant due to the vulnerability of the sector and to the continual development of methodologies and availability of data. Public and private decision-making needs specific research. However, many gaps still exist in certain geographical regions and technologies. This paper addresses the most relevant studies that project quantitative estimates of climate change impacts on solar, wind, hydro and other renewable generation technologies. Summary tables of impacts and projections are provided so that researchers, governments and the private sector may have an accurate view of the state-of-the-art on this topic.
Keywords: climate change, climate change adaptation, renewable energy, energy economics.
1. Introduction
Renewables will be key in a low carbon future. In order to meet the 2ºC climate goal, the share of renewable energy in the final energy consumption must increase from 19% in 2017 to 65% by 2050 [1]. By then, the share of renewable energy in electricity generation should be roughly 85%, up from an estimated 25% in 2017.
The physical impacts of climate change are among the challenges that renewables will have to face, as they have implications for the reliability and performance of the energy system [2,3]. Initial studies on this topic addressed the vulnerability of the energy sector from a demand perspective, but there are a growing number of studies analysing impacts on supply as well [3]. Transmission lines and other areas along the value chain of the energy sector can also be affected [4,5].
One of the reasons why the energy sector has received so much attention in the literature is because of the long lifespan of energy infrastructure [6]. Within the energy sector, renewable generation is the focus of most studies, due to the fact that its main resource is directly linked to climate variables such as precipitation, temperature, irradiation or wind [7]. Water is a key variable, as its availability not only affects hydroelectric power plants, but also any generation plant that depends on water for part of its process, including thermal generation [8] or even carbon capture and storage [9].
The goal of this paper is to conduct a review of studies that provide a quantitative estimate of climate change impacts on renewable energy. Notwithstanding methodological differences and regional variations, the authors consider this useful not only to researchers and the public sector, but also to sectoral experts working to incorporate climate impacts into energy sector decision-making processes around the world. The following section gives a description of the scope and methodology of this paper. Sections 3-6 provide a summary of studies regarding solar, wind, hydro and other renewable generation technologies. The paper closes with some discussion and concluding remarks. 2. Methodology
Most of the existing literature on this topic can be divided into the following categories.
- Most references provide an overview of potential climate change impacts on energy, with
some specific section for renewable energy. These studies focus on identifying and analysing risks more than on their specific quantification [10].
1 This chapter has been accepted for publication as a paper in the journal Renewable & Sustainable
5
- Many references focus on one technology and provide projections of potential changes in
the resource or generation. The scope of these papers can be global, continental, national or even locally focused on specific power plants.
- Another group focuses on a geographical area (mostly countries, but also continents, regions
or cities), projecting how various technologies can evolve under climate change scenarios and affect the energy market.
- Only a few references, usually global assessments or studies related to hydropower, provide
economic estimates for the expected changes.
This review has been organized by technology rather than geographical area, so that the specific complexities of each technology can be better understood. Due to the vast amount of existing literature for some technologies (particularly covering hydro and wind), the authors have focused on studies with at least a national scope, or those that provide valuable insights or innovations. At the same time, in these cases, more recent and specific papers have been prioritized.
Common limitations and uncertainties of these studies will be analysed later. In any case, the reader must to be cautious when comparing results, as often there are differences in models, scenarios, projection methods and timeframes. Summary tables have been included at the end of each section in order to provide a clearer overview, and to make it easier to check specific references. Only papers with quantitative models and estimates have been included in the tables.
When it comes to the scenarios, studies conducted before 2014 tend to use scenarios by the SRES [11] while later studies are usually based on those by the AR5 [12].The former is based on four families of emission scenarios (A1, A2, B1 and B2) depending on the focus of future development (economic -A- or environmental – B-) and on its homogeneity (globalized -1- or with a regional focus -2-). The latter provides four trajectories of greenhouse house concentrations in the long term (2.6, 4.5, 6.0, and 8.5 W/m2). The higher the concentration, the higher the projected increase of global temperature. The pathways were built with Integrated Assessment Models (IAMs) under several assumptions related to energy, demography or the economy.
3. Hydroelectric power plants
3.1. Overview, impacts and methodological issues
Hydroelectric generation provides more than 1000 GW of installed capacity, but annual increases are waning. China, Brazil, Canada and the US are global leaders in annual installed capacity [13]. The share of hydro in total generation is expected to decrease by 2050, due to the spike in energy demand and in other renewable technologies [1]. According to the same source, total installed capacity should increase from 1248 GW in 2015 to 1828 GW in 2050. Areas with the greatest gross potential are Asia, America and Central Africa [14].
The levelised cost of hydroelectric generation has increased from 0.04 USD/kWh in 2010 to 0.05 in 2017 [15]. Hydroelectric generation is characterized by high capital costs, which can make it vulnerable to long-term impacts, as the investment horizon is typically several decades [16,17].
Assessing climate change impacts on hydropower is complex, due to nonlinear and region-specific changes in precipitation and temperatures [3]. In any case, the literature on hydropower is vaster than that on other technologies. Most studies focus on variations in streamflow due to changes in precipitation and temperature.
Run-of-river plants, which lack water storage, are significantly affected by daily and seasonal changes [4,6]. Storage capacity can be valuable when matching the inflow of water with the operational capacity of the plant [6,18]. However, the additional capital costs for storage plants may not be economically justified, due to changes in the resource in some cases [18–20].
Overall impacts on hydropower are projected to be smaller when compared to other technologies, but local impacts will most likely be greater. Therefore, from an economic standpoint there is a clear risk to financial returns on investments as certain studies have shown [19,21]. This is
6
why the literature on hydropower includes economic assessments more often than that on other technologies.
The main climate threats and impacts on hydropower are shown in Table 1.
Table 1. Main threats and impacts on hydropower generation.
CLIMATE
THREATS IMPACTS
1. Change in rainfall
patterns a) Changing annual or seasonal patterns can impact river flows and water levels affecting production [3,4,22]. Not only a reduction in flow can be negative; an increase can also affect operational conditions depending on the capacity of the plant [21].
b) Changes in precipitation and temperature may affect the moisture
levels of soil, which provides storage and regulates runoff [21].
c) Siltation as a consequence of erosion can affect the soil and reduce
power output [4,21].
2. Flooding and
intense rain a) Flooding can damage infrastructure and increase the need for spilling water [4,19].
b) Flooding may pose a significant risk to dam safety [17,23].
c) Flooding can also transport debris and damage dams and turbines [3].
3. Air temperature a) Higher air temperature would increase surface evaporation, reducing
water storage and power output [4,20].
b) Ice melting can alter the seasonal inflow of water to plants that rely on
snowfalls or glaciers [6,21] and pose safety risks [23]. However, it might lead to early gains for some plants [24].
c) An increase in temperature might increase operational costs and affect
the efficiency of the equipment [24]. In particular, it can affect gate performance and cause mechanical stress [23].
4. Others a) El Niño Southern Oscillation influences precipitation and has been
found to affect production in some areas of America, the Iberian Peninsula, Asia and the Pacific [25]. Southern Africa could be impacted as well [20].
b) The performance of gates can be affected by an increase in sediment
content in the water and suspended materials [23].
c) Landslides increase the level of sediments in water, which can cause
other problems, especially in areas with high agricultural activity [22].
d) Increased intensity and frequency of storms and extreme weather
events may affect the plants [21].
e) Conflicts with other uses (especially irrigation) can affect the
availability of water [19,20].
3.2. Main projections in literature
Globally, the results of existing studies differ due to differences in methodology and the Global Circulation Model (GCMs) considered [26]), but also because some studies focus on projected production whereas others center on hydropower potential [27]. If the increase in potential is located in areas with little installed capacity, production may in fact decrease [28].
In terms of production, the trend projected by Reference [18] is of a very slight increase (<1%) but with stark regional differences. A later study [27] projects a global increase in gross potential of between 2% and 6%, while a more recent paper [26] provides a less clear projection of production
7
(from -8% to +5% depending on the scenario). Combining economic and physical information, Reference [29] projects a global change in generation of between 0.9% and 2.4%.
Two of these papers provide an economic evaluation of the changes. One of them [26] projects a very small change in expected investments (0.5%), and the other [29] uses a general equilibrium model to assess expected changes in GDP, which are modest (+/- 0.2%).
Global papers provide different geographical projections. For the US, for example, some papers [18,29] project an increase in generation and others a decrease. Regarding Europe as a whole, all studies project a decrease. The trend for other continents is less clear, but usually Asia and Central/East Africa show the biggest increases.
Specific studies on Europe confirm the above-mentioned projections, estimating an increase in generation/potential in the north and certain Central European locations, and a stark decrease in the south with maximum changes of +/- 20-25% [30–32]. A few models project decreases in hydropower potential of close to 30% in Greece, Spain and Portugal, which are the most affected countries [30].
This is consistent with some evidence of a reduction in global runoff throughout the 20th century [33],
with clearer evidence in Southern European countries since the 1970s [31]. Some studies [8,34,35] project a decrease in generation/potential in Germany, Austria and Croatia.
Many papers focus on Alpine hydropower due to the specific impacts linked to snow-influenced environments. The results vary significantly [36,37], which shows the complexities of the quantification of expected flows in these environments.
In the Americas, the US is by far the most studied area. The complexity found in global studies is also present in more specific papers. Two reports to Congress have offered varied results depending on geography and models [38,39]. In the latest assessment, half of the models suggest a global increase in generation whereas the other half project a decrease. A recent paper [40] provides a very different picture, projecting a global increase in generation mainly driven by increases in the
Northwest2. Seasonal variations are expected to be highly relevant and to affect the availability of
hydro generation throughout the year. Targeted studies have been conducted in several areas of the country [41,42].
There are fewer studies covering the rest of the American continent. In Central America, projections point towards a decrease in precipitation and an important increase in droughts [43,44]. In Costa Rica, one study [45] projects huge decreases in hydropower production (-41-43%). When it comes to the Caribbean, no quantitative projections have been found, but run-off decreases have been predicted for this area. The most affected countries would be the Dominican Republic, Haiti, eastern Caribbean small island states, Mexico and Guatemala [7].
Regarding South America, precipitation is expected to change as well. There is a consensus on some seasonal variations, such as an increase in summer precipitation over eastern tropical South America and a reduction of winter precipitation over most of the continent [46]. Brazil has been extensively studied because of its high hydroelectrical production, and reductions have been projected for the country [47–49], as well as for Colombia [50].
A drop in precipitation is expected for all seasons in some areas of the Andean region [46]. In Ecuador, a recent study provides a wide range of estimates for changes in production (from -55% to +39%) [51]. On the other hand, a study in Chile [52] suggests a reduction in hydroelectric production of between 5% to 6% in the short term and 13% to 18% in the long term.
Asia and Africa have received less attention. Existing studies in China tend to confirm the increasing trend forecasted by global studies, although the timeframes differ and there are regional differences [53,54]. Regarding India, a recent study projects a significant increase in precipitation, flow and hydropower production (up to 25%) for large hydropower projects [55]. However, the high variability of rain and runoff projected by some models and the impacts of glacier melting may jeopardize hydroelectric projects in the region [56,57].
8
With respect to Africa, Southern Africa is expected to be highly vulnerable and a relevant decrease in rainfall is predicted [58]. The river Congo appears to be less vulnerable, while the Zambezi River is expected to face higher impacts [21]. In the case of the latter, one study projects impacts from changes in streamflow, but also dry years, flooding and increasing water demand [59]. A more recent paper concluded that many projects in this basin face significant climate change risks [20].
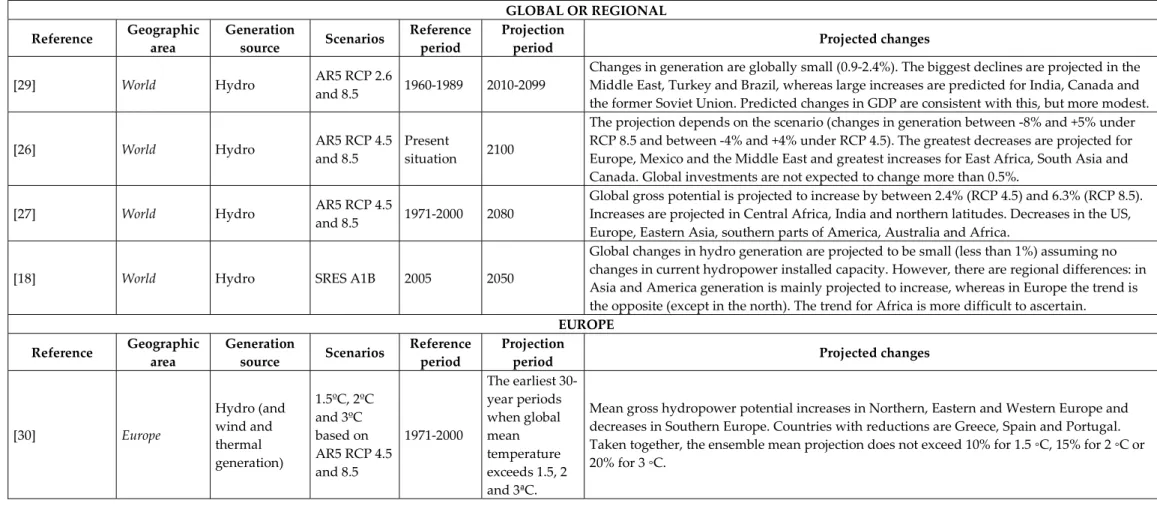
Table 2. Most relevant studies on climate change impacts on hydropower generation3.
GLOBAL OR REGIONAL
Reference Geographic area Generation source Scenarios Reference period Projection period Projected changes
[29] World Hydro AR5 RCP 2.6 and 8.5 1960-1989 2010-2099 Changes in generation are globally small (0.9-2.4%). The biggest declines are projected in the Middle East, Turkey and Brazil, whereas large increases are predicted for India, Canada and the former Soviet Union. Predicted changes in GDP are consistent with this, but more modest.
[26] World Hydro AR5 RCP 4.5
and 8.5
Present
situation 2100
The projection depends on the scenario (changes in generation between -8% and +5% under RCP 8.5 and between -4% and +4% under RCP 4.5). The greatest decreases are projected for Europe, Mexico and the Middle East and greatest increases for East Africa, South Asia and Canada. Global investments are not expected to change more than 0.5%.
[27] World Hydro AR5 RCP 4.5 and 8.5 1971-2000 2080 Global gross potential is projected to increase by between 2.4% (RCP 4.5) and 6.3% (RCP 8.5). Increases are projected in Central Africa, India and northern latitudes. Decreases in the US, Europe, Eastern Asia, southern parts of America, Australia and Africa.
[18] World Hydro SRES A1B 2005 2050
Global changes in hydro generation are projected to be small (less than 1%) assuming no changes in current hydropower installed capacity. However, there are regional differences: in Asia and America generation is mainly projected to increase, whereas in Europe the trend is the opposite (except in the north). The trend for Africa is more difficult to ascertain.
EUROPE
Reference Geographic area Generation source Scenarios Reference period Projection period Projected changes
[30] Europe Hydro (and wind and thermal generation) 1.5ºC, 2ºC and 3ºC based on AR5 RCP 4.5 and 8.5 1971-2000 The earliest 30-year periods when global mean temperature exceeds 1.5, 2 and 3ªC.
Mean gross hydropower potential increases in Northern, Eastern and Western Europe and decreases in Southern Europe. Countries with reductions are Greece, Spain and Portugal. Taken together, the ensemble mean projection does not exceed 10% for 1.5 ◦C, 15% for 2 ◦C or 20% for 3 ◦C.
3 Studies are shown in a way that makes it easier to compare similar papers, starting with the most recent literature. They are organized first according to their
geographical area, so that studies with a wider scope are presented first. Then they are grouped by comparable geographical areas. Lastly, within a comparable area, more recent studies are shown first.
[32] Europe Hydro (and other) SRES A1b and E1 2010 2100 A reduction in global generation is projected of between 2% and 8% depending on the scenario. In some Southern, Eastern and Central European countries the reduction could be roughly 20%, whereas in Northern European countries the increase may exceed 20%.
[31] Europe Hydro SRES A1B 1961-1990 2020s, 2070s
A clear decreasing trend in hydropower potential is seen in Southern Europe and parts of East-Central Europe, particularly in Spain, Bulgaria, Ukraine and Turkey (with maximum decreases of more than 25%). A clear increasing trend is found is large areas of Northern Europe, particularly in Norway, Sweden, Finland and Russia (with maximum increases of more than 25%).
[35] Germany and Austria Hydro (among others) SRES 4AR A1b 1971–1989 2051– 2080 The mean annual hydro power electricity generation for Austria and Germany is projected to decrease by 5.5%. A clear shift from summer to spring is observable.
[8] Germany Hydro (among others) AR5 RCP 2.6 and
8.5
1981–2010 2015-2050 RCP 2.6 suggests an overall reduction in hydropower potential, especially in many areas of Northern Germany, but never greater than 20%. RCP 8.5 projects greater reductions.
[34] Croatia Hydro (along with solar and
wind)
SRES A2
scenario 1961-1990 2011-2040 and 2041-2070 A reduction of more than 10% in the production of electricity from hydro power plants could be expected after 2050.
[37] South-East Alpine Region Hydropower SRES A1B 1971-2000 2040-2070 An increase in precipitation and hydropower is projected in almost all sites and scenarios. Increase in potential can be as high as +193% in one specific plant. Changes in seasonality are projected as well.
[36]
Swiss Alps (Dam of
Mauvoisin) Hydropower Ad-hoc 1961-1990 2070-2099
The median future production is expected to fall by 36%. This decrease is due to the reduced availability of water (less precipitation, ice melting and evapotranspiration).
AMERICA
Reference Geographic area Generation source Scenarios Reference period Projection period Projected changes
[39] US Hydropower AR5 RCP 8.5 1966-2005 2011-2050 There is no agreement between the models on the total change in generation (half of them project an increase and half a decrease). Regarding seasonal variations, an increase in winter and spring and a decrease in summer and autumn are projected.
[40] US Hydropower From the CIRA Project (Reference scenario, Pol 4.5, Pol 3.7). 2005 2025, 2050
An increase in generation is projected driven by the important increase in the Pacific
Northwest region. However, under a “firm energy criteria”, a decline in reliable generation is projected due to expected seasonal variations.
[38] US Hydropower SRES A1B 1960-1999 2010-2024 2025-2039 Highly variable trends in the projected precipitation and runoff. Most increasing regions are in the central North and decreasing areas in the South and Northwest. The only statistically significant changes are seasonal variations in some regions.
[42] Northwest US Hydropower 3AS A1F1, A2, B1, B2 1961-2002 2020s-2080s Most models project a decrease in generation in this area and a reduction in revenues. Using 4AR scenarios the results are slightly less severe.
[48] Brazil Hydropower SRES A1B 1960-1990 2011-2100 A reduction in the hydropower energy fraction is predicted over time, which will cause a yearly loss of 5.13 billion USD for the existing generation system and 12.2 billion USD for the future generation system.
[47] Brazil Hydropower AR5 RCP 4.5 and 8.5 2010 2050 Hydropower will remain the major source of electricity generation in the country but will lose relative importance. Impacts are more intense under RCP 8.5 than under RCP 4.5.
[49] Brazil Hydropower (among
others) SRES A2, B2 2006 2071-2100
A reduction in power is projected for all basins except Paraná River and Grande (for the A2 scenario). Reductions range from 1-7% in scenario B2.
[45] Costa Rica Hydropower SRES A2, A1B and B1 2009 2100 Results show a reduction in hydropower production in all scenarios, estimated between 41% and 43%. [51] Ecuador Hydropower AR5 RCP 4.5 1971-2000 2071-2100 There is much uncertainty surrounding projections. Regarding annual average inflow,
estimated changes are between -85% to +277%, and for production between -55% and +39%. [52] Chile Hydropower SRES A2, and B1 1970-2000 2010-2100
An overall reduction in hydropower production is expected for the Interconnected Central System. The reduction is projected to increase over time: 5-6% for 2010-2040, 10-12% for 2040-2070 and 3-18% for 2040-2070-2100. [50] Colombia (Sinú-Caribbean Basin)
Hydropower SRES A2, and B2 1964-2005 2010-2039 The production of hydropower is expected to change between 0.6% and -35.2% depending on the model (only one projects an increase).
ASIA
Reference Geographic area Generation source Scenarios Reference period Projection period Projected changes
[54] China Hydropower AR5 RCP 2.6, 4.5 and
8.5 2011 2100
Hydropower generation is expected to increase under all scenarios, potentially reaching as much as 23% by the end of the century.
[53] China Hydropower AR5 RCP 2.6 and 8.5 1971-200 2010-2084 Both scenarios show a small decrease in gross hydropower potential before the 2030s and an increase afterwards. Decreases are projected for the southeast region and increases for most of the rest.
monsoon season. Under RCP 8.5, this would mean increases of up to 45% in streamflow and up to 25% in hydropower production.
AFRICA
Reference Geographic area Generation source Scenarios Reference period Projection period Projected changes
[20] Southern Africa (Zambezi River) Hydropower Ten ad hoc scenarios derived from SRES A2 1961-1990 2050-2070
A reduction in generation is projected for all existing plants, except one. Higher temperatures and increase in evaporation may neutralize the increase in precipitation. Regarding future projects, the results will depend on whether irrigation is prioritized over hydropower, but many projected plants may not reach their targets. The influence of El Niño Southern Oscillation (ENSO) adds uncertainty to future projections.
[59]
Southern Africa (Zambezi River)
Hydropower SRES A2 1970-2000 2010-2040 2040-2070 A reduction in hydropower potential is expected for both existing and proposed plants. The trend would have an inverted U shape for all plants, with some increases until 2017 in the first period and until 2050 in the second.
13
4. Wind generation
4.1. Overview, impacts and methodological issues
Wind energy generation in 2017 accounted for 539 GW of installed capacity, including almost 20 GW of offshore capacity worldwide, the majority of which comes from China, the US, Germany and India [13]. In order to meet the 2ºC target, wind generation should increase from around 3.5% of global generation in 2015 to 36% in 2050. This would require an investment of more than 5 trillion USD in onshore generation [1].
As wind turbines become bigger and taller, they also become more vulnerable [60]. Safety margins in the design and operation of offshore wind turbines should be increased to adapt to climate change [61].
The levelised cost of onshore wind is among the lowest in renewable generation, with a slight reduction from 0.08 USD/kWh in 2010 to 0.06 in 2017. Offshore wind is still more expensive, at 0.14 USD/kWh in 2017 [15]. Usually wind farms face high capital expenditure and low operational costs [62].
Wind is more sensitive to model formulation than other technologies [63]. There is some debate over the capacity of climate models, especially GCMs, to fit with observed data and to simulate long-term trends [64,65], but they are still the most trusted source for projections [66]. There is also uncertainty surrounding how to separate the climate signal from the climate’s inherent variability, as well as regarding long-term records of wind speeds [65].
This is why, for some authors, focusing on projected changes is considered more accurate than relying on absolute predictions [67]. It is also key to provide estimates adapted to the height of wind turbines and for the upper percentiles of the wind speed probability distribution, not just the mean speed [65].
Output is highly dependent on wind speeds, and a small change can have a substantial impact on electricity generation [4]. Therefore, a large percentage of existing studies focus on wind speed, while only a few provide estimates of changes in wind direction. The statistical significance of the trends is often hard to assess [68].
Most studies focus on Europe and North America, and on changes in mean wind speed. Therefore, further studies should be developed regarding other regions and extreme wind events [60]. While the vast majority of studies focus on onshore production, offshore turbines are more vulnerable to higher wind speeds and maintenance is usually more expensive [60]. Assessing the impacts on them is more complex due to information gaps, and because GCMs struggle to represent offshore wind near the coast [69].
Regarding extreme wind speeds, loading conditions used in the design of turbines are based on studies in Europe, and may not be representative in other regions [70].
There are only a few studies that delve into the financial implications of climate change impacts on wind, focusing on a national level [62,71] or on individual wind farms [72].
There is also some debate over the opposite question of whether a massive deployment of wind energy could alter local weather conditions. So far, no major changes are anticipated, at least in Europe [73].
The main climate threats and impacts on wind generation are shown in Table 3.
Table 3. Main threats and impacts on wind generation.
CLIMATE
THREATS IMPACTS
1. Changes in wind
14
CLIMATE
THREATS IMPACTS
b) Within operational wind speeds, output is greatly affected by wind
speed, as the energy in the wind is the cube of wind speed [4,74,75] and many others.
2. Changes in daily or seasonal
distribution of wind
a) It can affect the match between wind energy input to the grid and
daily load demand [4,75].
b) Seasonal changes can affect the profitability of the plants due to the
evolution of price [72].
3. Changes in
temperature
a) Increasing air temperatures, as expected with climate change, will
lead to slight declines in air density and power output [60,74].
b) Drifting sea ice due to ice melting can damage wind turbine
foundations offshore [4,60,76] and affect operations at wind farms located in Northern latitudes [74].
c) Changes in extreme cold periods can affect output (e.g., through
turbine blade icing) [4]. Ice on turbine blades can affect performance and durability [60,77].
d) A rise in temperature might increase operational costs and affect the
efficiency of the equipment [24,78].
e) Extremely low or high temperatures may affect various components
of wind farms [60,79].
f) Changes in permafrost conditions may affect road construction and
repairs for wind farms [74].
4. Sea level rise a) Sea level rise could damage off-shore turbine foundations in low-lying
coastal areas [4] as well as onshore turbines in coastal locations [74].
5. Extreme weather
events
a) Any extreme event can damage infrastructure and complicate access
[4]. In this regard, hurricanes or storm surges can cause damage to offshore farms [4] and affect the lifespan of wind turbines [74].
b) The design of the turbine will be affected by expected turbulence
intensity, wind shear and transient wind conditions such as wind speed or directional changes [61,74].
c) During extremely high or low wind speeds, farms can be shut down
[80].
6. Others a) Changes in vertical wind shear, directional distribution and
turbulence intensity are relevant, but difficult to quantify with existing tools [3,74].
b) Large-scale circulation and seasonal patterns such as El
Niño/Southern Oscillation may affect wind [68].
c) Changes in wave activity may affect structural conditions of offshore
15 4.2. Main projections in literature
Many studies focus on Europe, and most agree on two questions: (a) there appears to be a north-south divide and (b) aggregated changes do not seem to jeopardize existing developments. Regarding the north-south divide, the general consensus points to an increase in wind energy potential in Northern and Central Europe, and to a decrease in Southern Europe [78,80–84]. Projected seasonality, however, seems to change depending on the model and area.
With respect to aggregated changes, the conclusion of many studies is that wind energy changes will not dramatically affect wind energy development in Europe [60,78,81]. Projected variations depend on the source. Changes in wind energy output can range from +/- 12% depending on the region [80], or +/- 5% with some exceptions [81,83].
However, according to a recent paper [75], the general trend is a reduction in wind energy density. This is particularly relevant during the summer (but also autumn and spring), while an increase is projected in winter in Northern and Central Europe. This decreasing trend was later
confirmed [85]in most areas across Europe, except in the Black Sea, where it is expected to remain
stable (which is consistent with Reference [86]). A recent paper [30] also projects a reduction of wind power potential in most countries except Greece.
Regarding offshore wind energy in Europe, one study projects a slight decrease in production
in most areas of Northern Europe and a clear reduction in the Mediterranean (except southwest of the Iberian Peninsula) [87]. These trends were later confirmed by Reference [78].
The above mentioned north-south divide in Europe is basically consistent with the results of studies at a national level. For the UK, one study projects increases in wind speed for the North Atlantic and North Scotland and a decrease in the English Channel and South England [62]. However, these projections mainly serve to provide a model for an economic evaluation of impacts on the levelised cost of wind energy. Another study projects little variation in mean annual production but relevant changes in seasonality [88], very similar to the projections for Ireland by Reference [89].
For Germany, studies do not seem to find great variations in the projected evolution of the resource [8,35] but one local paper highlights important changes in seasonality [90]. A large increase in wind speed is projected for Croatia, which could have a substantial impact on production [34].
When it comes to the Iberian Peninsula, the decreasing trend mentioned above is confirmed by Reference [91] and by Reference [92] with the exception of the Gibraltar Strait Area. When it comes to offshore wind, the results are similar, with an expected yearly reduction of wind speed and wind energy potential of less than 5% in most areas [69].
Some of the many studies focused on the US predict a reduction in mean wind speed consistent with the negative trend in observed data [67,93], but there is some debate over whether that change is significant and exceeds natural climate variability [65]. More recent papers provide a varied (and divergent) picture of future changes, without providing a global figure for the country [94–96]. There are also some local studies focused on smaller areas [63,97].
Brazil has also received attention in the literature. All existing projections are optimistic in terms of wind speed and generation, especially in the north and northeast, where most production is located, with projected increases between 10-20% [98–100].
Small variations in wind speed are projected for China by the end of the century, no matter the RCP considered [101], even though historical trends suggest a decline [102,103], which has been detected for the Tibetan Plateau as well [104]. Reductions in wind energy density are projected for
the Taiwan Strait throughout the 21st century [105].
One study uses a different approach than most papers, estimating production based on projections for temperature and radiation [106]. The forecasted trend predicts a decline in production in various wind farms in Iran.
Africa is the least studied area, probably due to the low development of wind energy generation [13]. Projections for Southern Africa point to almost no change in wind speed, with some seasonal variations [66].
16
There are also some studies on wave activity, which may be relevant for offshore farms. An increase is predicted for the Northeast Atlantic, the Baltic Sea, the North Sea and the Black Sea, whereas a decrease in wave heights is expected for the Mediterranean [60,107–109]. Wave energy generation will be analysed later in this paper.
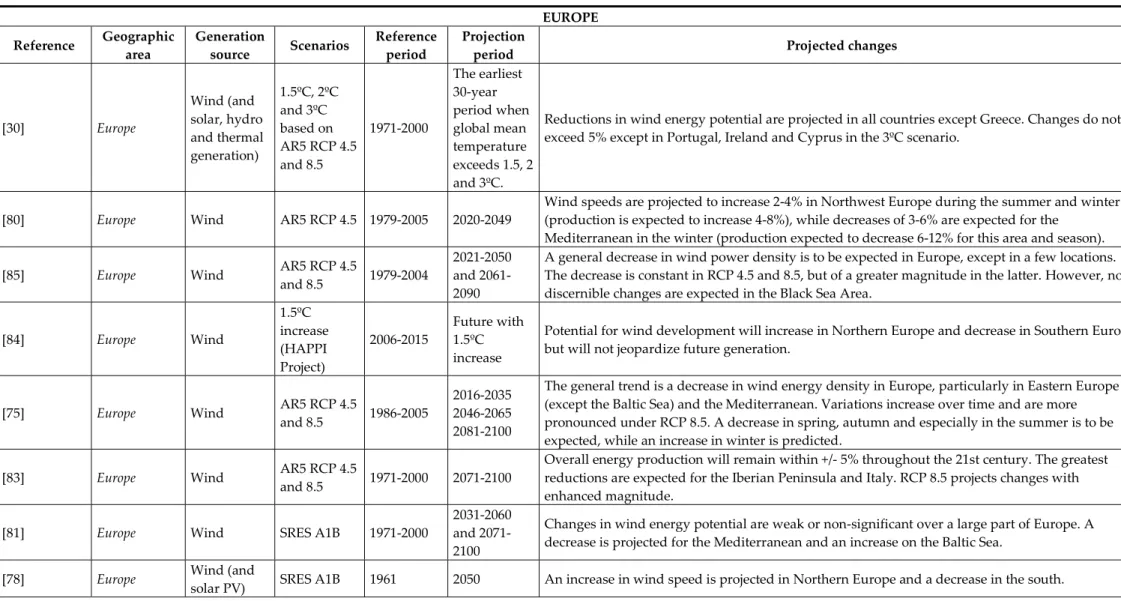
Table 4. Most relevant studies on climate change impacts on wind energy generation.
EUROPE
Reference Geographic area Generation source Scenarios Reference period Projection period Projected changes
[30] Europe Wind (and solar, hydro and thermal generation) 1.5ºC, 2ºC and 3ºC based on AR5 RCP 4.5 and 8.5 1971-2000 The earliest 30-year period when global mean temperature exceeds 1.5, 2 and 3ºC.
Reductions in wind energy potential are projected in all countries except Greece. Changes do not exceed 5% except in Portugal, Ireland and Cyprus in the 3ºC scenario.
[80] Europe Wind AR5 RCP 4.5 1979-2005 2020-2049 Wind speeds are projected to increase 2-4% in Northwest Europe during the summer and winter (production is expected to increase 4-8%), while decreases of 3-6% are expected for the Mediterranean in the winter (production expected to decrease 6-12% for this area and season). [85] Europe Wind AR5 RCP 4.5 and 8.5 1979-2004
2021-2050 and 2061-2090
A general decrease in wind power density is to be expected in Europe, except in a few locations. The decrease is constant in RCP 4.5 and 8.5, but of a greater magnitude in the latter. However, no discernible changes are expected in the Black Sea Area.
[84] Europe Wind 1.5ºC increase (HAPPI Project) 2006-2015 Future with 1.5ºC increase
Potential for wind development will increase in Northern Europe and decrease in Southern Europe but will not jeopardize future generation.
[75] Europe Wind AR5 RCP 4.5 and 8.5 1986-2005
2016-2035 2046-2065 2081-2100
The general trend is a decrease in wind energy density in Europe, particularly in Eastern Europe (except the Baltic Sea) and the Mediterranean. Variations increase over time and are more pronounced under RCP 8.5. A decrease in spring, autumn and especially in the summer is to be expected, while an increase in winter is predicted.
[83] Europe Wind AR5 RCP 4.5 and 8.5 1971-2000 2071-2100 Overall energy production will remain within +/- 5% throughout the 21st century. The greatest reductions are expected for the Iberian Peninsula and Italy. RCP 8.5 projects changes with enhanced magnitude.
[81] Europe Wind SRES A1B 1971-2000
2031-2060 and 2071-2100
Changes in wind energy potential are weak or non-significant over a large part of Europe. A decrease is projected for the Mediterranean and an increase on the Baltic Sea.
[82] Europe Wind SRES A1B 1961-2000 2001-2100 Regarding wind energy potential, an increase is expected in Northern and Central Europe, particularly in winter and autumn. A decrease is predicted in Southern Europe, expect for the Aegean Sea. Changes in wind energy output follow the same pattern but of a smaller magnitude. [86] Black Sea Area Wind AR5 RCP 4.5 and 8.5 1981-2010 2021-2050 No relevant differences in wind speed are projected. Both RCPs provide similar results, but 4.5 shows a small decrease and 8.5 a slight increase in most areas. [87] Northern Europe Wind (offshore) SRES A1B 1972-2001 2020-2049 A weak reduction in production is projected in most areas except in the Baltic Sea (-2 to -6%). A clear reduction is projected for the Mediterranean.
[35] Germany and Austria
Wind (among
others) SRES A1B 1971–1989
2051–2080 Small changes for wind are projected in a context where fossil fuel prices are expected to have a higher influence than climate variables.
[8] Germany Wind (among
others)
AR5 RCP 2.6
and 8.5 1981–2010 2015-2050
For RCP 2.6, small changes and no clear trend in production are to be expected. For RCP 8.5 in southern Germany a decrease of 2% is projected. For the northern parts and some stations in central and southern Germany, an increase of up to 3% is expected.
[90] Northwest Germany Wind (among
others)
SRES A1B 1981-2010 2036-2065 and 2071-2100
Wind speeds decrease in summer and increase in winter. The mean interannual standard deviation from the monthly averages is 12.9% for 2036-2065 and 12.3% for 2071-2100.
[62] UK Wind AR5 RCP 2.6, 6 and 8.5 1981-2000
2011-2030, 2041-2060 and 2071-2090
The North Atlantic area and North Scotland have the greatest increase in wind speed, whilst South England and the English Channel have the greatest decrease. But the model does not represent the current historical distribution of the resource in the UK.
[88] UK Wind SRES A1B,
A2 and B1. 1961-1990 2081-2100
The seasonal pattern in UK wind is expected to strengthen, with increases in wind speed in winter and decreases in summer. But the overall changes in mean annual productions are likely to be small.
[110] Two wind farms in
Scotland (UK) Wind SRES A1B. 1971-1990 2040
Wind speed increases in one wind farm and decreases in another. However, projected changes in extractable wind power are small (<+/-3%). Important changes in wind direction are projected.
[69] Iberian Peninsula (Spain and Portugal) Wind
(offshore) AR5 RCP 4.5 and 8.5 1971-2000 2071-2100 Most models predict a reduction of wind speed and wind power for all seasons, except summer. Yearly reductions (smaller than 5%) are to be expected in all areas except the northwest coast.
[91]
Iberian Peninsula (Spain and Portugal)
Wind SRES A1B 1961-200 2041-2070 A decrease in wind energy power is projected throughout most of the Iberian Peninsula with the remarkable exception of the Gibraltar Strait. Regarding seasonality, a decrease is projected in winter for most areas.
[92]
Iberian Peninsula (Spain and Portugal)
Wind SRES A1B 1980-1999 2005-2050 A reduction in wind speed (never higher than 5%) is projected for all analysed clusters except for the Gibraltar Strait.
[34] Croatia Wind (along with solar and hydro)
SRES A2 1961-1990 2011-2040 and 2041-2070
A large change in mean wind speed can be expected on the coast and adjacent mainland. For 2070, wind speeds could increase by 50% in the summer.
[89] Ireland Wind SRES A1B, A2 and B1. 1961-2000 2021-2060 No substantial changes in wind speed are projected, but an increase in winter and a decrease in summer is to be expected.
AMERICA
Reference Geographic area Generation source Scenarios Reference period Projection period Projected changes
[95] USA Wind SRES A2 1968-2000 2038-2070 An increase in wind energy density is projected for most areas of the US. The biggest increase is projected for Kansas, Oklahoma and Texas. [96] USA Wind (and solar) SRES A2 1985-2005 2040-2069 Changes in wind speed do not exceed +/- 10% and vary depending on the season and geographical area. [93] USA Wind AR5 RCP 8.5 1979-1999 2079-2099 Changes of small magnitude in mean wind speed and wind direction are projected. An increase is projected in winter in some areas, and a decrease in the summer.
[94] USA Wind SRES A1B 1990-1999 2040-2049 2090-2099 The average wind speed in the continental US is expected to shift more by mid-century than by the end of the century. The biggest increases are expected in the Great Plains, Northern Great Lakes and southwestern states.
[65] USA Wind SRES A2 1979-2000 2041-2062 There is no statistically significant climate change signal. Natural variability exceeds the climate change signal. [67] USA Wind IS92a - IS92d 1948-1978 2025, 2050, 2075, 2100 One model/scenario projects minimal changes in wind speed. Another projects a reduction in mean wind speed of 10-15%.
[63] 3 windfarms in California (USA)
Wind SRES A2 1980-2000 2051-2071 Predicted changes do not exceed +/-2% for the locations. Wind speed is projected to increase in the summer.
[97] Northwest USA Wind SRES A1B and A2. 1964-2000 2050 Wind power resource is projected to decrease by up to 40% in spring and summer. In winter a smaller reduction may be expected.
[100] Brazil Wind (and solar) AR5 RCP 4.5 and 8.5 1961-1990 2021-2050 2070-2099 An increase in wind speed and wind power is projected in most of the country, especially in the northern region. In the Northeast, where most production is currently located, average wind speed is expected to increase by 9.4%.
2070-2100 [98] Brazil Wind SRES A2 and B2 1961-1990 2071-2080 2081-2090 2091-2100
Wind speed is projected to increase in most areas of the country, with an average increase of 20% in the Northeast. The average capacity factor of wind generation is predicted to increase from 17% to 19-21% by the end of the century.
ASIA
Reference Geographic area Generation source Scenarios Reference period Projection period Projected changes
[101] China Wind AR5 RCP 4.5 and 8.5 1971-2005 2066-2100 Spatial distribution of mean wind speeds seems very similar under both RCP2.
[105] Taiwan Strait Wind
ECHAM5 CM2.1 CGCM2.3.2 1981-2000 2011–2040 2041–2070 2071–2100
A reduction is projected of up to 3% wind energy density. The reduction will be constant throughout the 21st century.
[106] 13 stations in Southwest
Iran Wind
SRES A1B
and A2 1987-2009 2046-2065 A decrease in production is predicted in almost all cities, with variations of +/- 10%.
AFRICA
Reference Geographic area Generation source Scenarios Reference period Projection period Projected changes
[66] Southern Africa Wind (alongside with PV) SRES A2 and B1 1979-2009 2045-2055