Discussion Paper no. 1047-94
Interaction Effects of a Child Tax Credit, National Health Insurance, and Assured Child Support
Rebecca Y. Kim
Centre for Applied Family Studies School of Social Work
McGill University Irwin Garfinkel
Institute for Research on Poverty School of Social Work
Columbia University Daniel R. Meyer
Institute for Research on Poverty School of Social Work University of Wisconsin–Madison
December 1994
Part of the funding for this paper came from the U.S. Department of Health and Human
Services/ASPE through the Institute for Research on Poverty. Any opinions are those of the authors and not necessarily those of the sponsoring institutions. The authors thank Robert Haveman, Charles Michalopoulos, Philip Robins, and Barbara Wolfe.
If the government offered a refundable tax credit for children, national health insurance, and an assured child support benefit to all families with children—poor families as well as nonpoor
families—what would happen to poverty, welfare dependency, and other related issues? The authors simulate the effects of each program operating on its own and of all three acting in concert. They find that the impacts of the programs interacting with one another would be much larger than the sum of the impacts produced by each program alone. With the three programs in place, the poverty rate would fall by 43 percent, the AFDC caseload would shrink by 22 percent, and the annual incomes of poor families would rise by $2500. In addition, AFDC recipients would work more hours. Data come from the 1987 Survey of Income and Program Participation.
and Assured Child Support
For three decades, the public income transfer system for families with children in the United States has been criticized for being overly targeted on extremely poor families headed by single mothers. Much of the criticism has centered around two features of the system: its categorical nature (focusing benefits to single-parent families) and its reliance on income-tested benefits. Categorical eligibility requirements that limit benefits to single-parent families seem unfair to two-parent families and discourage marriage. Income-tested benefits that are reduced by extremely high rates as earnings increase discourage work. To remedy these shortcomings, government-sponsored studies of the U.S. welfare system in the 1960s advocated lowering the benefit-reduction rate in welfare programs and extending eligibility for welfare benefits to two-parent, working poor families.1 Although the
enactment of the federal food stamp and earned income tax credit (EITC) programs in the mid-1970s reduced overtargeting on extremely poor single-parent families, the system remains highly targeted. Aside from elementary and secondary education, 58 percent of total public transfer benefits to families with children are income tested, and 76 percent of the income-tested benefits go to single-parent families (Garfinkel, forthcoming).2 Academic studies in the 1980s focused more on the shortcomings
of income testing per se, noting that in addition to creating disincentives to work, income-tested programs did nothing to prevent poverty, stigmatized beneficiaries, and undermined social solidarity. Rather than extending welfare, these studies advocated the creation of new universal benefits that were neither income tested nor limited to single-parent families.3
Universal reforms are now being taken seriously in the political process. The National Commission on Children, appointed jointly by President Reagan and the U.S. Congress in 1987, agreed with previous criticisms of overtargeting and advocated a set of more universal reforms, including an increase in EITC benefits, a $1000 refundable income tax credit for children, some form of national health insurance, and a new child support assurance system. (Note that one of these
reforms—child support assurance—is not truly universal in that it is restricted to families with at least one parent living apart from the child.) President Clinton proposed a large expansion of the EITC, universal health care, strengthening of child support enforcement, and demonstrations of an assured child support benefit. The Congress enacted the EITC expansion as part of the 1993 budget bill. While the Congress failed to enact health care reform or even consider child support reform in 1994, both of these will be on the congressional agenda for the next several years. Finally, President Clinton and the Republicans have suggested refundable tax credits for children.
How much would such a major restructuring of the U.S. transfer system cost? How much would it reduce poverty and welfare dependence? Unfortunately, while previous research has examined the costs and benefits of one of the proposed reforms, no one has estimated the effects of the combined reforms. This paper estimates the effects of a reform package consisting of a refundable tax credit for children, universal health care, and a child support assurance system. Of particular interest is whether the effects of the package are equivalent to the additive effects of each reform considered by itself or if the whole is greater than the sum of the parts.
The next section briefly reviews prior research. Section II describes the data and methods. We discuss our results in section III, and offer conclusions in section IV.
I. LITERATURE REVIEW
Several proposals for a children’s allowance, equivalent from an economic point of view to a refundable tax credit for children, were made during the late 1960s (Musgrave et al., 1970; Orshansky, 1968; Schorr, 1966; Vadakin, 1968); and more recently, a few scholars have again proposed a
children’s allowance (Ellwood, 1988; Garfinkel & McLanahan, 1986; National Commission on Children, 1991). Meyer, Phillips, and Maritato (1991) estimated that a children’s allowance of $1000
per child would reduce the poverty rate of poor children by 15 percent and AFDC caseloads by 24 percent, and would increase the mean hours worked by AFDC women by 14 percent.
Although there is a large volume of research on national health insurance (NHI), we currently lack empirical estimates of the impact of NHI on children’s economic status. A few studies provide implications of universal health care coverage for children. Holahan and Zedlewski (1991) examined the effects of Medicaid expansion on children’s health insurance status; they indicated that eight million children whose parents did not have employer-provided insurance would be enrolled at a cost of $5.3 billion (in 1989 dollars) if Medicaid were expanded to 200 percent of the poverty line. Zedlewski et al. (1993) simulated the distributional effects of alternative health care financing of NHI on different income classes, focusing on all nonelderly individuals. The authors concluded that universal coverage would redistribute the burdens of financing health care from the upper to the lower income classes.
A few studies have also provided simulations of a child support assurance system in order to estimate its cost and potential effects (Lerman, 1989; Garfinkel et al., 1990; Meyer, Garfinkel et al., 1991; Meyer & Kim, 1994).
These studies estimated the effects of only a single program on poverty, welfare participation, and work. An interesting research question is the degree to which the estimated effects would be altered if several non-income-tested programs were combined. Depending on the direction and the size of interaction of the combined programs, those effects could be weakened, linearly additive, or
magnified as additional non-income-tested benefits are added. The focus of this study is to examine this potential interaction which results from the combined programs, and identify the direction and the size of that interaction. To separate an interaction effect from the effect of a single program, we simulate each single program separately, and then simulate all three programs together.
This study builds on our prior simulation model to estimate the costs and effects of child support assurance (Meyer, Garfinkel et al., 1991) and the children’s allowance (Meyer, Phillips, & Maritato, 1991). We go beyond our previous work by incorporating changes in the health insurance system, changing from the current system (composed mainly of Medicaid and employer insurance for this population) to national health insurance. In addition we explicitly examine the interaction effects of the three programs.
II. DATA AND METHODS
Data
The data used for this study were drawn from wave 6 of the 1987 panel of the Survey of Income and Program Participation (SIPP), which includes the events of September 1988. Our sample consists of families with children under age 18. There were 4487 families in our sample, including 3321 husband/wife families, 1034 mother-only families, and 132 father-only families.4
There were several advantages of using SIPP for the purpose of our study. First, SIPP was specifically designed to collect detailed information on transfer program recipiency. Questions were asked separately for each transfer program with regard to recipiency and the amount of benefits received per month. These questions allowed us to identify which families participated in the AFDC and food stamp programs and how much those families received in benefits in each month. This monthly information is valuable because eligibility for most welfare programs is determined on a monthly basis. Second, SIPP provides details of health care coverage, including coverage by government programs and private health insurance. The data indicate whether there is medical coverage for each person; whether coverage is Medicaid, Medicare, employer-based insurance or self-purchased private insurance; whether one’s coverage is in one’s own name or someone else’s name; and whether one’s plan covers the family or only the individual. This information allowed us to place
a dollar amount on the value of health care coverage for each member of our sample, based on the number of persons covered and the type of plan. Finally, wave 6 of SIPP contains a topical module on child support, providing such information as whether a child support agreement exists, what amount has been awarded, and what amount has been received. This information was important for simulating the child support assured benefit.
Imputations. Some imputation procedures were used to complete the SIPP data. In addition
to the 1055 custodial-parent families for whom we had child support information, we identified 386 additional families with children potentially eligible for child support for whom the SIPP did not contain child support information.5 For these families, we imputed child support variables, including
the probability of having an award, the collection rate, and child support payments, based on multivariate equations estimated from SIPP.6
Because AFDC recipiency was underreported in our sample by 30 percent, we assigned AFDC recipiency to some female-headed families who did not report it but were income-eligible for AFDC.7 Food stamp recipiency was also assigned to those for whom we assigned AFDC recipiency, but we did not assign food stamp recipiency to any other families. For all AFDC cases and food stamp cases (including both reported and assigned cases), benefit amounts were calculated based on a formula.8
Since SIPP has no tax information, we also calculated income and payroll taxes and the EITC according to the 1988 tax law.9 Finally, we estimated hourly wage rates for nonworkers in the
sample, which were needed to estimate if any of them would begin to work.10
The first two panels of Table 1 display caseload and cost estimates for AFDC and food stamps. The reported values, our imputed values, and values from administrative data are presented. Note that our simulated figures are fairly close to the administrative records. For example,
administrative records indicate a total AFDC caseload of 3.75 million and total benefits of $16.9 billion in fiscal year 1988 (U.S. House of Representatives, 1989). Our simulated totals of AFDC after
Table 1
Sample Characteristics
Families w/ Children under 18
Sample Size 4487
Total Families (millions) 36.91
Poverty Reported Income Definitiona Simulated Income Definitionb
Total People in Poverty (millions) 21.28 14.61
% People in Poverty 16.2% 11.1%
Total Poverty Gap ($ billions) $26.6 $13.1
Income Distribution—% of Families Whose Incomes Are:
Below Poverty Line 16.7% 11.4%
Between 100% and 200% of Poverty Line 21.9% 29.2%
Between 200% and 300% of Poverty Line 20.2% 24.8%
More than 3 Times Poverty Line 41.2% 34.6%
AFDC Reported Simulated Administrative
Recordsc
Total Caseload (millions) 2.65 3.84 3.75
% Families on AFDC 7.2% 10.4% 10.6%
Total Benefits ($ billions) $11.3 $16.1 $16.9
Total Benefits minus
CS Collections ($ billions) $10.7 $14.8 $15.5
Food Stamps
Total Caseloads (millions) 3.79 4.45 4.72
% Families Receiving Food Stamps 10.3% 12.1% 13.3%
Total Benefit Payments ($ billions) $7.8 $8.8 $8.8
Table 1 continued
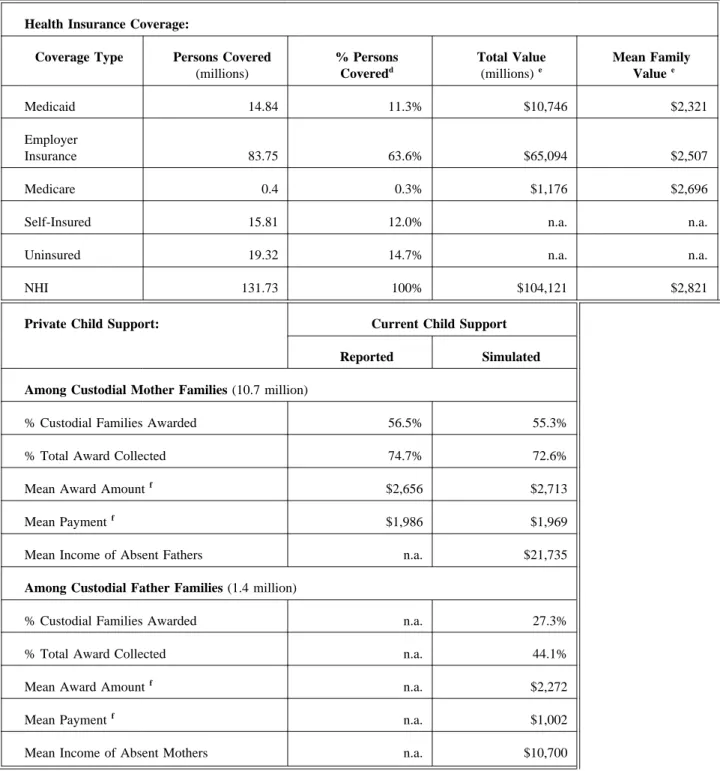
Health Insurance Coverage:
Coverage Type Persons Covered
(millions) % Persons Coveredd Total Value (millions)e Mean Family Valuee Medicaid 14.84 11.3% $10,746 $2,321 Employer Insurance 83.75 63.6% $65,094 $2,507 Medicare 0.4 0.3% $1,176 $2,696
Self-Insured 15.81 12.0% n.a. n.a.
Uninsured 19.32 14.7% n.a. n.a.
NHI 131.73 100% $104,121 $2,821
Private Child Support: Current Child Support Reported Simulated Among Custodial Mother Families (10.7 million)
% Custodial Families Awarded 56.5% 55.3%
% Total Award Collected 74.7% 72.6%
Mean Award Amountf
$2,656 $2,713
Mean Payment f
$1,986 $1,969
Mean Income of Absent Fathers n.a. $21,735
Among Custodial Father Families (1.4 million)
% Custodial Families Awarded n.a. 27.3%
% Total Award Collected n.a. 44.1%
Mean Award Amountf
n.a. $2,272
Mean Payment f
n.a. $1,002
Mean Income of Absent Mothers n.a. $10,700
Notes: a
Reported earnings, child support, AFDC and food stamp benefits, and all other taxable and nontaxable incomes are included.
bSimulated income is defined as the sum of reported earnings and all other taxable and nontaxable incomes, child support payments, calculated AFDC, food stamp, and EITC benefits, and market values of health care benefits, minus calculated income and payroll taxes. Note that this differs from the reported income in four ways: (1) AFDC benefits and food stamp benefits are imputed; (2) earned income tax credits are calculated and included; (3) market values of health care benefits from Medicaid, Medicare, and employer-provided insurance are included; and (4) income and payroll taxes are calculated and subtracted.
cFor administrative records, see U.S. House of Representatives (1989, pp. 555 & 557; 1991, pp. 951 & 1351; 1993, pp. 1620 & 1632). d
The sum of these percentages may not be 100 percent because some families have dual coverage. For valuation, these families are assumed to be covered through the coverage that provides the higher value.
e
These values are obtained using the market-value approach. f
adjustments are equal to 3.84 million for the total caseload and $16.1 billion for total benefit payments.
Imputation and Valuation of Health Insurance Coverage. Since one part of our study
simulated the distribution of health care benefits, we needed to determine how to value these in-kind benefits. To place a value on health care coverage, including Medicaid, employer-provided insurance, and national health insurance, we used the market-value approach in which the value of health care is equal to its market cost of provision.11 We used the mean value per eligible person for insurance
coverage, and took into account age category (child/adult) and family size in calculating a family value of health care coverage.
For Medicaid coverage, mean state expenditures per AFDC child and per AFDC adult were taken from a public source (U.S. House of Representatives, 1990, p. 1302). Since members of our sample who were eligible for Medicaid but who did not receive any medical care derive an insurance value from the coverage, the state mean expenditures were adjusted to reflect a value for all eligible adults and children.12 A family value of Medicaid coverage was then the sum of child values and adult values.13
To place a dollar value on employer-provided insurance, we would have liked to use the amount of the premium paid by the employer. Since information on employer contributions to coverage is not available in SIPP, we used the average premium paid by employers for different types of plans from Gabel et al. (1989): in 1988, employers paid an average of $1016 annually for an individual plan and $2510 for a family plan. If a family reported the family plan through employer coverage, we assumed that the family had a value of $2510; if the individual plan was reported, $1016 was assigned to the family as the value of coverage provided through the employer.14
We also imputed the expected value of employer insurance for current nonworkers. The amount of an employer-paid premium for potential workers depends on the chance of getting
employer-provided coverage and the type of plan selected (family/individual plan). The sample means were used as substitutes for the probabilities of obtaining employer insurance and choosing a family or individual plan.15
To obtain a value for NHI coverage, we first assumed that the value of NHI to each family would be similar to the value of current employer-provided plans. In 1988 the average total premium cost to purchase a family plan of private insurance (combining the shares paid by employers and employees) was $2820 (Gabel et al., 1989). If the proposed NHI has benefit packages and cost-sharing arrangements similar to those in a typical employer-provided plan, the use of the current premium (i.e., $2820) may not be far away from the cost required for NHI to cover a family.16
Measuring Net Income and Poverty. By imputing a cash value to health insurance coverage,
we departed from the conventional method of measuring poverty. In addition, we also counted the EITC and the cash value of food stamps and deducted income and payroll taxes from gross income. Table 1 presents poverty measures based on reported amounts of income (first column) and our simulated estimates (second column), which were derived using calculated rather than reported AFDC and food stamp benefits (we also took into account the EITC, deducted income and payroll taxes, and, most importantly, added the value of health care insurance). Note that our estimated poverty rate and poverty gap as a baseline are substantially lower than the reported estimates. This difference is attributable primarily to the large value of health care.
Methods
This study employed a microsimulation method which incorporated behavioral responses in a static context. The microsimulation served as a model for mapping the current tax and income transfer system and constructing the specific changes of policy proposals at the household level. This method was especially useful to estimate the costs and impacts of the policy proposals.
Features of Proposed Plans. We first needed to specify program parameters under the
post-reform. The post-reform includes an introduction of three new public benefits: a refundable tax credit for children, national health insurance, and an assured child support benefit. For a refundable tax credit for children, we simulated a credit of $1000/year per child under age 18 and treated credits as taxable income. The simulated plan also constrained a family on AFDC to leave the AFDC rolls in order to be entitled to the refundable tax credit. We assumed that the family would choose to
participate in the program that provides the higher level of economic well-being. This plan required a gross cost of $60.2 billion in 1988 dollars. We assumed that this cost would be financed in two ways: eliminating the current tax exemptions for children and increasing income tax rates. An intermediate simulation that took into account new revenues from elimination of exemptions for children, taxation on refundable tax credits, and associated welfare savings showed that this $1000 plan would require a 1.6 percent increase in the income tax rate for financing. This new tax schedule, thus, was
incorporated into the simulation of refundable tax credits for children.
For national health insurance (NHI), we assumed that the current system of Medicaid and employer-provided health insurance would be replaced with a single system, but people covered by Medicare would continue their current coverage under the Medicare program. The NHI plan also assumed coverage of all uninsured people in the sample, including uninsured dependents of Medicare-covered individuals. The benefits offered under NHI would resemble the average benefit package under current employer-provided health insurance. NHI would contain cost-sharing provisions
(including coinsurance and deductibles), similar to current employer insurance. To finance the cost of NHI, a payroll tax schedule was incorporated into the simulation of NHI. We found that a new payroll tax of 7.2 percent and other associated savings17would be sufficient for financing the total NHI cost of $104.1 billion for families with children.
For the assured child support benefit, we simulated a guaranteed level of $2000 annually for the first child entitled to child support. This benefit was increased by $1000 for the second child, $1000 for the third, $500 for the fourth, and $500 for the fifth child. The public cost of the assured benefit was then defined as the assured level minus private child support received under the post-reform. To calculate this, we needed to determine a child support amount for each custodial family under the post-reform. For post-reform private child support, we employed current child support payments, assuming that there would be no improvement in child support.18 Our simulation of the
assured benefit had the following additional features: the public cost of the assured benefit was subjected to the federal income tax; assured benefits were restricted only to custodial parents with awards; and a family on AFDC had to leave the AFDC rolls in order to be entitled to the assured benefit.
Simulation Model. Analyzing the effects of policy changes requires a model which predicts
behavioral responses to the changes proposed under the reform. To predict welfare participation and labor supply decisions, we used a microsimulation model based on the assumption of utility
maximization. Individuals consider whether to work or to participate in welfare, and how much to work, based on the choice that provides the highest level of utility. To calculate utility for individuals, we used the adjusted utility formulation described in Garfinkel et al. (1990). Labor supply parameters were adopted from the estimates by Johnson and Pencavel (1984). More details on this utility
formulation are included in the appendix.
Our model is built upon our previous simulation model developed at the Institute for Research on Poverty (Garfinkel et al., 1990; Meyer, Garfinkel et al., 1991). The original model used an exact budget line and calculated utility on each segment of the budget line. However, the use of exact budget sets becomes virtually impossible when several programs are involved. For this reason, the original model ignored food stamps, the EITC, and Medicaid. Since the present study considered both
these public transfer programs and private transfers through employer-provided insurance, it did not use an exact budget line, but calculated utility at each of the potential hours points specified.19 This
approach enabled us to incorporate health care transfer programs as well as the full range of income transfer programs.
Our simulation involved several intermediate steps. First, we identified incomes and taxes under the current situation. Current income included earnings, child support, AFDC, the EITC, cash values of food stamps and health care coverage, and other incomes. Also, income and payroll taxes were determined for each family. Net income was calculated by summing all those income sources received and then subtracting the taxes paid. This net income was used to calculate the current utility of the family. Other variables were also used in the current utility calculation, including current hours of work.
The second step was to introduce the three new public benefits—refundable tax credits for children, the assured benefit, and NHI—into the current system and predict behavioral responses to these benefits. To make the prediction, we calculated utility at each hours point based on earnings, welfare program participation, and other factors. All points were compared in terms of their utility levels, and the point of highest utility was finally selected. The selected point under the post-reform defined each family’s labor supply and welfare participation.
In the final step of the simulation, the predictions for each family of income, taxes, hours worked, welfare participation and benefit amounts, and public costs of new benefits were aggregated to generate the effects of the reform.
III. RESULTS
To measure the interaction effect of the three non-income-tested programs, we first simulated each program separately, and then the three programs together. (Note that the same program
parameters were used in each simulation.) In our results, we present the estimated effects under each single program alone, the sum of each program’s effects, and the estimated effects under the three combined programs. To examine the direction and magnitude of the interaction effect of the three programs, our discussion includes a comparison of the combined effect with the sum of each program’s effects.
For outcomes that involved discontinuities, such as being an AFDC or food stamp recipient or falling below a poverty line cutoff, using the sum of each program’s effects as a basis for comparison raised a double-counting problem. Suppose that an AFDC family is predicted to leave welfare under the assured benefit, the refundable tax credit, and NHI. This family would be counted as an off-AFDC case in all single programs, which means that the sum of the percentage reductions in off-AFDC caseloads would count this family three times. On the other hand, this family would be counted once in calculating the percentage reduction in AFDC caseloads under the combined programs. To correct this double-counting problem in sums, we identified the double-counted cases between different simulation runs and separated them in the calculation of sums. These adjusted sums were compared with the combined effects in all outcome measures. Interaction effects were then defined as the combined effects minus the adjusted sums.
Table 2 presents the estimated effects on poverty, AFDC, food stamps, labor supply, and income redistribution. Looking first at the effects on poverty of single programs, the number of individuals in poverty is predicted to decrease by 16.5 percent under the refundable tax credit, 19.4 percent under NHI, and 3 percent under the assured benefit. These predicted percentages sum to 38.9 percent, but this sum is adjusted to 34.6 percent when double-counted cases are taken into account. When the three programs are combined, however, we predict a larger percentage reduction in
poverty—43.4 percent. This antipoverty effect under the combined programs is 8.8 percentage points greater than the adjusted sum of each program’s effects (last column). A similar pattern is
Table 2
Effects on Poverty, Welfare Participation, and Labor Supply Effects of Single Programs Adjusted
Sums Effects of Combined Programs Interac-tion Effectsd Ref. Tax Credit ($1000)a NHIb Assured Benefit ($2000)c Effects on Poverty
% Change in Poverty Rate -16.5% -19.4% -3.0% -34.6% -43.4% -8.8%
% Change in Poverty Gap -25.8% -32.2% -3.0% -50.4% -55.5% -5.1%
Effects on AFDC
% Change in AFDC Cases -1.5% -1.5% -0.8% -1.9% -22.3% -20.4%
% Change in AFDC Payments -0.4% -0.1% -0.2% -0.2% -12.5% -12.3%
Effects on Food Stamps
% Change in Food Stamp Cases -2.9% -1.3% -0.7% -3.2% -6.0% -2.8%
% Change in Food Stamp Payments -8.6% -0.6% -1.7% -10.1% -16.7% -6.6%
Effects on Labor Supply
Women Originally on AFDC Change in Mean Hours (% Change) 5 (2.3%) -5 (-2.2%) 2 (0.9%) 2 (1.0%) 31 (13.4%) 29 (12.4%) % Nonworkers Who Begin to Work 0.4% 0.7% 0.1% 0.8% 10.5% 9.7% Women not on AFDC Change in Mean Hours (% Change) -38 (-3.4%) -25 (-2.2%) -7 (-0.7%) -70 (-6.3%) -51 (-4.6%) 19 (1.7%) All Mene Change in Mean Hours (% Change) -26 (-1.3%) -24 (-1.2%) -2 (-0.1%) -52 (-2.6%) -56 (-2.8%) -4 (-0.2%)
Redistributional Effects: Differences in Mean Net Income under Post-Reform
Pre-Reform Mean Net Income
Below Poverty Line $7,756 $901 $1,237 $115 $2,253 $2,422 $169
Between 100% & 200% of
Poverty Line $16,455 $552 $605 $139 $1,296 $1,461 $165
Between 200% & 300% of
Poverty Line $27,800 $156 $31 $86 $273 $204 $-69
More Than 3 Times
Poverty Line $48,331 $-528 $-1,679 $28 $-2,179 $-2,116 $63
Notes:
a
The $1000 refundable tax credit for children is cost-neutral after eliminating tax exemptions for children and increasing the income tax rate by 1.6 percent.
b
For NHI financing, the payroll tax rate is increased by 7.2 percent with no exemptions for the poor.
cThis run assumes no improvement in the child support system. d
This column is calculated with combined effects minus adjusted sums.
found in the effect on the poverty gap. Estimated percentage reductions in the poverty gap under single programs total 50.4 percent after the adjustment.20 On the other hand, the percentage
reduction in the poverty gap under the combined programs is estimated at 55.5 percent, 5.1 percentage points greater than the adjusted sum.
The second panel shows the estimated effects on AFDC recipiency and benefit payments. Our estimates indicate that each program alone would have a very small effect on AFDC caseloads: a 1.5 percent decrease with the refundable tax credit, a 1.5 percent decrease with NHI, and a 0.8 percent decrease with the assured benefit. The estimated effect on AFDC benefit payments of each program alone is almost negligible, less than a 1 percent decrease.21 Adjusting for double counting, these
estimated effects of single programs sum to a mere 2 percent decrease in AFDC caseloads and a 0.2 percent decrease in AFDC payments. Under the combined programs, however, a decrease of more than 22 percent in AFDC caseloads and a decrease of about 13 percent in AFDC payments are estimated. That is, the combined programs achieve more than a 20-percentage-point greater decrease in AFDC caseloads and more than a 12-percentage-point greater decrease in AFDC payments than the counterpart sum of each program’s effects. These results indicate that the impact on AFDC under the combined programs becomes substantially strengthened due to the interaction of the three programs.
In panel 3, our results also indicate upward interactions for the estimated effects on food stamp recipiency and benefit payments, but smaller than for AFDC. For example, the combined regime shows a 6 percent decrease in families receiving food stamps, while single programs result in a total decrease of 3.2 percent after adjusting for double counting. The smaller interaction effect is probably attributable to the fact that eligibility for food stamps extends much higher in the income distribution than eligibility for AFDC.
The estimated effects on labor supply are presented in the fourth panel of Table 2. These estimates indicate that it is the interaction effect of the programs on the labor supply responses of
women on AFDC that underlies the interaction effects on AFDC caseloads and payments. Looking at changes in the mean hours worked by AFDC women, the refundable tax credit and the assured benefit lead to annual increases of five hours and two hours, respectively, while NHI leads to a decrease of five hours. (Note that NHI could discourage the work effort of some working AFDC recipients because of the 7.2 percent increase in payroll taxes for financing.) These predicted changes in the mean hours under single programs sum to an increase of two hours. Under the combined programs, an increase of thirty-one hours is estimated in the mean hours worked by AFDC women. In other words, the combined programs yield an increase of twenty-nine hours (more than 12 percentage points greater) over the addition of the single programs’ changes in the mean hours. The upward interaction for the work incentive under the combined programs is particularly strong for nonworking AFDC women. As seen in the table, all single programs have negligible effects on the percentage of
nonworking AFDC women who begin to work; the total is less than 1 percent. On the other hand, the combined programs would entice about 11 percent of nonworking women on AFDC to begin to work. This percentage is more than ten times as large as the sum of the single programs’ effects.
For individuals not receiving AFDC, all programs are predicted to have negative effects on the mean hours worked, because any increase in unearned income would decrease the number of hours they work.22 This disincentive for those not on AFDC to work under the reform is larger (in
percentage terms) for women than for men, as expected. For women not on AFDC, the mean hours are estimated to decrease by fifty-one hours under the combined regime, while the mean hours decreased under single programs total seventy hours; the combined effect is nineteen hours less than the sum of the single effects. In other words, the decrease in hours worked by women not on AFDC weakens when three programs are combined, suggesting a counteracting interaction of the combined programs on the negative effects on labor supply responses of non-AFDC women. For men, the
combined programs results in a slightly greater negative effect on their hours worked than the sum of each program’s effects, but the difference is very small.
The final panel in table 2 presents estimates for the changes in mean incomes for four different income classes. Under single programs, the poor and the near-poor increase their income levels (more with NHI and the refundable tax credit than the assured benefit). NHI brings the most benefit to low-income families, because many of these families are uninsured under the current system. It should be noted that financing schedules for NHI and the refundable tax credit are incorporated; increased mean incomes mean that on average the new benefit received outweighs the increase in taxes. In the top income class, however, increased taxes are more than the benefit received under NHI and the refundable tax credit. When the three programs are combined, the poor and near-poor substantially increase their mean incomes (by $2422 for the poor and $1461 for the near-poor), while the top income class decreases its mean income by $2116. Comparing these figures with the sums, all income classes except those between two and three times poverty show small upward interactions of the combined programs.
The estimated costs and savings are presented in Table 3. The total gross cost is estimated at $5.7 billion for the assured benefit, $60.2 billion for the refundable tax credit, and $104.1 billion for NHI under the single program reform. All reform programs, however, generate some savings from welfare programs, including AFDC, food stamps, and Medicaid: total welfare savings are $0.2 billion under the assured benefit, $0.9 billion under the tax credit, and $10.8 billion under NHI.23
Estimated changes in the EITC indicate an increase in EITC costs under the assured benefit and the refundable tax credit, because some nonworking AFDC women begin to work, and some working AFDC women increase their hours and earn more. On the other hand, EITC costs are
predicted to decrease under NHI. Recall that under NHI employers are assumed to increase wage rates to compensate for savings from their current premium costs. Because of increased earnings for
Table 3
Costs and Savings under Reform
Under Single Programs Under Combined Programs
Ref. Tax Assured Ref. Tax Assured
Credit Benefit Adjusted Credit Benefit Interaction
($1000) NHI ($2000) Sums ($1000) NHI ($2000) Total Effectsa
Total Gross Cost 60,216 104,121 5,687 170,024 61,543 104,121 6,967 172,631 2,607
AFDC Savings 60 17 35 25 2,003 1,978
Food Stamps Savings 761 50 154 891 1,473 582
Medicaid Savings 45 10,746 14 10,746 10,746 0
EITC Savings -271 392 -50 71 186 115
Income Tax Revenue 59,621 11,566 421 71,608 74,052 2,444
Payroll Tax Revenue n.a. 81,350 n.a. 81,350 80,497 -853
Net Cost 0 0 5,113 5,113 3,674 -1,439
Notes: Figures are in millions of dollars.
a
families who are covered through employer insurance, some families would raise their incomes above the threshold of EITC eligibility. These savings in EITC outweigh the increased costs for some AFDC families who increase work and earn more.
Estimated income taxes under the assured benefit have two counteracting components: taxes decrease due to a decline in labor supply as a whole; and taxes increase from taxation on public benefits. The estimated savings of $0.4 billion indicate that the latter component outweighs the former one. Under the refundable tax credit, income tax revenue substantially increases, estimated at $59.6 billion. This total revenue includes eliminating exemptions for children ($20.1 billion), increasing income tax rates by 1.6 percent ($27.8 billion), and taxing the credits ($11.7 billion). The estimated income tax revenue under NHI ($11.6 billion) results from eliminating current tax exemptions for employer-paid premiums. We also increase payroll taxes (an increase of 7.2 percent) to finance the cost of NHI, which is estimated at $81 billion.
When the three programs are combined, the total gross costs of the assured benefit and the refundable tax credit increase to $7 billion (up from $5.7 billion) and $61.5 billion (up from $60 billion), respectively, because more AFDC families are able to move off welfare and participate in the reform program. Thus, the total gross cost under the combined programs is $2.6 billion greater than the addition of gross costs estimated under single programs. The combined regime also shows a large difference, particularly in welfare savings, resulting in $2.6 billion greater savings (including AFDC, food stamps, and Medicaid). In addition, the combined programs would generate greater income tax revenue ($2.4 billion more) than the sum of revenues under single programs. This greater revenue occurs for a few reasons—the larger tax collection on the assured benefit and the refundable tax credit, the greater increase in the mean hours worked by AFDC women, and the smaller decrease in hours worked by non-AFDC women under the combined programs, compared to the sums of single programs.
Finally, the net cost of the three combined programs is estimated at $3.7 billion, which is $1.4 billion lower than the sum of net costs under single programs, although the total gross cost of
combined programs is $2.6 billion greater than the sum of each program’s gross cost. This gain in the program cost under the combined regime comes mainly from the greater welfare savings and income tax revenue due to the interactions of the combined programs.
IV. CONCLUSION
This paper examined the interaction effects of three non-income-tested programs: an assured child support benefit ($2000 for the first eligible child), a $1000 refundable tax credit for children (per child under age 18), and national health insurance. Our results suggest that the impact of the programs interacting with one another would be much larger than the sum of the impacts produced by each program alone. In particular, we find that these three programs, when they are implemented together, become much more effective in inducing AFDC families to work and move off welfare. As one program is implemented along with another, the impact they have on the work effort of AFDC recipients and on the welfare caseload does not increase incrementally but substantially—the whole is greater than the sum of its parts. The effects on food stamps, poverty, and income redistribution also become strengthened under the combined programs. Finally, we find that the hours worked by women not on AFDC would not decrease proportionately as the package of income transfers increases.
The upward interaction, particularly for the AFDC group, has an important policy implication. This interaction implies that any single program reform alone is not enough to bring AFDC recipients out of welfare dependency. Only a combined benefit package would enable many AFDC recipients to combine earnings with other public benefits and free them from relying solely on AFDC benefits.
APPENDIX
The Labor Supply Response Model
The static microeconomic theory of labor supply assumes that individuals choose the number of hours they will work and whether they will receive welfare benefits based on the alternative that provides the highest utility.
The form of the utility function that we used to determine the response to a new public program is the augmented Stone-Geary direct utility function used by Garfinkel et al. (1990) and Meyer, Garfinkel et al. (1991) and is given as follows:
(1)
for single-mother families; and
(2)
for married-couple families; where
In these equations:
Hn = annual hours of work (1 for husband, 2 for wife; when not subscripted this refers to
single women);
βn = marginal propensity to consume leisure;
δ = subsistence consumption;
αn= total time available for work;
m and R = indexes that normalize C and H in accordance with the size and composition of the household;
εn= an error term representing tastes for work; and
Wn= the hourly net wage.
Maximization of the utility formulation subject to a budget constraint yields an optimal number of hours:
H =α(1-β)R - β(n -δm)/w +ε for single-mother families, and
H1= α1(1-β1)R1 - β1(n -δm + w2*α2*R2)/w1+ ε1
H2= α2(1-β2)R2 - β2(n -δm + w1*α1*R1)/w2+ ε2
for married-couple families, where n = net unearned income (and thus C = n + w1H1 + w2H2).
Because directly estimating the parameters of this utility function was beyond the scope of our study, we drew on results from the existing labor supply literature. For our estimates of the labor supply effects, we used the results obtained by Johnson and Pencavel (1984) in their analysis of the labor supply response to the Seattle and Denver Income Maintenance Experiments (SIME-DIME). In particular, for single women we assumed β= .128,δ = -2,776,α = 2,151, m = 1-.401*ln(1+K) (K being the number of children in the family under age 18), and R = 1-.071P (P being 1 if there are preschool-age children in the family, 0 otherwise). For married couples we assumed β1= .2113, β2=
.1238, δ= 1,616, α1 = 2,587,α2= 2,012, m = 1+1.069*ln(1+K), R1= 1, and R2 = 1-.051P.
Because the optimal hours of work predicted by the equation did not match the observed hours of work for individual families, the epsilon terms (which can be thought of as representing "tastes" for work) were defined as the difference between optimal hours and observed hours. The epsilon terms were then incorporated into the utility function as shown in equations 1 and 2, and this
forced the observed hours to be optimal hours for more than 97 percent of the individuals in our sample.
Individuals not working presented two particular complications: first, we had no wage for them, and so we had to estimate wages (the estimating equations are available upon request). Second, individuals not working were typically not on the margin of going to work, and so a random epsilon term was drawn from a standard normal distribution. Additional details on this procedure can be found in Garfinkel et al. (1990).
The labor supply model involves the following steps:
1) The amount of each family’s unearned income is determined.
2) Net wages are determined for workers and estimated for those who are not working. 3) A version of the optimal hour equation (without the epsilons) is used to determine the epsilon terms.
4) Net income under the reform regime, but at the current number of hours of work, is calculated. Utility is then calculated.
5) Net income under the regime of new program(s) is calculated at several possible hours points. Utility at each point is calculated, with the family selecting the number of hours of work that provides the highest utility. The number of hours selected implicitly determines whether the family receives AFDC or food stamps.
6) These individual predictions are multiplied by the sample weights and then totalled to calculate the predicted aggregate effects.
Notes
1Three early studies were especially critical of the U.S. welfare system: U.S. Advisory Council on
Public Welfare (1966), President’s Commission on Income Maintenance Programs (1969), and U.S. Congress (1972–74).
2
The figures in the text do not count as public transfer benefits either private health insurance or tax benefits received by families with children through the homeowner’s deduction and the child and adult exemptions in the federal income tax. The bulk of these benefits accrue to families in the top two-fifths of the income distribution (Garfinkel, forthcoming).
3See, for example, Garfinkel (1982); Garfinkel and McLanahan (1986); Wilson (1987); and
Ellwood (1988).
4Forty-two families contained grandchildren rather than children who were the offspring of the
head.
5The child support module in SIPP does not provide information on currently married mothers who
had children out of wedlock or mothers who had no children from the most recent divorce but had children from an earlier divorce, unless they reported receiving child support payments. In addition, no information is given about custodial fathers. We identified these missing custodial families through an examination of wave 2, which provides information on household relationships. This resulted in a much higher estimate of the total number of custodial parents (12.1 million, including both mothers and fathers of children under age 18) than given by the CPS-CSS (9.4 million, including only mothers of children under age 21).
6See Kim (1993) for these estimated equations.
7Also see Jabine (1990) for the underreporting problem in SIPP. Those who were income-eligible
for an AFDC payment of at least $1000 were considered to be recipients. This $1000 threshold ensured against overestimating the total caseload.
8AFDC amounts were calculated based on the state maximum benefit (by family size) and a tax
rate (estimated by Fraker et al., 1985). Food stamp benefits were also calculated according to the 1988 food stamp formula.
9Because data on itemization were not available, we assumed that all families took the standard
deduction.
10
See Kim (1993) for estimated wage equations.
11We prefer not to use the term "government cost," because private health insurance was included
for our valuation as well. However, it should be noted that some economists, for example Smeeding and Moon (1980), have used "market value" and "government cost" for medical benefits
interchangeably.
12To obtain a value of coverage for an eligible adult/child, we needed the total number of eligible
adults (or children) in each state. However, public statistics do not provide this information, but report a percentage of eligible adults/children who receive Medicaid services in each state (provided by the Division of Medicaid Statistics at the Department of Health Care Financing and Administration). Using this alternative information, the state mean value for an eligible adult/child was calculated with the mean state expenditure multiplied by the state percentage of eligible persons who received medical services.
13In the sample, a few individuals reported Medicare coverage. Medicare coverage was valued in
the following way: According to the Green Book (1991), the average annual benefit per person enrolled in 1988 was $1626 for Part A (Hospital Insurance) and $1070 for Part B (Supplementary Medical Insurance, which is optional) (p.130–131). Since more than 98 percent of persons covered by Medicare have optional SMI coverage as well (see Green Book, 1991, pp.130–131), the HI mean benefit and the SMI mean benefit per enrollee were added together to capture a value of Medicare coverage, which amounted to $2696.
14We also adjusted for variations in values due to different family sizes and age categories of
family members. To account for this variation, we first calculated the mean value per eligible adult and the mean value per eligible child, as follows: We first assigned $2510 and $1016 (depending on the plan type) to each family identified with employer insurance. We then aggregated these values and counted the total number of adults and children covered through employers in our sample. This resulted in $65 billion for the total premium (employer-paid), 43.2 million total adults and 40.7 million total children. We also utilized the ratio of per adult health expenditures to per child expenditures from Waldo et al. (1989), which is 2.1:1. If these are put together:
(a) AVe= 2.1*CVe
(b) AVe*43.2 + CVe*40.7 = 65000 (unit in millions)
where AVeand CVeare per adult value and per child value of employer insurance coverage,
respectively. The solution of these equations resulted in $971 per eligible adult and $471 per eligible child as the value of employer-provided coverage. A family value was then the sum of eligible adult and child values in the family.
15The expected value of the employer-paid premium can be stated as follows:
E(PREM)= Pcov * (Pfp*Cfp+ Pip*Cip)
where E(PREM) is the predicted amount of employer-paid premium; Pcov is the probability of getting
employer-provided insurance coverage; Pfp and Pip are the probability of having the family plan and the
individual plan, respectively; and Cfpand Cipare the employer’s premium cost for the family plan and
the individual plan, respectively. For Pcov, we calculated the percentages of those who have employer
insurance by gender groups among employed workers in the sample. For Pfp and Pip, sample
percentages of those who have the family plan (or individual plan) by primary/secondary earner groups were obtained from employed workers with employer coverage. Since these mean percentages were upward-biased for the nonworking group, we adjusted these values by weighting the demographic
characteristics of nonworkers. Adjusted values were then substituted for the corresponding variable in the equation. The mean premiums (i.e., $2510 and $1016) were also plugged into Cfp and Cip,
respectively.
16
An assignment of a flat amount ($2820) to each family as the family value of NHI would ignore family size and age categories of family members. Therefore, NHI values per eligible adult and per eligible child were obtained according to the same procedure as in the valuation of employer
insurance. The total adults and total children covered under NHI were counted at 63.3 million and 68 million, respectively; the family values of NHI ($2820 each family) were aggregated at $104 billion. Plugging these figures into the equations in endnote 14 resulted in $1078 per adult and $524 per child as NHI values. These adult/child values were then assigned to each family member and summed to produce the family value of NHI. These adjusted family values did not change either the aggregate total value ($104 billion) or the family mean value ($2820), but allowed different values depending on family size and the age category of family members.
Since we assumed that current employer-provided insurance would be replaced with NHI, the NHI simulation needed to determine how to treat current premium costs paid by employers. In the long run, most economists predict that employers would shift the savings directly to workers by adjusting wages by the change in health benefit costs, holding workers’ total compensation constant (Zedlewski et al., 1993). On this ground, the hourly compensation of current employer-paid premiums was computed and added to the current gross wage. This increased wage was used as the post-reform wage rate under the NHI simulation.
17A major source of savings under NHI is the current cost of Medicaid. In addition, NHI is
expected to bring additional income tax revenues because currently tax-exempted employer contributions would be brought into taxable incomes.
18In this study, we used the most conservative assumption. Since the child support assurance
system involves incentive provisions for custodial parents to obtain awards, some improvements in child support are expected to occur. For empirical evidence based on an experimental study, see Hamilton et al. (1993).
19Our model allowed a different set of hours for men and women. For men, we allowed the
current hours, and every 5 hours/week between 0 and 30 and between 50 and 60, but every hour between 30 and 50/week. For women, we allowed the current hours, and every hour/week for 5 hours below and above the number of hours that each woman currently works, and every 5 hours elsewhere.
20Some families with incomes slightly below the poverty threshold presented a partial
double-counting problem in calculating the sum of decreased poverty gaps. Suppose that a family has a preincome level of $11,000 and that the poverty line is $12,000. Also, suppose that the refundable credit alone increases the family’s income to $12,000; the single program of NHI increases the income to $14,000; and the assured benefit alone increases the income to $13,000. Under these three single programs, the sum of reductions in the poverty gap is $3,000 ($1,000 under each program). Under the combined programs, the family’s income would increase to the much higher income level of $17,000, but the amount of the poverty gap reduced would remain the same as that of a single program ($1000). In other words, $2000 is double counted in calculating the sum in this particular example. This double-counted amount was also corrected in the adjusted sum of percentage reductions in the poverty gap.
21
Our estimates for the effects on AFDC are lower than existing estimates for two reasons. First, this study incorporated values of health care benefits in predictions of AFDC participation and work. When AFDC families consider Medicaid coverage, they are more likely to choose to stay on welfare. Second, we constrained AFDC families to participate in either AFDC or the new program(s). Because
of this constraint, AFDC families would choose welfare unless new benefits combined with increased earnings provide a higher income level than AFDC.
22Also, increased tax rates for financing could contribute to the decrease in the hours worked. 23Medicaid savings are generated from AFDC families who leave welfare under the assured benefit
and the refundable tax credit, assuming that these families lose Medicaid coverage. Since Medicaid is replaced with NHI, a large part of the estimated welfare savings under NHI comes from the Medicaid program.
References
Ellwood, D. T. 1988. Poor Support: Poverty in the American Family. New York: Basic Books. Fraker, T., Moffitt, R., & Wolf, D. 1985. "Effective Tax Rates in the AFDC Program." Journal of
Human Resources, 20(2): 251–263.
Gabel, G. et al. 1989. "Employer-Sponsored Health Insurance in America." Health Affairs, Summer: 116–128.
Garfinkel, I. Forthcoming. "Economic Security for Children." In I. Garfinkel, J. Hochschild, & S. McLanahan (eds.). Social Policy for Children. Washington, D.C.: The Brookings Institution. Garfinkel, I. 1982 (ed.). Income-Tested Transfer Programs: The Case for and Against. New York:
Academic Press.
Garfinkel, I., & McLanahan, S. S. 1986. Single Mothers and Their Children: A New American Dilemma. Washington, D.C.: The Urban Institute Press.
Garfinkel, I., Robins, P. K., Wong, P., & Meyer, D. R. 1990. "The Wisconsin Child Support Assurance System: Estimated Effects on Poverty, Labor Supply, Caseloads, and Costs." Journal of Human Resources, 25(1): 1–31.
Hamilton, W. L., Burstein, N. R., Hargreaves, M., Moss, D. A., & Walker, M. 1993. The New York State Child Assistance Program: Program Impacts, Costs, and Benefits. Cambridge, Mass.: Abt Associates, Inc.
Holahan, J. & Zedlewski, S. 1991. "Expanding Medicaid to Cover Uninsured Americans." Health Affairs, Spring: 45–61.
Jabine, T. B. 1990. The Survey of Income and Program Participation Quality Profile. Washington, D.C.: U.S. Department of Commerce.
Johnson, T. R., & Pencavel, J. H. 1984. "Dynamic Hours of Work Functions for Husbands, Wives, and Single Females." Econometrica, 52: 363–389.
Kim, Y. 1993. "The Economic Effects of the Combined Non-Income-Tested Transfers for Families with Children: Child Support Assurance, Children’s Allowance, and National Health Insurance." Ph.D. dissertation, University of Wisconsin–Madison.
Lerman, R. I. 1989. "Child-Support Policies." In P. H. Cottingham, & D. T. Ellwood (eds.). Welfare Policy for the 1990s. Cambridge, Mass.: Harvard University Press.
Meyer, D. R., Garfinkel, I., Robins, P. K., & Oellerich, D. 1991. "The Costs and Effects of a National Child Support Assurance System." Institute for Research on Poverty, Discussion Paper no. 940-91, University of Wisconsin–Madison.
Meyer, D. R., Phillips, E., & Maritato, N. L. 1991. "The Effects of Replacing Income Tax Deductions for Children with Children’s Allowances." Journal of Family Issues, 12(4): 467–491.
Meyer, D. R., & Kim, R. Y. 1994. "Incorporating Labor Supply Responses into the Estimated Effects of an Assured Child Support Benefit." Institute for Research on Poverty, Discussion Paper no. 1033-94, University of Wisconsin–Madison.
Musgrave, R. A., Heller, P., and Peterson, G. E. 1970. "Cost Effectiveness of Alternative Income Maintenance Schemes." National Tax Journal, 23(5): 140–156.
National Commission on Children 1991. Beyond Rhetoric: A New American Agenda for Children and Families. Washington, D.C.: National Commission on Children.
Orshansky, M. 1968. "Who Was Poor in 1966?" In E. M. Burns (ed.). Children’s Allowances and the Economic Welfare of Children. New York: Citizen’s Committee for Children of New York, Inc.
President’s Commission on Income Maintenance Programs. 1969. Poverty Amid Plenty: The American Paradox. Washington, D.C.: U.S. Government Printing Office.
Smeeding, T. 1982. "Alternative Methods for Valuing Selected In-Kind Transfer Benefits and Measuring Their Effect on Poverty." U.S. Bureau of the Census, Technical Paper #50. Smeeding, T., & Moon, M. 1980. "Valuing Government Expenditures: The Case of Medical
Transfers and Poverty." Review of Income and Wealth, 26: 305–324.
U.S. Advisory Council on Public Welfare. 1966. Having the Power, We Have the Duty. Washington, D.C.: U.S. Government Printing Office.
U.S. Congress: Joint Economic Committee & Subcommittee on Fiscal Policy. 1972–74. Studies in Public Welfare. Washington, D.C.: U.S. Government Printing Office.
U.S. House of Representatives, Committee on Ways and Means. 1993, 1991, 1990, 1989. Green Book: Background Material and Data on Programs within the Jurisdiction of the Committee on Ways and Means. Washington, D.C.: U.S. Government Printing Office.
Vadakin, J. C. 1968. Children, Poverty, and Family Allowances. New York: Basic Books. Waldo, D., Sonnefeld, S., McKusick, D., & Arnett, R. 1989. "Health Expenditures by Age Group,
1977 and 1987." Health Care Financing Review, 10(4): 111–120.
Wilson, W. J. 1987. The Truly Disadvantaged: The Inner City, the Underclass, and Public Policy. Chicago: The University of Chicago Press.
Zedlewski, S., Holahan, J., Blumberg, L., & Winterbottom, C. 1993. "The Distributional Effects of Alternative Heath Care Financial Options." In J. A. Meyer & S. S. Carroll (eds.). Building Blocks for Change: How Health Care Affects Our Future. Washington, D.C.: The Economic and Social Research Institute.