KENYA U G A N D A R W A N D A BURUNDI ZAMBIA MSUMBIJI 12345 12345 12345 12345 12345 12345 12345 12345 12345 123456 123456 123456 123456 123456 123 123 123 123 123 123 TA NG A 12 12 12 12 12 12 12 12 12 12 12 1 1 12 12 12 12 1 1 123 123 123 12 12 THE UNITED REPUBLIC OF TANZANIA
TANGA REGION
SOCIO-ECONOMIC PROFILE
Joint Publication by: THE PLANNING COMMISSION
DAR ES SALAAM and
REGIONAL COMMISSIONER'S OFFICE TANGA
TABLE OF CONTENTS
Page
FOREWORD...v
SECTION I... 1
1.0 LAND, POPULATION AND CLIMATE... 1
1.1 LOCATION...1
1.2 AREA AND ADMINISTRATIVE UNITS...1
1.3 ETHNIC COMPOSITION...3
POPULATION SIZE AND GROWTH...5
POPULATION DENSITY AND DISTRIBUTION...10
EMPLOYMENT...19
CLIMATE...22
1.8 SOILS...23
1.9 VEGETATION...24
1.10 AGRO - ECONOMIC ZONES...25
TOPOGRAPHY AND DRAINAGE SYSTEM...27
Topography...27
1.7 DRAINAGE SYSTEM...29
SECTION II ...30
THE REGIONAL ECONOMY...30
GDP AND PER CAPITA GDP...34
FOOD CROPS...38 CASH CROPS...47 FARM IMPLEMENTS ...55 IRRIGATION ...56 LIVESTOCK SECTOR...60 LIVESTOCK INFRASTRUCTURE...66
4.2.5 NATURAL RESOURCES AND TOURISM...66
I) FORESTS...66
WILDLIFE...71 FISHERIES ...72 (V) MINERALS DEPOSITS...75 INDUSTRIES ...77 SECTION III...82 ECONOMIC INFRASTRUCTURES ...82 ROAD NETWORK...82 RAILWAYS ...91 AIR SERVICE...93 ENERGY...93 ELECTRICITY...93 FIREWOOD/CHARCOAL...94 HARBOURS...94 SECTION IV...97 2.0 SOCIAL SERVICES ...97 2.1.0 EDUCATION...97 2.1.1 PRIMARY EDUCATION...97 DROP-OUT PROBLEM...103 SECONDARY EDUCATION...116 HEALTH SECTOR...131 HOSPITAL...131 DISPENSARIES:...132 HEALTH CENTERS...134 DISEASES ...135 LIFE EXPECTANCY...141
INFANT AND UNDER FIVE MORTALITY RATES...143
MARTENAL MORTALITY...144
WATER SERVICES ...147
SECTION V...160
DEVELOPMENT POTENTIALS AND PROSPECTS ...160
AGRICULTURE:...160
Food Crops: ...160
Cash Crops: ...163
c) Other Natural Resources: ...165
ii) Fisheries ...165
iii) Forestry ...166
d) Industrial A ctivities (Agro -Industries) ...167
e) Tourism: ...168 f) Mining:...169 g) Education:...169 h) Health: ...170 i) Water:...170 ANNEX...171
1.0 GENERAL INFORMATION ABOUT TANZANIA ...171
AREA OF MAINLAND...171
TANZANIA MAINLAND AREA BY REGIONS (SQ KM)...171
POPULATION...172
TOTAL POPULATION AND LIFE EXPECTANCY FOR TANZANIA - BY REGIONS, 1967, 1978, 1988, 1996:...172
LAND USE...173
ARABLE LAND: ...173
LAKES...173
MOUNTAIN SUMMITS (METRES ABOVE SEA LEVEL) ...173
CLIMATE...174
1.2 SOCIAL SERVICES ...176
HEALTH FACILITIES...176
EDUCATION: ENROLMENT RATES 1990 COMPARED WITH OTHER EAST AFRICA
COUNTRIES...176
FOREWORD
1. As we approach the 21st Century the problems facing rural areas in developing countries like Tanzania are numerous and formidable. Social and Economic services are deteriorating and proving to be unsustainable; school enrollment rates are declining; food situation is precarious; infant and maternal mortality rates continue to be high; unemployment is on the rise triggering off mass migration of youth from the rural areas into already overcrowded urban centres; in Tanga Region, for example, land pressure is escalating and deforestation is going on at an alarming rate.
2. This situation has arisen because of many factors including ill - prepared rural development programmes and weak monitoring and supervision of the implementation of development programmes and sectoral strategies. The observed shortcomings in the policy formulation, project identification, design, and implementation in the developing countries is in turn attributed to lack of reliable and adequate data and information on the rural development process.
3. The publication of Regional Socio-economic Profiles series by the Planning Commission in collaboration with Regional Commissioner's offices should be viewed as a fruitful attempt towards finding solutions to the existing problem of data and information gap.
4. The Regional Profile series cover a wide range of data and information on geography, population, social economic parameters, social services, economic infrastructure and
productive sectors. The publications so far have proved to be of high demand and a vital source of information to many policy makers, planners, researchers, donors and functional managers. The Planning Commission has found it a worthwhile effort to extend the exercise to cover even more regions. Readers are invited to make suggestions and constructive criticisms which can assist in improving the quality and effectiveness of future Profiles.
5. I would like to take this opportunity to acknowledge with thanks once again the financial support of the Royal Norwegian Embassy which facilitated the preparation of the Tanga Region Socio-Economic Profile. I would also like to thank both the Planning Commission and Tanga Regional Planning Staff who put a lot of effort into ensuring the successful completion of this task.
Nassoro Malocho (MP)
MINISTER OF STATE PLANNING
SECTION I
1.0 LAND, POPULATION AND CLIMATE 1.1 Location
Tanga region is situated at the extreme north-east corner of Tanzania between 4o and 60 degrees below the Equator and 370-39010'degrees. east of the Greenwich meridian. The region occupies an area of 27,348 sq kms, being only 3% of total area of the country. Tanga shares borders with Kenya to the north, Morogoro and Coast regions to the south, Kilimanjaro and coast regions to the south, and Kilimanjaro and Arusha regions to the west. To the east it is boded by the Indian ocean. Mligaji River also forms a large part of the border in the South.
1.2 AREA AND ADMINISTRATIVE UNITS
Administratively, the region is divided into 6 districts namely, Lushoto, Korogwe, Muheza, Handeni, Pangani and Tanga Municipality. The region has as well 37 divisions, 136 Wards and 557 villages. The Regional Administrative Secretary is the Chief Executive in the region assisted by District Executive Directors at district levels and other functional officers, while
the Regional Commissioner is the administrative overseer and represents the President in the region.
The region has a land area of 27,348 Sq. Kms. of which 48 percent belongs to Handeni district and 5 percent belongs to Pangani district, 13 percent to Lushoto, 14 percent to Korogwe and 18 percent of the land area to Muheza. The total area available for agricultural activities is 17,000 sq. kms. With a population of 1,280,262 people, Tanga region is among the smallest and most densely populated regions of Tanzania (about 48.1 people per sq. kms.), after Mtwara, Kilimanjaro and Mwanza regions.
Fig. 1: Administrative Area of Land in Tanga Region by District in Sq. Km
Tanga Municipal 2% Muheza 18% Korogwe 13.7% Lushoto 12.8% Handeni 48.3% Pangani 5.2%
Table I: LAND AREA AND ADMINISTRATIVE UNITS OF TANGA REGION District or Municipality Area Sq.Km
Divisions Wards Villages
Tanga Municipal 536 4 21 23 Muheza 4,922 6 27 140 Korogwe 3,756 4 20 132 Lushoto 3,500 8 32 137 Handeni 13,209 13 23 102 Pangani 1,425 4 13 23 27,348 37 136 557
Source: Regional Commissioner's Office - Tanga.
1.3 ETHNIC COMPOSITION
In terms of ethnic composition, Lushoto and Handeni have the most homogenous population while Muheza, Korogwe, Tanga and Pangani feature a very heterogenous tribal composition where no single ethnic group accounts for more than 20% of the total district population.
The main ethnic groups in terms of their numbers are Sambaa, Zigua, Bondei and Digo. Sambaa are the main ethnic group in the Usambara Mountains and low lands of Muheza, in Korogwe and Lushoto they account for nearly 40% of the region’s total population. The Zigua are the main ethnic group in Handeni district and partially Korogwe and Pangani districts, while Bondei are mainly in Muheza district and part of Pangani. Digo are the main ethnic group in Tanga district and part of Muheza district. Both Bondei and Digo depend on livestock keeping and fishing along the coast. There are other small ethnic groups such as Segeju, Duruma, Mbugu and Pare. Asians and Europeans mostly occupying the urban centres in the region, account for a very small population. The 1978 census showed the composition of ethnic groups by district as follows:
Handeni District - Zigua 66.1%, Nguu 17.9%,
Others 16.0%.
Korogwe District - Sambaa 42.8%, Zigua 18.1%,
Others 39.1%.
Lushoto District - Sambaa 78.3%, Pare 14.0%,
Others 7.7%.
Muheza District - Bondei 16.5%, Sambaa
15.8%, Digo 13.8, Zigua 6.8%, Segeju 6.1%, Makonde 5.6%, Others 35.4%
Pangani District - Zigua 22.5%, Makonde 14.0%, Yao 6.5%, Others 57.0%.
Tanga District - Digo 18.0%, Sambaa 13.9%,
Bondei 10.7%, Zigua 7.6%, Segeju 7.5%, Others 42.3%.
POPULATION SIZE AND GROWTH
The population of Tanga region has been increasing since 1957 and more than doubled in 1988. In 1957 its population was 579,382 people and in 1988 it rose to 1,283,592 people. Population of Tanga in 1988 was about 6 percent of the total Tanzania mainland's population and makes Tanga region the Seventh populous region after Mwanza, Shinyanga, Mbeya, Dar-es-Salaam, Kagera and Arusha. The population of Tanga is projected at 1,644,849 people in the year 2000 and this will increase population density by 28 percent from 48.1 persons per Sq. Kms. in 1988 to 60 persons per Sq. Kms. Higher population densities may sometimes be associated with widespread poverty and other serious social problems, let alone unsustainable use of natural resources.
Fig. II: Population Size by District, Tanga Region (1957 - 1988)
Thousands
Lushoto Korogwe Muheza Tanga Urban Pangani Handeni 0 100 200 300 400 1957 1967 1978 1988
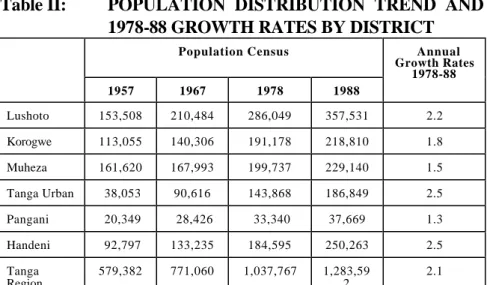
Table II: POPULATION DISTRIBUTION TREND AND 1978-88 GROWTH RATES BY DISTRICT
Population Census Annual Growth Rates 1978-88 1957 1967 1978 1988 Lushoto 153,508 210,484 286,049 357,531 2.2 Korogwe 113,055 140,306 191,178 218,810 1.8 Muheza 161,620 167,993 199,737 229,140 1.5 Tanga Urban 38,053 90,616 143,868 186,849 2.5 Pangani 20,349 28,426 33,340 37,669 1.3 Handeni 92,797 133,235 184,595 250,263 2.5 Tanga Region 579,382 771,060 1,037,767 1,283,59 2 2.1
Sources: 1. Population Census 1957, 1967 and 1978; Tanga Water Master Plan, Vol. V
2. Tanga Regional Statistical Abstract 1993.
Fig. III: Population Size Based on Population Census 1967 and 1988
Thousands
Lushoto Korogwe Muheza Tanga Ur Pangani Handeni 0 100 200 300 400 1957 Census 1988 Census
TABLE III: POPULATION PROJECTIONS BASED ON 1978-88 AVERAGE GROWTH RATES
District 1967 Census 1988 Census Population Projections 1995 1998 2000 Lushoto 210,484 357,531 416,040 444,107 463,863 Korogw e 140,306 218,810 246,310 259,852 269,290 Muheza 167,993 229,140 256,811 268,542 276,659 Tanga 90,616 186,849 222,825 239,958 252,106 Pangani 28,426 37,669 41,450 43,088 44,215 Handeni 133,235 250,263 299,376 322,395 338,716
Total 771,060 1,280,262 1,482,812 1,577,942 1,644,849
Source: 1. Population Census, 1967, 1988 and Projections by the Planning Commission.
Table II highlights 1957, 1967, 1978 and 1988 population sizes as well as population growth rates by District. It is observed from Table II that between 1957 and 1988 Census, the population of Tanga more than doubled and shall almost triple by the year 2000. Higher population growth rates do become problems when the rate of food production does not cope with the rapid increase. The District with the highest population growth rates are Handeni and Lushoto, while Pangani commands the lowest population growth rate followed by Muheza. High population growth rates in Handeni and Lushoto if there are no controls will increase their respective populations in the year 2000 to 338,716 and 463,863 people. While, their population densities will increase by 4 and 3 percent. For Lushoto district, an increase in population density is very serious because already there are too many people in a Sq. Km., which may not lead to sustainable use of the available resources.
TABLE IV: POPULATION BY DISTRICT, RURAL/URBAN AND SEX IN TANGA REGION
District Rural Urban
Male Female Total Male Female Total
Lushoto 158,772 185,518 344,290 5,931 7,271 13,202 Korogwe 85,722 89,617 175,339 21,023 22,487 43,510 Muheza 107,754 108,596 216,350 5,998 6,791 12,789 Handeni 115,041 121,677 236,718 6,494 7,032 13,526 Tanga 24,580 24,900 49,480 69,229 68,109 137,338 Pangani 16,178 16,138 32,316 2,616 2,738 5,354 Total 508,047 546,446 1,054,493 111,291 114,428 225,719 Source: Tanga Regional Statistical Abstract, 1993.
Fig. IV:Population Size by District Rural/Urban and Sex
Lushoto Korogwe Muheza Handeni Tanga Ur Pangani 0 40 80 120 160 200 Male Rural Female Rural Male Urban Female Urban
The population Census of 1988 clearly revealed that the majority of the people of Tanga region, estimated at 82 percent of the total population lived in the rural areas. For instance, in Lushoto, Muheza and Handeni Districts 96%, 94% and 94% of the total population respectively lived in the rural areas. These figures may not reflect the true picture taking place due to recent influx of youth population into the urban centres. Thus, the population is expected to be much high in the Urban centres.
Population Density and Distribution
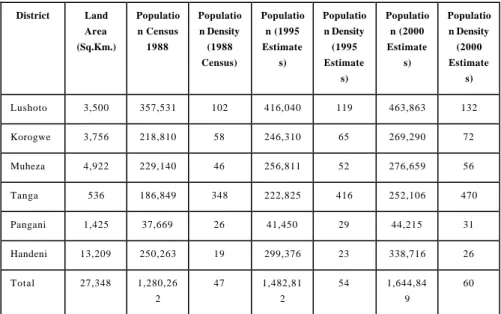
Population density of Tanga region as revealed by 1988 population census, was one of the highest in the country. With regards to 1988 census, (Table V), the region's average population density was 48.1 persons per Square Kilometer, being well above the national average of 26 persons per Sq. Km. Nevertheless, the most striking observation is on Table VI below. That is, Lushoto district with land area of 3,500
Sq. Km. commanded the highest population density estimated at 102 persons per sq. km. while Handeni with land area of 13,500 sq. km. had a population density of only 19 persons per sq. km. It is important therefore for people in Lushoto to start thinking of how best to utilize the small piece of land at their disposal and may be consider the possibilities of controlling population growth rate. Population density problem may also face the districts of Korogwe and Muheza. 1988 population Census revealed high population densities in Korogwe and Muheza as well.
TABLE V: POPULATION DISTRIBUTION AND DENSITY BY REGION, 1988 CENSUS REPORT
Region Land Area (Kms) Population Density
Dar-es -Salaam 1,393 1,360,850 976.9 Mwanza 19,683 1,876,776 95.8 Kilimanjaro 13,309 1,108,699 83.7 Mtwara 16,710 887,583 53.2 Tanga 26,677 1,280,262 48.1 Kagera 28,456 1,313,639 46.6 Mara 21,760 952,616 43.7 Shinyanga 50,760 1,763,960 34.9 Dodoma 41,311 1,235,277 30.0 Mbeya 60,350 1,476,261 24.0 Kigoma 37,040 853,263 23.1 Iringa 56,850 1,193,074 21.3 Arusha 82,098 1,352,225 16.5 Rukwa 68,635 704,050 10.1 Lindi 66,040 642,364 9.8 Tabora 76,151 1,036,293 14.0 Pwani 32,407 638,015 20.0 Singida 49,341 791,814 16.0 Morogoro 70,799 1,222,737 17.0 Ruvuma 66,477 783,327 12.0 Total 885,987 23,174,443 26.1
TABLE VI: POPULATION DENSITY AND DISTRIBUTION BY DISTRICT District Land Area (Sq.Km.) Populatio n Census 1988 Populatio n Density (1988 Census) Populatio n (1995 Estimate s) Populatio n Density (1995 Estimate s) Populatio n (2000 Estimate s) Populatio n Density (2000 Estimate s) Lushoto 3,500 357,531 102 416,040 119 463,863 132 Korogwe 3,756 218,810 58 246,310 65 269,290 72 Muheza 4,922 229,140 46 256,811 52 276,659 56 Tanga 536 186,849 348 222,825 416 252,106 470 Pangani 1,425 37,669 26 41,450 29 44,215 31 Handeni 13,209 250,263 19 299,376 23 338,716 26 Total 27,348 1,280,26 2 47 1,482,81 2 54 1,644,84 9 60
Lushoto Korogwe Handeni Muheza Tanga Ur Pangani 0 40 80 120 160 200 Male Female
TABLE VII: POPULATION BY SEX, NUMBER OF HOUSEHOLDS AND AVERAGE HOUSEHOLD SIZE, 1988
District
S e x No. of
Households
Average Household Size Male Female Total
Lushoto 164,130 193,401 357,531 65,045 5.5 Korogwe 108,314 110,496 218,810 43,275 5.1 Handeni 122,854 127,409 250,263 41,136 6.1 Muheza 115,231 113,909 229,140 44,327 5.2 Tanga 96,237 90,612 186,849 40,767 4.6 Pangani 19,071 18,598 37,669 8,977 4.2 Total 625,837 654,425 1,280,262 243,527 5.3
It is observed from Table VII that the highest household size in Tanga Region was recorded in Handeni and Lushoto districts during 1988 Population Census. Handeni district had an average household size of 6.1 and Lushoto district had 5.5, both of which were above the Regional average household size of 5.3. Handeni and Lushoto districts are more into the Rural area than the remaining four sister districts, and naturally the more you are into the rural areas the more tendency to embrace firmly the family ties and values. This may probably explain why average household sizes are bigger in Handeni and Lushoto.
TABLE VIII POPULATION BY AGE GROUPS AND DISTRICTS IN TANGA REGION, 1988 Age Groups D i s t r i c t Total Lushoto Korogwe Muheza Handeni Tanga Pangani
0-4 62,637 34,202 34,900 48,172 25,809 5,737 211,457 5-9 62,793 33,114 34,010 43,439 24,782 5,366 203,504 10-14 51,839 30,406 30,292 31,168 22,889 4,601 171,195 15-19 41,687 24,070 24,438 28,359 24,219 3,901 146,674 20-24 25,453 16,133 16,411 17,463 17,387 2,783 95,630 25-29 24,902 16,099 16,594 18,586 16,644 2,770 95,595 30-34 16,810 11,649 12,157 12,761 11,471 2,062 66,910 35-39 15,197 10,695 10,785 10,937 9,776 2,023 59,413 40-44 10,444 7,606 7,936 7,837 6,546 1,391 41,760 45-49 9,500 7,597 8,071 6,430 6,157 1,407 39,162 50-54 9,065 6,452 7,473 6,105 5,445 1,328 35,868 55-59 5,963 4,870 5,782 4,477 4,057 917 26,066 60-64 6,025 4,636 6,301 4,411 3,803 1,105 26,281 65-69 4,064 3,348 4,187 3,084 2,433 659 17,775 70-74 4,541 3,347 4,331 2,826 2,367 681 18,093 75-79 1,872 1,753 1,949 1,505 1,080 283 8,442 80+ 3,993 2,465 3,280 2,442 1,444 576 14,200 N.S* 707 407 242 242 509 80 2,187 Total 357,492 218,849 229,139 250,244 186,818 37,670 1,280,212
Source: Tanga Regional Statistical Abstract, 1993. * N.S: Not stated.
Fig. IX: Percentage Distribution of Defendent Population by District and Age Group, 1988 Population Census
Lushoto Korogwe Muheza Tanga Pangani Handeni
0 10 20 30 40 50
Age Group 0 - 14 Age Group 65+
TABLE IX: PERCENTAGE DISTRIBUTION OF DEPENDENT POPULATION BY DISTRICT IN TANGA REGION, 1988 POPULATION CENSUS
District Dependent Population (%) Age Group (0-14)(%) Age Group (65+)(%) Total (0-14 + 65+) (%) Lushoto 49.6 4.2 53.8 Korogwe 44.7 5.1 49.8 Muheza 43.0 6.1 49.1 Tanga 39.4 2.3 41.7 Pangani 41.7 6.1 47.8 Handeni 49.1 4.0 53.1 Total 44.0 4.6 49.2
Tables VIII and IX indicate the population in each age-group and percentage distribution of dependent population in each district. Children aged between 0 - 14 years constitute 44 percent of the total population. While, youth aged between 15 and 39 years constitute 36 percent of the total population. The working group age (15 - 64 years) is 49.3 percent. Whereas, the dependent group 0-14 and above 65 years old constitute 49.2 percent of the total population. This implies that dependence ratio is almost 50 percent in Tanga Region. It also means that 628,960 persons (of 0-14 and above 65 years) were being fed and looked after by only 654,632 people in Tanga Region in 1988. For such a big number of people depending and surviving entirely on the sweat of just a few colleagues does not make much economic sense. It becomes more serious especially when the number of the dependent group is more or almost equal the number of the supporting group. The supporting group must work much harder in order to feed the young and the old, otherwise food shortages may begin to surface.
Employment
Like in other regions, the majority of the economically active population in Tanga Region is engaged in subsistence agriculture. While, a small portion of the population especially those close to the shores of the Indian Ocean is absorbed in the fishing industry. However, the declining productivity of the agricultural resources, resulting from; pest infestation, less reliable rainfall, increasing land infertility and in some
areas land shortages do cause unemployment problem in Tanga Region. Table X below attempts to show the magnitude of unemployment in Tanga Region as revealed by the 1988 Population Census analytical results.
TABLE X: POPULATION 10 YEARS AND ABOVE BY SEX, DISTRICT
AND OCCUPATION, IN TANGA REGION, 1988
District O c c u p a t i o n Total Office Work and Shop Sales Agricultur al Work Industrial and Other Number not Employe d Sex: Male Lushoto 3907 58314 3278 36404 101903 Korogwe 4068 44373 4838 19456 72735 Muheza 3463 47013 5603 22411 78490 Handeni 2602 51855 1916 18903 75276 Tanga 15025 13270 17426 22683 68404 Pangani 835 8147 1106 3030 13118
District Sex: Female
Lushoto 1880 81330 511 45801 129522
Korogwe 1900 105342 1019 22862 131123
Handeni 1261 60383 456 20676 82776
Tanga 7815 14040 5463 40070 67388
Pangani 565 8131 475 4233 13404
District Both Sexes
Lushoto 5553 139644 3789 82205 231191 Korogwe 5968 97044 5857 42318 151187 Muheza 5734 98451 7016 48441 159642 Handeni 3857 112238 2372 39579 158046 Tanga 22840 27310 22889 62753 135792 Pangani 1400 16278 1581 7263 26522
Source: 1. Tanga Regional Profile, 1988
2. Planning Commission, Compiled Data Based on Regional Profile.
The 1988 Population Census (Table X) results put unemployment in Tanga Region at 282559 people, which was equivalent to 33 percent of the total labour force. Out of 282559 unemployed, 159672 were female population representing 57 percent of the total. It is also observed from Table X that unemployment was more pronounced in Lushoto and Tanga districts with 82205 and 62753 people respectively.
Climate
The dominant climate in Tanga Region is warm and wet. It is found along the coast and in the inland. In the Western plateau of Handeni district a hot and dry climate dominates and in the Usambara Mountains a temperate climate. In most cases, there is no big variation of temperature at the coast due to the influence of the Indian Ocean. However, during the hot months (December to March) the average temperature in Tanga is approximately 30o - 32oC during the day and about 26o - 29oC during the night. While, during the cool months (May to October) temperatures are approximately 23o - 28oC in the day and 20oC - 24oC in the night.
Another characteristic of the coastal climate is the high atmospheric humidity, which often goes up to 100% maximum and 65 to 70 percent minimum.
In Tanga region most areas get rainfall of at least 750 mm. per year. The amount of rainfall is about 1,100 to 1,400 mm. along the coast, decreasing inland but with the exception of the Usambara Mountains, where, depending upon slope position and height, the amount of rainfall may exceed 2000 mm. per year. In the Maasai Plains (North West of Handeni) and in the dry plains of Korogwe, the average rainfall is below 600 mm. In a nutshell one would say that the annual pattern of mean monthly rainfall is bi-mode with maximum monthly occurring in April and May throughout the region. Some areas in the West Usambaras
(e.g. south-facing slopes) tend to have their maximum rainfalls during November/December. Mean annual rainfall ranges from 600 - 800 mm (most parts of Handeni district, northern Lushoto and Muheza district) and 1,200 - 1,400 mm (coastal belt, Western and Eastern Usambaras), during peak periods, amount exceeding 2,000 mm/p.a. may occur in the Usambara Mountains.
1.8 Soils
Four major types of soils are closely related to the physiography and can be identified in Tanga region as follows:-
(i) Well drained, deep to moderately deep, red and yellowish red clays, sandy clays, loams and clays, mainly on Usagaran rock within the mountainous areas;
(ii) Well to medium drained, shallow, moderately deep to deep red and brown sandy loams, loamy sands and clays in the upland areas;
(iii) Well to moderately well drained, light colored sands and yellowish brown to yellowish red loams and clays in the coastal areas;
(iv) Poorly to imperfectly drained, grey to black clays and sands (partly saline) in the alluvial plains as well as minor valleys and depressions.
1.9 Vegetation
The outstanding feature of the vegetation is its complexity. The coastal area is dominated by bushland, palm gardens, village cultivations and estates (mainly sisal). The upland plateaus are covered with bushland and shrub thickets interrupted by swampy low-lands and river swamps as well as village cultivations, estates and palm gardens.
The prevailing vegetation in the Umba Plains and the Maasai Steppe is open savannah grassland with scattered trees and scrub thickets.
Mainly the mountain areas (West and East Usambara, Nguu Mountains) still feature considerable areas under primary forest ( approx. 5% of total regional surface); however, as a result of the high population density in these areas the forests are endangered and land and wood have become scarce. In the less populated bushland areas, thicket development as secondary vegetation prevails.
1.10 Agro - Economic Zones
The region can be Subdivided into four main zones namely coastal belt, wet plains, dry plains and mountain belt. The major characteristics of each zone are as indicated
below.Zone
Average Rainfall Main Activity Dominant Crops
Coastal belt: (0-15m above sea level) Covers Pangani district, Tanga and part of Muheza district
800-1400mm. Agriculture and Fisheries, Sea Weeds (Mwani)
Citrus fruits, Sisal, Coconuts, Cashewnuts, Maize, Cassava, Rice and Sea Weeds.
Wet Plains (300-600m. above sea level)
Covers mostly Muheza and Korogwe districts
800-1000mm. Agriculture and Horticulture Sisal, Coconuts, Cashewnuts, Cotton, Maize, rice, beans, Cassava and Citrus fruits Dry Plains (200-600m. above sea level Handeni, part of Korogwe, Muheza and Pangani.
500-800mm Beekeeping Agriculture and Livestock (beef cattle)
Timber, Honey, Sisal, Cotton, Tobacco, Maize, Cassava and beans. Mountain belt (1000 - 2000m above sea level
Covers areas in Lushoto, (Usambara mts) Muheza (Amani mts) and Handeni (Nguu mts) districts.
800-2000mm. Agriculture, Horticulture and Livestock (Small holder dairy cattle)
Tea, Coffee, Cardamon, maize, potatoes, bananas, beans, vegetables and temperature fruits.
Source: Regional Commissioners Office (1993). Regional Development Report (1961 - 1992).
Topography and Drainage System
Topography
Tanga Region is characterized by a very heterogenous topography:
- The coastal plain extends inland in a varying width of between 20 km and 30 km. In the west it is bordered by a small escarpment rising up to 200 m.
- The northern part of the region features the Umba plains which extend far into Kenya. It gently slopes from north to south towards the Umba River, which originates from the northern part of the West Usambara Mountains and drains the entire plain. The average altitude of the plain is about 500 meters.
- The Southern part of the Umba Plains and the
Usambara Mountains form, a massive mountain range rising in the south-west to an altitude of more than 2,000 m. The Lwengera River which is a tributary of the Pangani River divides within its north-south valley of the Usambaras into a eastern and western part. The East Usambaras rise to about 1,000 m to form a central
plateau. Several large rivers divide the West Usambaras into topographic sub-areas.
- The valley of the Pangani River extends South of the Usambaras in a north-west/south-east direction.
- The central Handeni Area bordered in the north by the Masai Steppe is an undulating bush savannah with average elevations between 400 m and 600 m.
- The Masai Steppe reaching far into Tanga Region in its north-western part, is a gently undulating plain, with scattered elevations between 700 m in the north-east and 1,200 m in the south-west. The area is relatively dry (average annual precipitation approx. 600 mm) and drained by some minor seasonal rivers which flow into the Pangani river.
- The Nguu mountains almost in the extreme West of Tanga Region are a narrow mountain range which rises up to nearly 2,000 m and borders the Central Handeni Area and continues into Morogoro Region.
1.7 Drainage System
Tanga Region is part of the largest Indian Ocean drainage basin and it drains mainly through the Pangani River and its tributaries (e.g. Mkomazi, Soni River and Lwengera). The extreme northern parts of the region are drained by the Umba river, whereas drainage in the coastal belt is made possible by a number of short coastal rivers e.g. Sigi river, most of them with seasonal discharge only.
SECTION II
THE REGIONAL ECONOMY
The economy of Tanga Region like in many other regions depends on subsistence agriculture, livestock keeping and fishing. Food production to a large extent is undertaken by small holders, while cash crop production is carried out by both small holders and large scale farmers (public and private institutions). The leading and prominent food crops in terms of area coverage are maize, cassava, banana, pulses, mainly beans and rice. Important cash crops include sisal, cotton, coffee, tea, cardamon, coconuts, tobacco and cashewnuts. Livestock reared are cattle, goats and sheep. Modern dairy farming and poultry keeping is not very common in the rural areas, although few do it.
Production of food crops increased over the years from an estimated 340,000 tones in 1970 to 495,866 tons in 1995/96 season. An increase in food production nevertheless, did not keep pace with the growth in population of the region. The population of the people increased from 771,060 in 1967 to 1,482,812 people in 1995. Going by Malthusian docrine, the theory developed by Thomas Robert Malthus that the world's population tends to increase faster than its means of subsistence. That is, population tends to grow at a geometric rate, while the food supply grows only in arithmetic progression. According to the theory therefore, food situation in Tanga tended to
follow almost Malthusian docrine. That is, food production increased by only 46 percent from 340,500 tones in 1970 to 495866 tones in 1995/96, while population increased by 92 percent between 1970 and 1995/96. The example may not exactly conform to the Malthusian theory but the point here is that usually food production capacities are not as efficient as the human reproductive capacities. That is, population increases much faster than food production. Apart from agriculture and livestock keeping, fishing, mining and industrial activities do also play an important role in the economy of the region.
The economy of Tanga region may not appear very strong to-day but in early sixtees especially days of the sisal boom it was amazingly strong as shown in table XI. The table shows the position Tanga region held in terms of per capita GDP between 1963 and 1973 and some of the years that followed.
TABLE XI: PER CAPITA GROSS DOMESTIC PRODUCT Region Per Capita GDP in Shs. 1963 1967 1969 1973 1986 1988 1990 1992 1994 Arusha 546 534 735 762 7265 17497 41131 59928 91024 Coast 263 427 596 617 2124 4914 9860 14756 22624 D'Salaam 3417 4152 3824 3838 21115 33939 94123 132323 197107 Dodoma 238 278 408 415 3307 7380 17779 26007 39604 Iringa 292 347 392 519 6789 17010 28144 42028 64502 Kigoma 254 267 425 500 4802 13061 12911 19568 30103 Kilimanjaro 553 660 633 679 3647 4750 24975 36655 55716 Mara 344 343 503 400 5695 26290 20028 28956 43748 Mbeya 184 279 460 544 7517 9874 21174 31685 48737 Morogoro 498 452 579 566 4493 9550 27054 39189 59370 Mwanza 368 406 522 627 6578 16706 21592 31819 48508 Ruvuma 189 262 358 410 5296 22023 21856 33828 52537 Shinyanga 348 422 670 604 4672 6275 23317 34496 52746 Singida n.a. 227 380 439 5195 12809 24750 36484 55644 Tabora 433 384 776 443 3930 15760 19993 29481 44984 Tanga 908 657 727 730 5285 14326 27559 39747 49607 West Lake (Kagera) 341 334 425 504 5183 7636 21103 32307 50105
2. National Accounts of Tanzania 1976 - 1994.
Table XI above provides a basis for an overall comparison of the per capita GDPs of different regions. Dar-es-Salaam however, is a very special case and therefore cannot meaningfully be compared with other regions. The ratio between the lowest and highest per capita income of different regions has fluctuated from 1:4.9 in 1963 to 1:2.9 in 1967 and 1:4.2 in 1990 to 1:4.0 in 1994. The most backward regions in 1960s like Ruvuma, Singida, Coast, Kigoma and Dodoma have shown significant growth in the nintees (1990s), while, the traditionally most advanced areas such as Kilimanjaro, Tanga, Mwanza, Iringa, Mbeya and Arusha increased their per capita GDPs just moderately. However, the most striking thing about the developments in the per capita GDPs is the relative position that Tanga region has been holding within the national context since 1963. The per capita income of the people in Tanga particularly in 1963 was more than double (shs. 908/-) the National average which by then was 435/-. It's per capita income continued to surpass the National average in 1969 and 1973 by 20.4% and 12.3% respectively. This growth in the economy of Tanga especially in 1963 put the region in a very superior position compared with other regions. While, Tanga was the leading region in the early 1960s, it held the 9th position in 1994 behind even the most backward regions in early 1960s such as Singida, Shinyanga, Ruvuma, Iringa and Morogoro. Since, the economy of Tanga region was very much linked to the growth in Sisal Industry, certainly the decline in Sisal industry must have been the cause for poor performance in the economy of Tanga region and hence low per capita incomes in the subsequent years. In addition, a drop in per Capita
GDP of Tanga Region could also be attributed to several industries which were booming up in the region but now closed. The poor performance in the economy in turn caused unemployment and reduced employment opportunities in the region.
GDP AND PER CAPITA GDP
Table XII attempts to compare the GDP and per capita GDP of Tanga Region with the GDPs of few selected Regions whose per capita GDPs showed some relative economic strength in 1960 or early 1970s. According to Table XII, the trend in GDP and the per capita GDP growth of Tanga Region at current prices (disregarding inflation element) over the last 10 years (1985-1994) indicated good performance. The regional GDP at current prices increased in absolute terms from Tshs. 4805 million in 1985 to T.shs.92821 million in 1994. Except for Arusha Region, the GDPs for Tanga Region between 1985-1994 proved to be higher than the GDPs for Kilimanjaro and Morogoro. Of the four selected few regions, Kilimanjaro had the lowest GDP (T.shs. 72,898 million) in 1994 followed by Morogoro (T.shs. 88,073 million). Like the GDPs of Tanga Region, its per capita GDP at current prices also in creased in absolute terms from 4,003/= in 1985 to 60,021/= in 1994. Again like the GDPs, the per capita GDP of Tanga Region in 1994 was still higher than that of Kilimanjaro and Morogoro, meaning that, people in Tanga Region theoretically were still enjoying better standard of living than those in Kilimanjaro and Morogoro, despite its per capita GDP dropping to the 9th position in 1994.
Fig. XII: Regional GDPs for Selected Regions 1985 - 1994 1985 1986 1987 1988 1989 1990 1991 1992 1993 1994 0 30000 60000 90000 120000 150000 Tanga Kilimanjaro Morogoro Arusha
Fig. XIIb: Regional Per Capita GDPs for Selected Regions in Millions at Current Prices 1985 - 1994
1985 1986 1987 1988 1989 1990 1991 1992 1993 1994 0 20000 40000 60000 80000 100000 Tanga Kilimanjaro Morogoro Arusha
TABLE XII: REGIONAL GDPS AND PER CAPITA GDPSs FOR TANGA, MWANZA, MBEYA AND ARUSHA IN MILLION Tshs. (at current Prices)
YEAR TANG A KILIMA NJARO MOROG ORO ARUSHA GDP Per Capita GDP* GDP Per Capita GDP* GDP Per Capita GDP* GDP Per Capita GDP* 1985 4805 4003 2991 2865 4436 3946 6897 5736 1986 6477 5285 3886 3647 5182 4493 9068 7265 1987 10385 8300 2979 2738 6788 5737 13192 10182 1988 18729 14326 5254 4750 11977 9550 23593 17497 1989 29482 21929 8241 7245 18669 14476 37515 27053 1990 38103 27559 29215 24975 35881 27054 58657 41131 1991 47149 33160 36484 30329 44974 32974 74792 50997 1992 58119 39747 45347 36655 54969 39189 90385 59928 1993 71750 47713 56805 44650 67846 47034 11169 1 72009 1994 92821 60021 72898 55716 88073 59370 14519 2 91024
Source: 1. Planning Commission: Compiled Data based on National Accounts of
Tanzania 1976 - 1994 Eleventh Edition August, 1995 *. Per Capita GDP figures are not in millions (simply Tshs.).
TABLE XIII: THE GDP AND PER CAPITA GDP OF TANGA REGION AT
CURRENT PRICES AND PERCENTAGE CHANGE, 1980 -
1994 YEAR GDP at Current Prices in Tshs (Millions)
Per Capital GDP at Current Prices (Tshs and in USA Dollars) %
Chang e % Change Tshs. Exchange Rate Tshs/Dollars U.S.A Dollars 1980 2052 1897 8.22 230.8 1981 2549 24 2308 8.35 276.4 20 1982 3092 21 2742 9.52 288.0 4 1983 3260 5 2831 12.44 227.6 -21 1984 3574 10 3041 18.16 167.4 -26 1985 4805 34 4003 16.50 242.6 45 1986 6477 35 5285 51.70 102.2 -58 1987 10385 60 8300 83.70 99.2 -3 1988 18729 80 14326 125.00 114.6 15 1989 29482 57 21929 192.00 114.2 -0.34 1990 38103 29 27559 197.00 139.9 22 1991 47149 24 33160 234.00 141.7 1.3 1992 58119 23 39747 335.00 118.6 -16 1993 71750 23 47713 480.00 99.4 -16 1994 92821 29 60021 553.00 108.5 9
Source: Planning Commission, Compiled data based on National Accounts of Tanzania, 1976 - 1994.
It is observed from Table XIII that despite the fact that the per capita GDP of Tanga region at current prices increased more than thirty times from 1980 to 1994, the purchasing power of a shilling fell drastically in dollar terms from US $ 230.8 to only US. $ 108 in 1994. This implies that people in Tanga region were about two times poorer in terms of per capita GDP than what they were in 1980. This has been so due to the tendency of T.shilling to continue depreciating against the dollar. Further observation from Table XIII reveals a slow growth in GDP at current prices over the last eight years (1980 - 1988). It was in 1988 when the region began to record relatively a significant growth in GDP. The GDP growth rose by 396 percent from T.shs. 18729 million in 1988 to T.shs. 92821 million in 1994.
FOOD CROPS
Food crops grown in Tanga Region vary with the topography of the area. On the coastal plains, maize, cassava and rice are grown as major crops. In the semi arid plateau, farmers grow mainly maize, cassava, beans, fruits and rice, while in the arid plateau people grow maize, cassava, sorghum and beans. In the highland areas characterized by temperate climate, potatoes, bananas, beans, vegetables and fruits and maize are the most common food crops.
Maize
Maize is grown in large scale in all districts except Pangani district. It is also the most important crop in Handeni and Handeni for that matter is the leading district in maize production in Tanga Region. Maize is also a cash crop for many Handeni farmers. Poor yields in maize production are mainly caused by the tendency of the majority of farmers using local seeds whose yield potential is considerably lower than that of the improved varieties. Other problems may be cited as untimely planting which is usually done too late. This has had very serious effects on yields, as the optimum time of planting would have been well before the beginning of the rains. But in areas with unpredictable rainfall, for which Handeni is an example, it is extremely difficult for farmers to know exactly the right time.
In Table XIV, we observe a fluctuating maize production figures in six consecutive years (1987/88 - 1995/96). The fluctuations in the production figures are a clear proof of the seriousness of the problems farmers face in maize production. Unless, the problems are addressed, production will continue to fall.
Cassava
Cassava is one of the major food crops in the Region, mainly grown for home consumption. The quantities marketed are relatively limited. Cassava is grown throughout the lowlands of the region with Handeni district taking the lead in its production followed by Muheza, Korogwe
and Pangani. In Lushoto district, cassava is not very important crop, may be due to the district's climate and topography. Nevertheless, the potential for cassava production in the region has hardly been attained up to now. Various factors are responsible for the failure to maximize cassava production possibilities like, wild pigs which prefer cassava roots as their food. Production figures, although fluctuating, indicate (Table XIV) considerable potential for a profitable production and certainly justify the need for an expanded cassava production under which the crop would be grown for a large market and hence income for the local people. According to the Table cassava production increased from 155,007 tons in 1990/91 to 164,254 in 1993/94 but dropped again to 150,890 tons in 1995/96.
Bananas
The hectarage covered by bananas, for which parts of the region offer favorable production conditions, make them one of the important agricultural enterprises in the area. Production of bananas is highest in Lushoto and Muheza, followed by Handeni and Korogwe. Bananas are only of minor importance in Pangani district. Bananas are mainly a food crop in many districts except in Lushoto where they are to some extent grown for planned sales on markets outside the district/region. However, production methods are generally poor resulting into low yields. Interplanting with other crops (e.g. coffee) also makes it difficult to give an accurate figure for production volume. According to Table XIV, bananas show great potential and many people could earn a living
through more production and sale of bananas. Thus, potential is there even for commercial production.
Beans
Beans are the main kind of pulses in the region. They are primarily grown for home consumption. In West Handeni, and other parts of the region, farmers produce beans for sale. The main areas for production of beans are Handeni especially the Nguu mountains, Korogwe and Lushoto districts. Beans production figures (Table XIV) like those of maize fluctuated very much between 1977/88 and 1995/96. The highest figure was recorded in 1994/95 season. Production fell by 48 percent from 42,470 tons in 1994/95 to 22,127 tons in 1995/96.
Rice
After maize, rice is the second most important cereal crop in the region. Rice is produced both for home consumption and for sale in the market. The main areas for rice production are Korogwe, Lushoto, Muheza and Pangani. It is mainly rainfed or grown in swampy areas and on a small scale by irrigation methods. Most rice growers use seeds of local varieties locally known as "bora ya kupata" or improved breed (seeds) known as "kahogo". "Kahogo is the variety recommended for Tanga Region.
Although, the production methods show extremely great differences between various farmers and areas, the general feature is that the yields
are not exhausting the production potential of the fields. Due to the great differences in the production conditions and quality of management it becomes difficult to make general statements on the average profitability of rice production. In Table XIV, the yield shot up to 33,863 tons in 1992/93 from 4,334 tons in 1990/91 and dropped drastically to only 8,674 tons in 1993/94. Significant fluctuations in rice production figures are a clear indication of the problems in rice production which could be either caused by too little water, less application of irrigation and drainage techniques or less use of fertilizer inputs.
Sorghum/Millets
Traditionally, sorghum and millets were the major food crops in many parts of the region with relatively lower or less, reliable rainfalls, in particular the central and south-western parts of Handeni and to a lesser extent, in north Lushoto. These are still the main growing areas, but since the introduction and expansion of maize, the importance of sorghum and millets have been considerably reduced. People generally prefer maize which gives white flour compared to the one of reddish colours from sorghum. All in all, it is worthwhile to consider giving sorghum greater preference as a staple food instead of maize in all areas because maize requires good and reliable rainfall that may not be guaranteed in all areas. Sorghum, in addition has an advantage over maize in terms of protein content. It is lower in maize than in sorghum.
Fig. XIV: Production of Food Maize Crop 1987/88 - 1995/96 in Thousand Tonnes 1987/88 1990/91 1992/93 1993/94 1994/95 1995/96 0 30 60 90 120 150 Maize
Fig. XIV: Production of Food Paddy (Rice) Crop 1987/88 - 1995/96 in Thousand Tonnes 1987/88 1990/91 1992/93 1993/94 1994/95 1995/96 0 10 20 30 40 Paddy (Rice)
Fig. XIV: Production of Food Beans Crop 1987/88 - 1995/96 in Thousand Tonnes 1987/88 1990/91 1992/93 1993/94 1994/95 1995/96 0 10 20 30 40 50 Beans
Fig. XIV: Production of Food Sweet Potatoes Crop 1987/88 - 1995/96 in Thousand Tonnes 1987/88 1990/91 1992/93 1993/94 1994/95 1995/96 1 2 3 4 5 6 Sweet Potatoes
Fig. XIV: Production of Food Irish Potatoes Crop 1987/88 - 1995/96 in Thousand Tonnes 1987/88 1990/91 1992/93 1993/94 1994/95 1995/96 0 10 20 30 Irish Potatoes
Fig. XIV: Production of Food Sorghum Crop 1987/88 - 1995/96 in Thousand Tonnes 1987/88 1990/91 1992/93 1993/94 1994/95 1995/96 0 2 4 6 8 Sorghum
Fig. XIV: Production of Food Banana Crop 1987/88 - 1995/96 in Thousand Tonnes 1987/88 1990/91 1992/93 1993/94 1994/95 1995/96 0 30 60 90 120 150 Banana
TABLE XIV: PRODUCTION OF FOOD CROPS 1987/88 - 1995/96 IN TONES CROP 1987/88 1990/91 1992/93 1993/94 1994/95 1995/96 Maize 95,647 126096 107464 128571 147636 146339 Paddy (Rice) 6894 4334 33863 8674 9490 12288 Beans 6707 19679 39542 24554 42470 22127 Sweet Potatoes 2028 3120 4646 4417 5124 4894 Irish Potatoes 9248 23604 27435 26761 30247 25786 Cassava 122924 155007 166176 164254 156790 150890 Sorghum 6634 2406 3178 2987 3896 4866 Banana 61085 113616 124514 115896 135182 128676
Total 311167 447862 506818 476114 530835 495866
Source: Regional Commissioner’s Office, Tanga, (Planning), 1996.
CASH CROPS
Cash crops are grown throughout the region. The most common cashcrops grown in the region are sisal, coconuts, cashewnuts, cardamon, cotton, coffee, tea and fruits. On the coastal plains, sisal, coconuts and cashewnuts thrive well, while in the semi-arid plateau farmers grow sisal, cashewnuts, coconuts and cotton. In the arid plateau people grow sisal, cotton and tobacco. Coffee, tea and cardamon thrive in Highland areas where climate is favourable. Table XV below highlights cash crop production yields between 1987/88 and 1995/96. Production yields are not impressive at all, especially with sisal, coconuts and cardamon. The available data does not seen to reflect the real production figures. Production figures could be much higher than the data available.
Fig. XIV: Production of Cash Crop Cotton 1987/88 - 1995/96 in Thousand Tonnes
1987/88 1990/91 1992/93 1993/94 1994/95 1995/96 0 1 2 3 4 Cotton
Fig. XIV: Production of Cash Crop Tea 1987/88 - 1995/96 in Thousand Tonnes 1987/88 1990/91 1992/93 1993/94 1994/95 1995/96 0 1 2 3 4 5 Tea
Fig. XIV: Production of Cash Crop Coffee 1987/88 - 1995/96 in Thousand Tonnes
1987/88 1990/91 1992/93 1993/94 1994/95 1995/96 0 1 2 3 4 Coffee
Fig. XIV: Production of Cash Crop Cashewnuts 1987/88 - 1995/96 in Thousand Tonnes 1987/88 1990/91 1992/93 1993/94 1994/95 1995/96 0 2 4 6 Cashewnuts
Fig. XIV: Production of Cash Crop Tobacco 1987/88 - 1995/96 in Thousand Tonnes
1987/88 1990/91 1992/93 1993/94 1994/95 1995/96 0 2 4 6 8 Tobacco
Fig. XIV: Production of Cash Crop Cardamon 1987/88 - 1995/96 in Thousand Tonnes 1987/88 1990/91 1992/93 1993/94 1994/95 1995/96 .5 1 1.5 2 2.5 3 Cardamon
Fig. XIV: Production of Cash Crop Sisal 1987/88 - 1995/96 in Thousand Tonnes 1987/88 1990/91 1992/93 1993/94 1994/95 1995/96 0 10 20 30 40 Sisal
Fig. XIV: Production of Cash Crop Coconuts 1987/88 - 1995/96 in Thousand Tonnes 1987/88 1990/91 1992/93 1993/94 1994/95 1995/96 0 2 4 6 Coconuts
TABLE XV: PRODUCTION OF CASH CROPS 1987/88 - 1995/96 IN TONES CROP 1987/88 1990/91 1992/93 1993/94 1994/95 1995/96 Cotton 972 327 838 1342 924 3114 Tea 1761 2325 3872 3901 3901 3905 Coffee 3154 2311 3085 3170 3170 3446 Cashewnuts 3730 4323 3848 3310 3310 5100 Tobacco 7.5 2.0 3.4 2.8 2.6 4.6 Cardamon 1406 1487 1501 1497 1676 1597 Sisal 24800 26153 27230 27230 20231 28476 Coconuts 38141 40761 45761 44107 46154 47497
Source: Regional Commissioner’s Office, Tanga, (Planning)
Sisal
Traditionally, sisal is the most important cash crop in Tanga Region and the main Tanzanian area for the production of this major export crop of the country. With the exception of Lushoto, sisal production can be found in all districts of the region, with main areas in Muheza and Korogwe. Production is less important in Handeni and Pangani districts. The greatest part of the total production comes from estates which have recently been privatised and most of them taken over by private companies.
Sisal like other export crops, its production highly depends on externally determined factors, namely the world market prices and other developments. But since, sisal still remains a valuable source of income to the people and one of the major export crops in the country, it needs to be developed further with a view to improve its quality and marketability. Production figures indicated in Table - appear to be too low and thus may not give us a true picture of what is obtaining in the sisal industry! Reasons are not given as to why figures are too low.
Coconuts
It is difficult to give a reasonable figure for the land under coconut production, although official statistics on hectarage show coconuts as being the crop with the fourth largest area in the Tanga region. Farmers merely harvest the nuts, use them for home consumption or sell them to obtain additional income. Coconuts in the region are mainly found along the coast, i.e. Pangani and Muheza. Their importance in the other districts is only marginal. Due to the unplanned production figures on the economics of coconuts, the available data can only be given as very crude indicators.
If we take the production of one palm at full maturity at 20 to 30 nuts per year on the average and we assume the price to be - per nut. This would give us a gross yield of - per year per three. Under advanced methods of production (i.e. establishment of a nursery, carefully selection of suckers, etc.) the yields are likely to be better.
Cashewnuts
Cashewnuts are very popular along the coast, mainly in Muheza, but its greater potential lies in the hinterland, i.e. Handeni and Korogwe. Cashew trees are seldom found in Lushoto. Poor cashewnut yields are a result of the failure to plant the seeds in accordance with the recommendations concerning spacing, protection of the young plant during the early stages of growth and regular picking of nuts. Therefore, with proper care of cashew trees, people could increase the yields and hence their incomes, let alone increasing the national export volume of cashewnuts as well as the GDP.
Coffee
This is an important cash crop in the high areas of the region, particularly the Usambaras where Arabica coffee is grown. Minor production of Robusta coffee can be found in the Tamota and Nguu areas of Handeni. In the Lushoto area, coffee is mainly produced by small holders, with very little husbandry work (e.g. pruning, weeding, mulching, etc). It is observed from Table XV that coffee production figures are very low and may not really reflect the true production levels in the region. It seems some coffee go into the market unrecorded!
Tea
The importance of tea as a cash crop for small holder growers is reflected in Table... Its production figures are higher than those of
coffee. Production figures of tea increased by 122 percent from 1761 tons in 1987/88 to 3905 tons in 1995/96. While for coffee, production increased by only 9 percent. Tea production in future is promising in terms of better prices.
Cardamon
Cardamon appears to be the region's third most important cash crop and the biggest cash enterprise for small holder growers. Cardamon thrives in the upper areas, especially in Muheza, Lushoto and Korogwe districts and to a lesser extent in the Nguu Mountains. Cardamon develops best under shade. Its better yields depend on the quality of land preparation, mulching and staking, weeding and drying. In addition, one would need to apply other farm inputs, e.g. fertilizers, pesticides, etc. for better yields and quality. The economics of cardamon production also depend on the developments in the world market, especially India which almost holds monopolistic position in the export of the crop.
Farm Implements
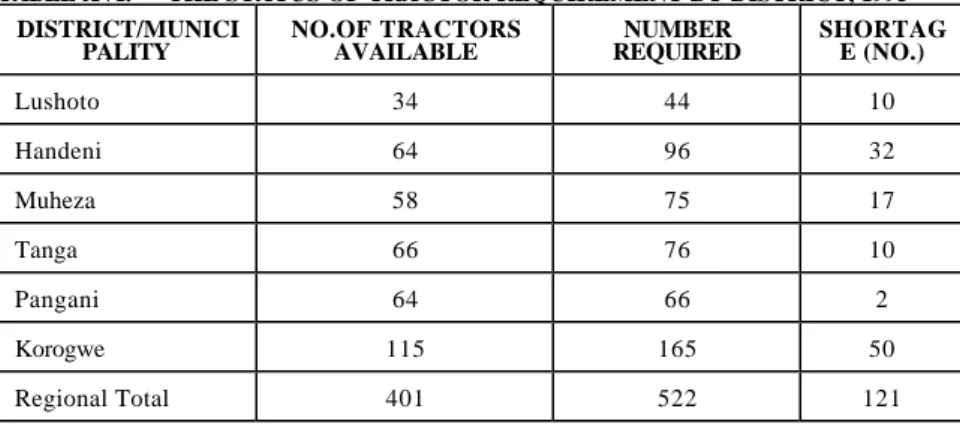
By looking at Table - below, it is obvious that the number of tractors in Tanga region is still inadequate, which it means that the majority of farmers continue using hand hoes for cultivation. Given the number of households which stood at 243,527 in 1988 (Census), it becomes difficult to talk of modern farming as it appears that the majority of
farmers will continue the use of handhoes. According to Table XVI, there are only 401 tractors in the region.
TABLE XVI: THE STATUS OF TRACTOR REQUIREMENT BY DISTRICT, 1995 DISTRICT/MUNICI
PALITY NO.OF TRACTORS AVAILABLE REQUIRED NUMBER SHORTAGE (NO.)
Lushoto 34 44 10 Handeni 64 96 32 Muheza 58 75 17 Tanga 66 76 10 Pangani 64 66 2 Korogwe 115 165 50 Regional Total 401 522 121
Source: Kitabu cha Mapendekezo ya Mpango wa Pili wa Muungano wa Maendeleo wa Miaka Mitano (1988/89-1992/93).
The amount of tractor ownership in Tanga region is a clear indication of the extent to which inferior agricultural implements are still in use in the region. Even if we assume that 15 percent of the households lived in the urban centres and that they needed no tractors, we shall still have 207,000 households in the rural areas without tractors. From this simple estimation, it is certain that agricultural production in Tanga Region is dominated by households using hand-held hoes. Hand-hoes will certainly retard the progress of agricultural development in the region.
Irrigation farming in Tanga region is feasible and would greatly make up for the loss caused by seasonal and erratic rainfalls on agricultural production. The potential for irrigation programmes exists in Korogwe and some parts of Lushoto. The region has irrigation potential of 42,000 hectares, of which only 10,500 hectares are effectively exploited. Studies made have revealed that most of irrigation farming is undertaken in Korogwe and Lushoto districts. In Korogwe there are 1,647 hectares put under irrigation while in Lushoto about 8,790 hectares are being irrigated.
Large-scale irrigation programmes in Tanga region are made difficult by several problems including water shortage, inadequate funding for the projects and weak leadership in maning irrigation projects. Given problems associated with rain fed agriculture, the Authorities in Tanga region need more than ever before to carry out campaigns to popularize the use of irrigation methods in farming. Even in districts like Muheza which have good rains, still need to embark on irrigation technology. Table XVII below highlights irrigation schemes in the districts of Korogwe and Lushoto.
TABLE XXXIV: IRRIGATION SCHEMES - 1991
District Project Crop Are
a (ha) Production (Ton/Ha.) Before Project After Projec t
Korogwe Mombo Scheme Chekelei Mazinde Manga/Bwiko Mkomazi Mombo Kwesasu Mombo Kidundai Manga/Goha, Mtindiro Mkumbara Kizara Kwemazandu Mahenge Magoma Makorora Kwamgumi Kerenge/Kibaoni Paddy Paddy Maize/Beans Paddy Paddy Maize Paddy Paddy Paddy Paddy Paddy Paddy Paddy Paddy Paddy 220 177 120 150 200 80 70 90 30 30 100 90 100 50 80 60 - 1 0.5-1 0.8 2.0 2.0 1.0 2.0 2.0 2.0 2.0 0.5 - 1.0 2.0 1.5 - 3.0 - 1.2 2.0 - - - - - - 1.5 2.0 1.5 - 1.5 1.5 - Lushoto Kwemkazu Kivingo/Chaula Mng'aro/Kitivo Kwemdimu Lunguza/Kituon i Kwengiriti/ Mkundi/Mtae Usambara Networks Paddy/Beans/Maize Paddy Paddy Paddy/Maize/Beans Paddy Maize Vegetable Fruits Beans 100 30 400 30 200 30 800 0 1.5 1.0 1.0 0.8 1.0 - 2.0 2.0 2.0 1.2 2.0 1.2 2.0 2.0 1.2 1.2
Source: Regional Commissioners Office (1993); Regional Development report (1961 - 1992)
Livestock Sector
Livestock keeping is the second dominant economic activity in Tanga region. The livestock in the region is mainly of indigenous cattle, mostly shorthorned zebu, goats, sheep, donkeys and chicken. According to the Livestock Census conducted country-wide in 1984, the region recorded 534,008 cattle, 256,616 goats, 116,568 sheep and 765,024 chicken. Table XVIII attempts to show the distribution of livestock in the region.
Fig. XVIII: Livestock Distribution in Handeni District 1984 Census
Indigenous Cattle 34.6% Goats 13.4% Sheep 4.7% Poultry 47.2%
Fig. XVIII: Livestock Distribution in Korogwe District 1984 Census Indigenous Cattle 45.9% Goats 16.8% Sheep 7.7% Poultry 29.7%
Fig. XVIII: Livestock Distribution in Lushoto District 1984 Census
Indigenous Cattle 27.7% Goats 14.1% Sheep 10.2% Poultry 48%
Fig. XVIII: Livestock Distribution in Muheza District 1984 Census Indigenous Cattle 21.4% Goats 19.7% Sheep 4.7% Poultry 54.3%
Fig. XVIII: Livestock Distribution in Pangani District 1984 Census
Indigenous Cattle 57.4% Goats 4.9% Sheep 1.6% Poultry 36.1%
TABLE XVIII: LIVESTOCK DISTRIBUTION BY DISTRICT - 1984 CENSUS
District Indigenous Cattle Goats Sheep Poultry
Handeni 175984 68,454 24,082 240,413 Korogwe 116656 61,327 27,812 108,217 Lushoto 132599 67,863 48,671 231,392 Muheza 49829 46,439 11,358 127,225 Pangani 34655 3,399 1,239 21,932 Tanga 24285 9,134 3,406 35,845 Total 524008 256,616 116,568 765,024 Growth Rate 2.3 1.8 1.7 .
Source: Livestock Census 1984, Tanga: Regional Commissioner’s (Planning).
Based on the growth rate of 2.3 percent per annum, cattle population is estimated to be 685,771 in 1995 in Tanga Region, giving rise to an increase of 28 percent in twelve years (1984-1995).
It is observed from Table XVIII that Handeni district had more cattle, goats and sheep in 1984. This was mainly due to the presence of a large
number of Masai people compared with other districts. By nature, the Masai people tend to keep more of the three types of animals. Pigs are least popular in the region mainly on religious grounds as the majority of the people are Muslims. Pasture development is normally good in Muheza, Tanga and Pangani districts and in the highlands. On the Lowlands of Handeni, Korogwe and Lushoto there are seasonal variations with livestock owners migrating during the dry season in search of pasture and water.
Dairy farming is fast becoming prominent in both urban and rural highland areas. This being the results of efforts made by the Government (assisted by Dutch Government) in undertaking small scale dairy extension projects. Milk production has improved from an average of three litres per day to over twenty litres per day and the average milk production per cow per day is about 3 to 4.5 litres. Livestock Development Department has recently brought in Boran bulls for cross-breeding with the local Tanzanian short horn zebu type with a view to get a better breed capable of maturing faster and producing more milk. Thus, to meet the goals of the dairy programme in the region, 13 bulls centres have been established and one Artificial Insermination Centre. The common cross-breeds are Ayshire, Iriesian and Jersey types. So far, there are 6,189 dairy cattle of which, 60 percent are owned by
Mkonge Livestock Company and Amboni Estates Limited. There are three main milk collecting centres, in Tanga, at Amani and in Lushoto. The development of dairy farming in Tanga region is constrained by:-
i) Availability and high prices of in-calf heifers,
ii) Short supply and high prices of inputs like feed concentrates, drugs, etc.
iii) Lack of transport to facilitate provision of
veterinary extension services, and
iv) Inadequate funds allocated for the development of
livestock activities
Otherwise the region has a sizeable potential for dairy development. poultry development is slowly gaining momentum.
Unfortunately enough, as it is in many regions, the economics of livestock keeping and cattle in particular is not yet fully exploited by most cattle keepers in Tanga Region. Livestock keepers tend to treat or regard livestock as simply a symbol of wealth and only very few people consider cattle as an account in the bank that earns interest. Consequently, very little attention is given to the economics of livestock keeping. Livestock has so many uses. For instance, animal products such as meat, milk, butter and cheese could be sold or eaten to supplement the diets of the people. Cattle could also be used as traction animal and for meeting bride prices. For better quality, people need to keep livestock whose number is dictated by the land carrying capacity as well as owner's ability to maintain them.
Livestock Infrastructure
Poor health of domestic animals is always a problem to many pastorists. The most common and problematic disease to cattle is East Coast Fever. Tick borne diseases are also causing problems to livestock. But experience shows that these diseases do cause serious problems simply because livestock lacks service infrastructure. For instance, dipping services are no longer available in most dips. There are no vaccines nor drugs given.
4.2.5 NATURAL RESOURCES AND TOURISM
Tanga region is endowed with numerous natural resources and good tourist attraction sites although most of which are yet to be fully developed. Some of the Natural resources include minerals deposits, forestry, game reserves, fisheries and beekeeping. Tourist attraction sites include Mkomazi game reserve, Amboni Caves, Totten Islands, Tongoni ruins, Pangani beach and hot water baths in Amboni and Amani Nature Reserve.
i) FORESTS
Total woodland are in Tanga Region covers 2,013,279 hectares of land. This is divided into dense and open forests
shrub bush, thicket and forest reserves. Much of this natural woodland consists of shrub (56,58%%) and open forests (30.65%). The forest products includes timber, poles medicines, fuelwood, charcoal, briquettes etc Table XIX highlights the distribution of woodlands in the Region percentagewise.
TABLE XIX: WOODLANDS IN PERCENTAGE DISTRICT OF MUNICIPALITY DENSE FORESTS OPEN FORESTS SHRUB BUSH THICKET Tanga 0.0 0.04 0.33 0.0 Pangani 0.81 0.23 3.09 0.09 Korogwe 0.98 0.94 6.17 0.51 Muheza 1.74 1.21 9.21 1.26 Lushoto 1.66 3.12 9.60 0.22 Handeni 5.540 25.11 28.18 0.0 Totals 10.69 30.65 56.58 2.08
According to Table XIX, Handeni district leads in terms of large tracks of woodland, of which the biggest portion is shrub bush followed by open forests. About 14,875 hectares belong to forest reserves, while 27.09 percent of it lies in Handeni, 26.13 percent in Lushoto, 23.83 percent in Muheza, 20.83 percent in Korogwe and 2.12 percent in Pangani. As it is common in many poor societies, woodlands in Tanga Region are increasingly being exploited for charcoal and fuel, furniture, building and construction materials. It is at this juncture, that afforestation programmes become necessary in order to safeguard the environment against further depletion or degradation. There are certain districts in Tanga which require immediate afforestation programmes to redress soil erosion. These districts include, Lushoto, and Muheza especially in Amani area. SECAP and IUCN/EEC are undertaking afforestation programmes in Lushoto and Amani. Table XX shows the efforts being made by the government and different institutions to fight against over exploitation of forests.