Edited by Y O Kim, H T Park and K W Seo, Seoul: Sejong University, 2013
URBAN VALUE:
Measuring the impact of spatial layout design using space
syntax
061
Stephen Law
University College London e-mail : [email protected]
Tim Stonor
Space Syntax Limited e-mail : [email protected]
Sammir Lingawi
Oxford University e-mail : [email protected]
Abstract
Space syntax is a science-based, human-focused approach that investigates relationships between spatial layout and a range of social, economic and environmental phenomena. Research using space syntax has shown how spatial layout design influences urban movement patterns, patterns of personal and property safety and the development of centres and sub-centres in cities. In this paper, we apply the space syntax approach to the field of real estate valuation. We correlate rateable value with spatial layout attributes for ten town centres in London using data from the “Paved with gold” study (CABE, 2004). We present a methodology in which space syntax techniques are integrated into a financial modelling approach to assess the economic value uplift created by changes in the spatial layout design of two major real estate developments in London. Sensitivity tests are undertaken to demonstrate the impact of spatial layout changes on land value. The tool is used to assess design scenarios at an early stage of the development process, allowing stakeholders to discuss the merits of different options in an evidence-informed way.
Keywords: Space Syntax, Real Estate, urban modelling, urban design Theme: Modelling and Methodological Developments
S Law, T Stonor and S Lingawi : Urban value 061: 2
1.0 Background
Space syntax is a set of theories and techniques which applies graph theory method to study the spatial configuration of cities in relation to social phenomena. (Hillier and Hanson 1984; Penn et al. 1998). Spatial configuration has been found to relate closely to pedestrian movement, vehicular movement and public transport passenger volume. (Penn et al. 1998; Hillier and Iida, 2005; Law et al., 2012) Previous research between space syntax and economics focused on the relationship between spatial configuration and both housing value and commercial rental value. However what appear lacking in this literature is how this understanding can be communicated to stakeholders in the decision making process. The objective of the paper is thus to propose a practical method, “The Urban Value Tool” that can be used to communicate to developers and government officials and other stakeholders how differences in spatial layout can influences the economic value of a place. This study does not propose a new theory. Rather, it sits within the realm of practical research implementing existing knowledge. This work will complement recent works on the intangible socio economic value of urban layout (Chiaradia and Schwander, 2009) the economic value of crime (Friedrich, Hillier, Chiaradia, 2009 and Chiaradia, Hillier, Schwander, 2009b and Hillier and Shu, 2000), the economic values of town centre (Chiaradia, Hillier, Schwander, Wedderburn, 2009a) and other research on the environmental, social and health economic value of urban design. (CABE, 2007)
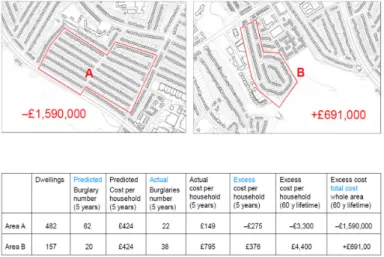
Figure 1: Economic value of crime (Space Syntax Limited, 2009)
1.1 Research approach
To demonstrate how established relationship between economics and spatial configuration fit into a financial framework, three stages of work are proposed as described in the figure below. The first stage establishes an empirical base where rateable value is regressed against spatial layout attributes through a simple linear regression model. (Chiaradia et al., 2009a) In the second stage, we use the linear regression model to predict future commercial economic value for two designs of two case studies in London. In the third stage, we integrate these monetary forecast into a simplified development cashflow to assess two design scenarios for the two case studies. This simplified framework can become a communication tool at an early stage of the development process where the exact quantum of the development have yet to be established. Further research is required in the validation of the prediction as well as accounting for dynamic factors influencing a developerment using simulation methods.
S Law, T Stonor and S Lingawi : Urban value 061: 3 Figure 2: Research approach
2.0 Linkage between spatial configuration and rateable value
Previous research had established the positive associations between space syntax measures and rateable value in London (Chiaradia et al, 2009a) and commercial office rents in Berlin (Desyllas, 2001) through statistical models. A similar multiple variable regression method is applied where average rateable value per square metre is regressed against global accessibility, local accessibility, socio-economic variables plus a random stochastic component. The method of ordinary least square (OLS) is used for the estimation of the regression model. A key limitation to this research is the simplified linear specification of the statistical model.
Equation (1)
2.1 Datasets
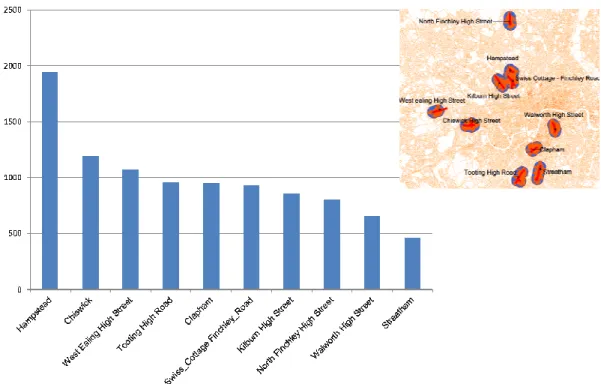
This research will use the same dataset as CABE’s Paved With Gold study which associated town centre economic performance indicator with urban design indicator. (Cabe, 2007) The dataset includes average rateable value per square metre and socio-economic characteristics for ten case study town centres in London; Hampstead, North Finchley High Street, Swiss Cottage and Finchley Road, Kilburn High Street, Walworth High Street, Clapham, Streatham, Tooting High Street, Chiswick High Street, West Ealing High Street. 1 The figure below illustrates the location of the ten town centres in London and the average rateable value per square metre.
S Law, T Stonor and S Lingawi : Urban value 061: 4
1 Average rateable value represents the annual rent that the property could have been let for on the open market and defined by an independent Valuation Officer at the Valuation Office Agency. All non-domestic properties are re-valued every 5 years. The latest revaluation was at 01/04/2010.Information on rateable values can also be found on the Valuation Office Agency's website at www.voa.gov.uk
Figure 3: Ten town centres rateable value (Cabe, 2004)
The underlying socio-economic statistics in the study originated from Census Area statistics as defined by UK Office for National Statistics. Population describes the total residents living within 800m of each town centre. Employment describes the number of jobs employed within 800m of each town centre. Index of multiple deprivation describes the average IMD score within 800m of each town centre. The index of multiple deprivation is an indice produced by UK government to describe the social and economic well-being for the area covering seven aspects including income, employment, health deprivation, education, barriers to housing and service, crime and living environment.
2.2 Space syntax accessibility measures
Similar to previous research, we include spatial configuration measures of accessibility into the statistical model. In a space syntax network model, segments in a street network are analysed using the computer software UCL Depthmap developed by Alasdair Turner, Eva Friedrich and Tasos Varoudis (Turner, 2004). Two measures that relate to the urban environment most commonly computed in space syntax used in this study are:
Space Syntax Segment Angular Integration, (equation 2) measures the space that is most central to all other spaces in the network.
Space Syntax Segment Angular Choice, (equation 3) which measures how many times a space is selected on journeys between all pairs of origins and destinations.
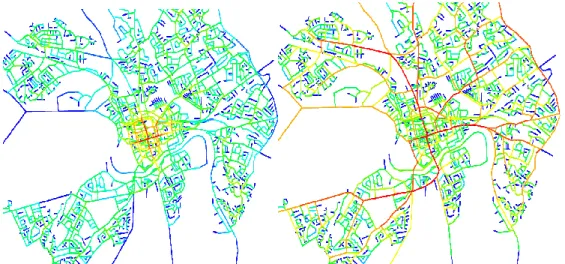
These two measures represent the To and Through movement potential of the street segment. For more details please see Hillier and Iida’s seminal paper in 2005 (Hillier and Iida, 2005) and more recently Hillier and Yang and Turner’s paper in 2012. (Hillier, Yang, Turner, 2012). The figure below illustrates segment angular integration on the left and segment angular choice on
S Law, T Stonor and S Lingawi : Urban value 061: 5
right for the city of Chester courtesy of Space Syntax Limited.
Fig 4: Left segment angular integration of Chester and Right segment angular choice of Chester (Space Syntax Limited, 2013)
Equation (2)
Equation (3)
2.3 Exploratory statistical analysis
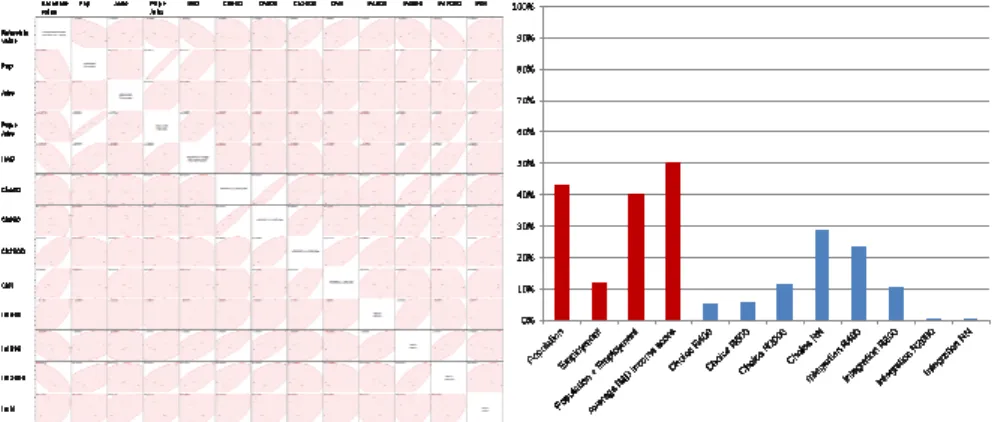
Before regressing the average rateable value with spatial configuration factors, exploratory data analysis are applied to the dataset. The figure below shows scatterplots on the left and bi-variate correlation results on the right between rateable value and all the spatial and non-spatial factors in the dataset. The scatterplot shows positive association between rateable value with jobs, global choice and local integration, negative association with population and IMD score (the lower the higher rank) and weak association with global integration and local choice. The results suggest generally highest correlations between Average Index of Multiple Deprivation (IMD) score, Number of Residents living in the study area and Global Choice with Rateable Value for the ten town centres. This corresponds to previous research where higher socio-economic group as indicated by IMD score, higher residential population and higher accessibility explain differences in rateable values.
S Law, T Stonor and S Lingawi : Urban value 061: 6 Figure 5: Exploratory data analysis results
2.4 Regression results
Regression results are reported in the figure below for the selected model. The selected statistical model demonstrates a positive relationship between rateable value and Integration Radius 400metre, Choice Radius N within 800metre and a negative relationship between average rateable value and average Index of Multiple Deprivation (IMD) score within 800metre. These results indicate that these three variables together explain 88% of the average rateable value differences between town centres. A key assumption in the model is the linear relationship between these variables with average rateable value per square metre forming the basis for the prediction in the next section.
RSquare 0.88
RSquare Adjusted 0.82
Root Mean Square Error 167.67 Mean of Response 980.59 Observations (or Sum Wgts) 10
AIC 150.71 BIC 137.22
Estimates t Ratio Prob > t Lower 95% confidence interval
Upper 95% confidence interval Beta
Intercept 731.27 1.72 0.137 -311.58 1774.11 0
Average IMD income
score within 800m -3901.33 -4.34 0.005 -6100.76 -1701.89 -0.62 Choice Radius N
Maximum within 800m 0.00000006 3.37 0.015 0.00000002 0.0000001 0.51
Integration Radius 400m 9.72 1.54 0.175 -5.75 25.18 0.23
Figure 6: Multiple variable regression results
3.0 Case study
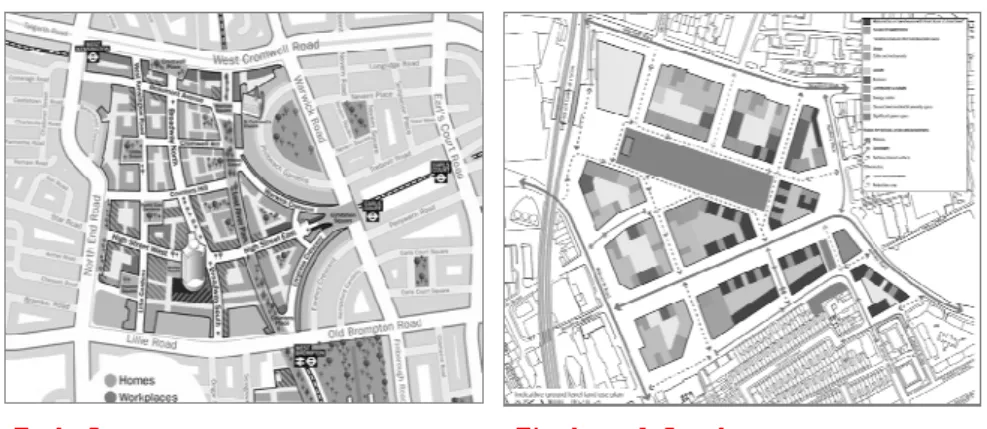
The figure below introduce the Earls Court masterplan and the Elephant and Castle Masterplan. Both are large scale regeneration sites in peri-urban parts of London. The rationale in the case
S Law, T Stonor and S Lingawi : Urban value 061: 7
study selections stems from the similarity and proximity to the ten town centre case studies. The figure below shows how they would look when the two masterplans are completed.
Figure 7: Two case studies
In the next section, we will forecast the rateable value for the proposed layout based on equation (1) for each case study. We will then create an imaginary dislocated layout and forecast the rateable value for the dislocated layout of each case study based on the same equation for comparison.
Equation (1)
3.1 Rateable value forecast
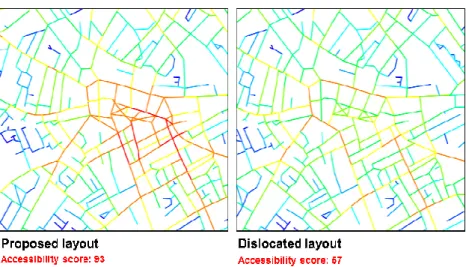
The figure below illustrates the Space Syntax Accessibility values for the proposed layout and dislocated layout in the two case study areas where higher centrality values are visualised in warm colours (red, orange), while lower centrality values are visualised in cold colours (green, blue).
S Law, T Stonor and S Lingawi : Urban value 061: 8
Elephant and Castle
Figure 8: Dislocated and proposed layout spatial accessibility value for two case studies
Predicted average rateable value Lower 95% confidence interval rateable value Upper 95% confidence interval rateable value Earls_Court_MP_good 897 623 1,172 Elephant_MP_good 921 423 1,419 Earls_Ct_MP_bad 509 55 963 Elephant_MP_bad 571 317 825 Table 1: Rateable value forecast summary
Using equation 1 from the linear regression model, the table above summarises the average forecast rateable value per sqm for the two case studies. Assuming constancy in socio-economic values in the short term, the average rateable value of the proposed layout for Earls Court is £900 while that of the dislocated layout is £500. The average rateable value of the proposed layout for Elephant and Castle is £920 while of the dislocated layout is £570. Both the upper 95% and the lower 95% confidence interval rateable value are reported in the forecast summary.
S Law, T Stonor and S Lingawi : Urban value 061: 9
The small number of samples and the linear specification of the statistical model are limitations that need to be address in the future. For section 4, only the average forecast rateable value is reported in the cashflow analysis.
4.0 Financial cashflow model
For the third part of the analysis we attempt to determine the extent to which the changes in economic value brought on by enhanced spatial accessibility can improve the viability and profitability of an entire development. To assess this we took the perspective of a developer and created a financial model for both proposed developments (Elephant & Castle and Earls Court). This financial model incorporates estimated revenue, capital costs, operating costs, and financing costs of each devleopment in order to determine the potential Internal Rate of Return (IRR) and Net Present Value (NPV) of these projects. IRR is a common profitability measure used by developers to decide whether or not to proceed with a project with a potential project.1 Likewise NPV is a measure which looks at the present value of all future profits net of all future costs of the project. This type of financial modeling and the resulting IRR / NPV analysis underpin the decision making process that a developer undergoes when assessing the profitability of potential new projects.
The difference between our analysis and what is typically done by a developer is that our analysis will look at the same proposed projects in three different scenarios:
A. Dislocated layout with revenue from forecast average retail rateable value B. Proposed layout with revenue from forecast average retail rateable value
C. Proposed layout with both revenue from forecast average retail rateable value and an assumed 15% increase in revenue from the residential and commercial uses resulting from the enhanced spatial accessibility. This is to simulate the value premium from being in close proximity to a vibrant and successful town center.
4.1 Cashflow model assumptions
The financial model used in this report has been simplified in comparison to what a developer would normally produce; however, this was done for simplicity and clarity. All assumptions used in creating this financial model are included in the appendix, however, there are a few assumptions that are important to understanding the results. These are:
• 40 year financial model
• Model assumes that the developer purchases land, constructs buildings, and then rents
all uses (residential, office and retail) over the 40 year period
• Costs were taken from market reports, and the BCIS manual
• The model assumes a simplified debt structure for the financing of the capital costs • All assumptions are carried across the three scenarios with the only change being the
changes to spatial accessibility.
Revenue assumptions have been gathered from various reports including the forecast average rateable value from Space Syntax in the previous section, office rental value from Savills report and residential rental value from Jones Lang LaSalle. The cost assumptions are collected from RIC’s Building Cost Information Service Handbook which includes costs assumption on materials and labour. Revenue assumptions sources and cost assumptions sources are illustrated in the figure below.
S Law, T Stonor and S Lingawi : Urban value 061: 10
For comparison, we have constructed three financial cashflows for each of the two case study. The first modelA is the dislocated layout model, the second model B is the proposed layout model and the third modelC is the proposed layout model with the additional assumptions of office and residential rental value uplift resulting from the retail value uplift.
Figure 9: Financial cashflow assumptions
4.2 Financial cashflow summary
The chart at the below shows a sample cashflow that was created for one of the scenarios. Six cashflows were actually produced, (a cashflow for mode A, B, and C) for Earls Court and Elephant and Castle. This cashflow is similar to those that are used by developers and it illustrates the inputs that were used to calculate net present value and IRR. The charts below the cashflow show the IRR and NPV results of mode A, B, and C.
S Law, T Stonor and S Lingawi : Urban value 061: 11 Figure 10: Financial cashflow summary 2
For Earls Court, Model A achieved a NPV of £665 million with an IRR of 15%, Model B achieved a NPV of £741 million with an IRR of 16% and Model C achieved a NPV of 1.0 billion with an IRR of 18%. The difference between the Dislocated layout and the Proposed layout with the general uplift in residential, retail and office rental value is a Net change of NPV of +£335 million and a net change of IRR of +20%.
For Elephant and Castle, Model A achieved a NPV of £47 million with an IRR of 11%, Model B achieved a NPV of £85 million with an IRR of 12.5% and Model C achieved a NPV of 145 million with an IRR of 14%. The difference between the Dislocated layout and the Proposed layout with the general uplift in residential, retail and office rental value is a Net change of NPV of +£98 million and a net change of IRR of +27%.
These revenue forecast and projected NPV and IRR are generated from the average rateable value forecast from section three. Sensitivity tests using upper and lower 95% forecast bounds are recommended in the future to account for uncertainty. The results should be taken as relative for comparison rather than absolute.
The results demonstrate a significant difference between the Dislocated layout model and the Proposed layout. Since each models assume the same land use distribution and the same development quantum the differences in IRR are attributable to the retail income differences in spatial layout. This suggests that there is a significant amount of additional profit that can be
S Law, T Stonor and S Lingawi : Urban value 061: 12
captured by the developer if the spatial layouts are configured correctly. Part of the procedure involved in testing these scenarios was to ensure that the net linear length of road and infrastructure was the same. Therefore this realignment of the spaces in the development could be done at little or no additional cost to the developer. The results of the models are derived from the analysis presented in the previous sections where average rateable value are predicted from a simple linear regression model. Further research in the specification of the statistical model and verifying these results and assumptions would be useful in the future.
It is envisioned that this methodology can be used in the future to assess potential layouts of developments. In the past, spatial planning and the speculative process of development have often operated in separate silos of thinking and objectives. Spatial planners endeavour to produce holistic neighbourhoods that produce walkability and social inclusion. Developers on the other hand are attempting to meet a targeted return on investment, and see the benefits of social cohesion, and walkability as things that are ‘nice to have’ but are not critical to their bottom line. Part of the reason why there is this disconnect between planners and developers is that developers cannot find a way to “monotise” the production of integrated spaces into their financial models. This report attempts to take the first steps in bridging the process and methods of spatial planners and developers.
5.0 Steps forward
The objective of the paper is to propose a practical method, “The Urban Value Tool” that can be used to communicate to developers and government officials and other stakeholders how differences in spatial layout can influences the economic value of a place. This study does not propose a new theory but rather it sits within the realm of practical research.
The first part of the study demonstrated an association between spatial configuration with property value. The second part of the report takes the next step and uses a simplified regression model to forecasts future average rateable value. The third part shows that the measures of spatial accessibility can be incorporated into the decision making process of a for-profit developer.
It is hoped that by breaking down the barriers between these disciplines and creating integrated tools for understanding and analysing the built environment will lead to more cohesive, inclusive, sustainable and profitable developments in the future.
Further work is suggested in developing more robust models and producing post project evaluations. In this way, it might become a practical tool for formulating policy and evaluating spatial layout design.
Notes
1 Developers often have an IRR hurdle which must be met before they decide to embark/invest in a project. There is no standard hurdle rate in the industry, as hurdle rates differ between companies and in different market conditions. However, generally the higher the IRR the better. In this respect most developers would usually see IRR above 12% -15% as favorable.
2 These revenue forecast are generated from the average rateable value forecast from section three. Sensitivity
tests using upper and lower 95% forecast bounds are recommended in the future to account for uncertainty.
References
S Law, T Stonor and S Lingawi : Urban value 061: 13
Built Environment. London
Chiaradia, Alain J. and Christian Schwander. 2009. The intangible values of urban layout. The Complete UrbanBuzz, London: University College London, pp. 134-139.
Chiaradia, Alain J., B. Hillier, C. Schwander, and M. Wedderburn. 2009a. "Spatial Centrality, Economic Vitality/Viability: Compositional and Spatial Effects in Greater London." Presented at: 7th International Space Syntax Symposium, Stockholm, Sweden, 8-11 June 2009. Published in: Koch, Daniel, Marcus, Lars and Steen, Jesper eds. Proceedings of the 7th International Space Syntax Symposium. Stockholm: KTH,
Chiaradia, Alain J., B. Hillier, and C. Schwander. 2009b. "Spatial Economics of Crime: Spatial Design Factors and the Total Social Cost of Crime against Individuals and Property in London." Presented at: 7th International Space Syntax Symposium, Stockholm, Sweden, 8-11 June 2009. Published. Edited by Daniel Koch, Lars Marcus and Jesper Steen. Proceedings of the 7th International Space Syntax Symposium. Stockholm: KTH
Chiaradia, Alain J., B. Hillier, Yolanda Barnes, and C. Schwander. 2009c. "Residential Property Value Patterns in London: Space Syntax spatial Analysis." Presented at: 7th International Space Syntax Symposium, Stockholm, Sweden, 8-11 June 2009. Published. Edited by Daniel Koch, Lars Marcus and Jesper Steen. Proceedings of the 7th International Space Syntax Symposium. Stockholm: KTH
Chiaradia, Alain J., Bill Hillier, Yolanda Barnes, and Christian Schwander. 2012a. "Residential property value and urban form patterns in Greater London." Urban Design and Planning, Proceedings of the Institution of Civil Engineers
Chiaradia, Alain J., Bill Hillier, Christian Schwander, and Martin Wedderburn. 2012b. "Compositional and urban form effects in centres in Greater London." Urban Design and Planning: Proceedings of the Institution of Civil Engineers 165 (1): 21-42.10.1680/udap.2012.165.1.21
Desyllas, J. 2000. The relationship between urban street configuration and office rent patterns in Berlin. University College London.
Friedrich, Eva, Bill Hillier, and Alain J. Chiaradia. 2009. "Anti-social Behaviour and Urban
Configuration: Using Space Syntax to Understand Spatial Patterns of
Socio-environmental Disorder." Presented at: 7th International Space Syntax Symposium, Stockholm, Sweden, 8-11 June 2009. Published. Edited by Daniel Koch, Lars Marcus, and Jesper Steen. Proceedings of the 7th International Space Syntax Symposium. Stockholm: KTH.
Hillier, B., and J. Hanson. 1984. The social logic of space. Cambridge, MA: Cambridge University Press.
Hillier, B., A. Penn, J. Hanson, T. Grajewski, and J. Xu. 1993. "Natural movement: or, Configuration and attraction in urban pedestrian movement." Environment and Planning B: Planning and Design, 20 (1), 29–66.
Hillier, B. 1996. Space is the machine. Cambridge, MA: Cambridge University Press.
Hillier, B. and S. Iida. 2005. "Network and psychological effects in urban movement." In Proceedings of Spatial Information Theory: International Conference, edited by A.G. Cohn and D.M. Mark. COSIT 2005, Ellicottsville, N.Y., U.S.A., September 14-18, 2005. Lecture Notes in Computer Science (Vol. 3693). Springer-Verlag, Berlin, Germany, pp.
S Law, T Stonor and S Lingawi : Urban value 061: 14
475-490
Hillier, B. and O. Sahbaz. 2005. "High resolution analysis of crime patterns in urban street networks: an initial statistical sketch from an ongoing study of a London borough." In Fifth International Space Syntax Symposium, Vol I, edited by A. van Nes, 451-478. Delft: TU Delft.
Hillier, B. T. Yang, A. Turner, 2012. "Normalising least angle choice in Depthmap - and how it opens up new perspectives on the global and local analysis of city space." JOSS 2012: 155-193
Hillier, B. and S. Shu. 2000. "Crime and urban layout: the need for evidence." In Key Issues in Crime Prevention and Community Safety, edited by V MacLaren, S Ballantyne and K Pease. London: IPPR.
Space Syntax Limited, 2013. Space Syntax Limited website., http://www.spacesyntax.com/ Turner, A. 2004. Depthmap 4, A Researcher's Handbook, http://www.vr.ucl.ac.uk/depthmap/