KENYA U G A N D A R W A N D A BURUNDI ZAMBIA MSUMBIJI
THE UNITED REPUBLIC OF TANZANIA MBEYA REGION
SOCIO-ECONOMIC PROFILE
Joint Publication by: THE PLANNING COMMISSION
DAR ES SALAAM and
REGIONAL COMMISSIONER'S OFFICE MBEYA
TABLE OF CONTENTS
Pages
FOREWORD...v
SECTION I...1
LAND POPULATION AND CLIMATE:...1
GEOGRAPHICAL LOCATION:... 1
REGIONAL AREA AND ADMINISTRATIVE UNITS... 1
ADMINISTRATIVE DIVISIONS:... 2
LAND USE: ... 4
(III) 1.2.1 ETHNIC GROUPS:... 7
(IV) 1.2.2 POPULATION SIZE AND GROWTH:... 7
POPULATION DENSITY AND DISTRIBUTION: ...12
MIGRATION:...19
1.1.4 TOPOGRAPHY: ... 23
SECTION II...25
2.0 THE REGIONAL ECONOMY:...25
2.1 INTRODUCTION ... 25 2.3 PRODUCTIVE SECTORS... 40 2.3.1 Agriculture:...40 A. FOOD CROPS ...40 CASH CROPS: ... 45 IRRIGATION: ...52 FARM IMPLEMENTS:...53 FARM INPUTS:... 55 2.3.5 STORAGE FACILITIES... 57 LIVESTOCK...58
2.4.2 DIARY CATTLE DEVELOPMENT... 62
2.2.5 LIVESTOCK INFRASTRUCTURES: ... 65
2.5.1 Introduction:...67 Afforestation:...70 2.5.4 Wildlife:...73 2.5.5 Beekeeping:...74 FISHING INDUSTRY:...78 MINING:...84 INDUSTRIAL ACTIVITIES:...85 SECTION III ...88 ECONOMIC INFRASTRUCTURE:...88 ROAD NETWORK:... 88 Introduction:...88
SOURCE: PLANNING COMMISSION - COMPILED DATA BASED ON DISTRICT SOCIO -ECONOMIC PROFILES-1996... 89
ROAD NETWORK MAP - MBEYA REGION... 90
RAILWAY TRANSPORT:...95
AIR TRANSPORT:...95
WATER WAYS: (Marine Transport)...95
ENERGY:...96
ELECTRICITY: ... 96
FUELWOOD AND CHARCOAL:... 97
SOLAR ENERGY:... 98
BIO-GAS ENERGY:... 98
COAL AND PADDY HUSKS:... 98
POSTS AND TELECOMMUNICATION NETWORK:...98
SECTION IV ... 101
SOCIAL SERVICES ... 101
EDUCATION: ... 101
PRIMARY EDUCATION: ... 101
PRIMARY SCHOOL DROP-OUTS:... 120
SECONDARY SCHOOL EDUCATION... 132
OTHER TRAINING INSTITUTIONS:... 141 HEALTH SECTOR:... 142 DISPENSARIES: ... 144 HEALTH CENTRES: ... 145 HOSPITAL SERVICES:... 146 Mortality:... 149 MATERNAL MORTALITY... 151 MALNUTRITION:... 154 IMMUNIZATION... 157 WATER SECTOR ... 159
(A) URBAN WATER SUPPLY: ... 161
RURAL WATER SUPPLY SCHEMES: ... 163
ENVIRONMENTAL SANITATION:... 165
SECTION V ... 167
OTHER RELATED DEVELOPMENT ISSUES:... 167
CO-OPERATIVE ACTIVITIES:... 167
A. UNIONS:... 167
PRIMARY CO-OPERATIVE SOCIETIES:... 169
WOMEN IN DEVELOPMENT:... 171
SECTION VI... 175
DEVELOPMENT POTENTIALS AND PROSPECTS:... 175
AGRICULTURE:... 175 IRRIGATION:... 175 ANIMAL HUSBANDRY: ... 177 BEEKEEPING: ... 177 FISHING:... 178 INDUSTRIES:... 178 TOURISM: ... 179 MINING INDUSTRY: ... 181
ANNEX I... 186
1.0 GENERAL INFORMATION ABOUT TANZANIA ... 186
AREA OF MAINLAND ... 186
TANZANIA MAINLAND AREA BY REGIONS (SQ KM)... 186
POPULATION ... 187
LAND USE... 188
ARABLE LAND:... 188
LAKES ... 188
MOUNTAIN SUMMITS (METRES ABOVE SEA LEVEL)... 188
CLIMATE... 189
(A) RAINFALL... 189
1.2 SOCIAL SERVICES ... 190
HEALTH FACILITIES ... 190
EDUCATION: ENROLMENT RATES 1995 COMPARED WITH OTHER EAST AFRICA COUNTRIES... 190
FOREWORD
1. As we approach the 21st Century the problems facing rural
areas in developing countries like Tanzania are numerous and formidable. Social and Economic services are deteriorating and proving to be unsustainable; school enrollment rates are declining; food situation is precarious; infant and maternal mortality rates continue to be high; unemployment is on the rise triggering off mass migration of youth from the rural areas into already overcrowded urban centres; in Mbeya Region, for example, land pressure is escalating and deforestation is going on at an alarming rate.
2. This situation has arisen because of many factors including ill -
prepared rural development programmes and weak monitoring and supervision of the implementation of development programmes and sectoral strategies. The observed shortcomings in the policy formulation, project identification, design, and implementation in the developing countries is in turn attributed to lack of reliable and adequate data and information on the rural development process.
3. The publication of Regional Socio-economic Profiles series by
the Planning Commission in collaboration with Regional Commissioner's offices should be viewed as a fruitful attempt towards finding solutions to the existing problem of data and information gap.
4. The Regional Profile series cover a wide range of data and
information on geography, population, social economic parameters, social services, economic infrastructure and productive sectors. The publications so far have proved to be of high demand and a vital source of information to many
policy makers, planners, researchers, donors and functional managers.
The Planning Commission has found it a worthwhile effort to extend the exercise to cover even more regions. Readers are invited to make suggestions and constructive criticisms which can assist in improving the quality and effectiveness of future Profiles.
5. I would like to take this opportunity to acknowledge with
thanks once again the financial support of the Royal Norwegian Embassy which facilitated the preparation of the Mbeya Region Socio-Economic Profile. I would also like to thank both the Planning Commission and Mbeya Regional Planning Staff who put a lot of effort into ensuring the successful completion of this task.
Nassoro W. Malocho (MP) MINISTER OF STATE
PLANNING AND PARASTATAL SECTOR REFORM April 1997
SECTION I LAND POPULATION AND CLIMATE: Geographical Location:
Mbeya Region originally belonged to the Southern Highlands Province. In 1963, the Southern Highalands Province was split into two regions namely, Mbeya and Iringa. In 1972, Mbeya Region was extended to incorporate Sumbawanga District which before then belonged to the Western Province. However, the inclusion of Sumbawanga District into Mbeya Region did not last long because in 1974 Sumbawanga District was separated and accorded full Regional status.
It is located in the South Western Corner of the Southern Highlands of Tanzania. The Region lies between Latitudes 7o and 9o 31% South of Equator, and between Longitudes 32o and 32o and 35o East of Greenwich. Mbeya region lies at an altitude of 475 metres above sea level with high peaks of 2981 metres above sea level at Rungwe higher attitudes.
Mbeya shares borders with countries of Zambia and Malawi to the immediate South; Rukwa Region to the West; Tabora and Singida Regions to the North; while Iringa Region lies to its East, with Tunduma and Kasumulu in Mbozi and Kyela districts respectively being the main entries and/or exist into neighbouring countries of Malawi and Zambia. Regional Area and Administrative Units
The Regional spacial area covers 63,420 Sq.kms. which is 6.4% of the total area of the United Republic of Tanzania. Out of the regional surface areas, 61,868 Sq.Kms. is dry land, about 57,000 Sq.kms. arable land; and 1.757 Sq.kms. is covered with water.
Fig. 1: Distribution of surface area in sq. km, Mbeya Region Dry land 52% Water 1% Arabel land 47% Administrative Divisions:
Mbeya Region is divided in six Administrative districts namely Chunya, Ileje, Mbeya, Mbozi and Rungwe. However, the official establishment of the seventh district of Mbarali (curved from Mbeya District) is soon to be effected. The districts are further divided into 25 divisions which are subdivided into 135 wards and 577 villages.
Table I: MBEYA REGION ADMINISTRATIVE UNITS BY DISTRICT Districts Area (Sq.Km.) Regional Share (%) No. of Divisions No. of Wards No. of Village Chunya 29,219 46.0 4 22 34 Ileje 1,908 3.0 2 13 35 Kyela 1,322 2.0 2 14 82 Mbeya (R) 19,093 30.0 5 21 158 (Mbarali) (16,000) (25.15) (2) (8) (71) Mbeya (U) 185 1.0 2 20 - Mbozi 9,679 15.0 6 26 141 Rungwe 2,211 3.0 4 30 136 Total 63,617 100.0 25 163 594
Source: Mbeya Regional Data Bank, 1996
Fig. 2: Distribution of land (sq. km) by District in Mbeya Region
0 5 , 0 0 0 1 0 , 0 0 0 1 5 , 0 0 0 2 0 , 0 0 0 2 5 , 0 0 0 3 0 , 0 0 0
LAND USE:
Land in Mbeya Region is put under different uses as Table II highlights. Table II: LAND CLASSIFICATION IN MBEYA REGION
Classification Area in Sq.Kms Area in Hectares Area Share (%) Arable Land 57,000 5,700,000 89.6 Game Reserves 990.4 99,.040 1.6 Forest Reserves 2,314 231,400 3.6 Water Bodies 1,757 175,700 2.8
Other Land Use (Settlement, in district etc)
- 190;842 3.0
Total 63,617 6,361,700 100
Source: Planning Commission - Compiled Data from District Profiles
Fig. 3: Land classifications in sq. kms, Mbeya Region
0 1 0 , 0 0 0 2 0 , 0 0 0 3 0 , 0 0 0 4 0 , 0 0 0 5 0 , 0 0 0 6 0 , 0 0 0 A r a b l e L a n d G a m e R e s e r v e s F o r e s t R e s e r v e s W a t e r B o d i e s
Fig. 4: Land classification (Area thousands Ha.) in Mbeya Region 0 1,000 2,000 3,000 4,000 5,000 6,000
Table III below shows the intensity of land use in each District. One serious observation can be made in Table III. That is, in Kyela district all arable hectares of land are being utilised
Table III: LAND USE BY DISTRICT IN MBEYA REGION
District Arable land (Ha.) Land under Agricultur e (Ha.) % of Land under Agricultur e Game Reserve (Ha.) Forest Reserve (Ha.) Water Area (Ha.) Other s (Ha.) Chunya 2,300,500 51,200 2.2 200,000 39,640 110,500 281,7 60 Ileje 101,600 350 0.3 - 6,050 - 83,15 0 Kyela 500,000 500,000 100 - 6,320 45,000 30,88 0 Mbeya (R) 572,089 211,420 37 500 46,623 - 1,290, 088 Mbozi 766,640 421,652 55 93,738 - 29,200 78,32 2
Rungwe 166,820 67,420 40 - 4,450 - 49,83 0 Average Total Area 4,407,649 1,252,042 28 200,000 196,821 184,700 1,822, 030 Source: Planning Commission Compiled Data
for agricultural activities. Unlike Chunya and Ileje districts where only 2.2 and 0.3 percent of their rable land are under agriculture respectively.
Chunya Ileje Kyela Mbeya (R) Mbozi Rungwe 0 500 1,000 1,500 2,000 2,500 Chunya Ileje Kyela Mbeya (R) Mbozi Rungwe
Fig. 5: Arable land (Thousands Ha.) use by District Mbeya Region
Chunya Ileje Kyela Mbeya (R) Mbozi Rungwe - 5 0 5 0 1 5 0 2 5 0 3 5 0 4 5 0 5 5 0 Chunya Ileje Kyela Mbeya (R) Mbozi Rungwe F i g . 6 : L a n d u n d e r A g r i c u l t u r e ( T h o u s a n d s H a . ) b y D i s t r i c t , M b e y a R e g i o n
(iii) 1.2.1 Ethnic Groups:
The indigenous tribes of Mbeya region are of Bantu Origin, who are believed to have moved into the region a long time ago. The ethnic groups in the region are Nyakyusa in Kyela and Rungwe Districts, Safwa, Malila and Sangu in Mbeya District, Nyika and Nyamwanga in Mbozi District, Ndali in Ileje District, and Bunguu and Kimbu in Chunya district. Between 1970 and 1990 there have been a significant inter-regional and intra-regional migration of tribes resulting into the Masai and Sukuma occupying Chunya and Mbeya Districts. A very heterogenous tribal composition is common in urban centres, like Mbeya Municipality and the District centres. The original settlements of various tribes in the region were determined by availability of water, fertile soil, and good pastures. These factors have led to the variation of population densities between and within the districts.
The population of Mbeya region grew from the 776,373 in 1967 census to 1,080,241 in the 1978 census; reflecting an annual growth rate of 3.3% compared with an average of 3.4% p.a. between 1957 and 1967 population census. The population continued to grow and by 1988 population census it had reached 1,476,199 people. This was about 6 percent of the total Tanzania Mainlands population, Making Mbeya region one of the most populous regions after Shinyanga and Mwanza. It also makes Mbeya one of the regions with high population growth rates. The 1988 population census revealed a population growth rate of 3.1 percent. Based on 1978-88 annual average growth rate of 3.1 percent, the population of the region is estimated to be 2.2 million people in the year 2000.
Table IV: POPULATION GROWTH AND 1978-88 GROWTH RATES, BYDISTRICT
District 1978 Census 1988 Population CensusGrowth Rates Annual Male Female Total
Chunya 89,119 85,214 79,340 164,554 3.1% Ileje 71,228 41,664 46,772 88,436 3.1% Kyela 114,553 64,105 71,540 135,645 3.1% Mbeya (R) 256,472 160,34 7 172,083 332,430 3.1% (Mbarali) (114,640) (75,465 ) (77,465) (152,882 ) 3.1% Mbeya (U) 78,111 74,259 78,585 152,844 3.1% Mbozi 235,444 157,32 5 172,957 330,282 3.1% Rungwe 235,314 129,84 6 142,162 272,008 3.1%
Total 1,080,241 712,76 0 763,439 1,476,19 9 3.1%
Source: Planning Commission: Compiled Data based on 1988 Population Census.
Fig. 7: Population Growth by Sex and District, 1988 Census
0 50 100 150 200 Male Female
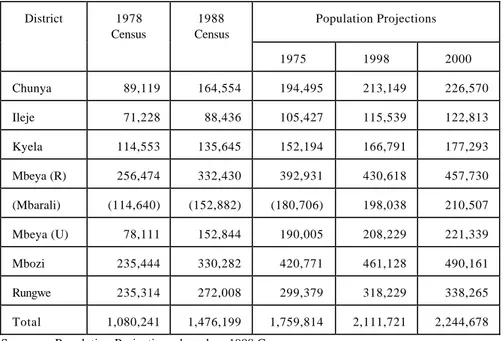
Table V: POPULATION TREND AND PROJECTIONS BASED ON 3.1 PERCENT GROWTH RATE
District 1978 Census 1988 Census Population Projections 1975 1998 2000 Chunya 89,119 164,554 194,495 213,149 226,570 Ileje 71,228 88,436 105,427 115,539 122,813 Kyela 114,553 135,645 152,194 166,791 177,293 Mbeya (R) 256,474 332,430 392,931 430,618 457,730 (Mbarali) (114,640) (152,882) (180,706) 198,038 210,507 Mbeya (U) 78,111 152,844 190,005 208,229 221,339 Mbozi 235,444 330,282 420,771 461,128 490,161 Rungwe 235,314 272,008 299,379 318,229 338,265 Total 1,080,241 1,476,199 1,759,814 2,111,721 2,244,678 Source: Population Projections, based on 1988 Cesnus.
Fig. 8: Population Trend (Thousands) by District 1978 and 1988 Census 0 50 100 150 200 250 300 350 Chunya Ileje Kyela Mbeya (R) (Mbarali)
Mbeya (U) Mbozi Rungwe
1 9 7 8 C e n s u s
Fig. 9: Population Projections 1975, 1988 and 2000 by Distrcit in Mbeya Region 0 50 100 150 200 250 300 350 400 450 500 Chunya Ileje Kyela Mbeya (R) (Mbarali)
Mbeya (U) Mbozi Rungwe
Thousands
1975 1998 2000
According to Table V, the population of Mbeya increased by 37 percent between 1978 and 1988 population census. It is further observed that there are more people in Mbeya Rural, Mbozi and Rungwe than other rural districts. Ileje is the only rural district with the least number of people. Compared with a population of 776,373 people in 1967, the projected population for the year 2000 will almost tripple.
Population growth rate in Mbeya region seems to be too high, a situation which is not healthy especially in terms of efficient use of resources and their sustainability.
Table VI: POPULATION BY RURAL/URBAN AND SEX - 1988
District R u r a l U r b a n
Male Female Total Male Female Total
Chunya 49,502 49,266 98,768 - - Ileje 34,449 38,759 73,208 - - Kyela 51,784 57,777 109,561 - - Mbeya (R) 100,625 109,677 210,302 - - (Mbarali) (34,779) 935,631) (70,410) - - Mbeya (U) 139,745 153,763 293,507 8,043 9,187 7,230 Mbozi 140,309 154,009 294,318 - - Rungwe 110,561 121,177 231,738 5,507 6,039 11,546 Total 626,975 684,428 1,311,40 3 13,550 15,226 8,776
Source: 1988 Population Census.
Population Density and Distribution:
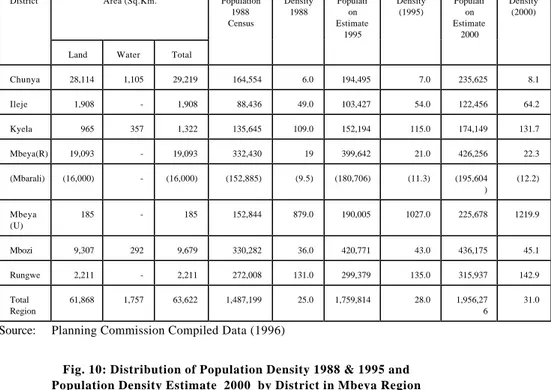
Comparing with other regions in Tanzania Mainland, the population of Mbeya region is the 3rd highest after Shinyanga and Mwanza, while in terms of population density, the region ranks tenth with 25 persons per square kms. (1988 Census). According to the projections in Table IV, Population densities could be 28 and 31 persons in 1995 and 2000 respectively. It is also observed from the same table that population
Table VII: POPULAITION DENSITY AND DISTRIBUTION BY DISTRICT IN MBEYA REGION
District Area (Sq.Km. Population 1988 Census Density 1988 Populati on Estimate 1995 Density (1995) Populati on Estimate 2000 Density (2000)
Land Water Total
Chunya 28,114 1,105 29,219 164,554 6.0 194,495 7.0 235,625 8.1 Ileje 1,908 - 1,908 88,436 49.0 103,427 54.0 122,456 64.2 Kyela 965 357 1,322 135,645 109.0 152,194 115.0 174,149 131.7 Mbeya(R) 19,093 - 19,093 332,430 19 399,642 21.0 426,256 22.3 (Mbarali) (16,000) - (16,000) (152,885) (9.5) (180,706) (11.3) (195,604 ) (12.2) Mbeya (U) 185 - 185 152,844 879.0 190,005 1027.0 225,678 1219.9 Mbozi 9,307 292 9,679 330,282 36.0 420,771 43.0 436,175 45.1 Rungwe 2,211 - 2,211 272,008 131.0 299,379 135.0 315,937 142.9 Total Region 61,868 1,757 63,622 1,487,199 25.0 1,759,814 28.0 1,956,27 6 31.0
Source: Planning Commission Compiled Data (1996)
Fig. 10: Distribution of Population Density 1988 & 1995 and Population Density Estimate 2000 by District in Mbeya Region
0 200 400 600 800 1000 1200 1400 Density 1988 Density (1995) Density (2000)
densities are high in the rural districts of Rungwe, Kyela, Ileje and Mbozi. Population densities are lowest in Mbeya rural and Chunya. Low population densities may be caused by rampant environmental
degradation especially in Chunya. Unproductive land attracts less human activities and hence discourages further human settlement, a situation which may have prevailed in Chunya District.
Table VIII: POPULATION DENSITY AND DISTRIBUTION BY REGION - 1988
CENSUS
Region (Mainland) Land Area
(Kms2) Population Population Density Dar es Salaam 1,393 1,360,850 976.9 Mwanza 19,683 1,876,776 95.8 Kilimanjaro 13,309 1,108,699 83.7 Mtwara 16,710 887,583 53.2 Tanga 26,677 1,280,262 48.1 Kagera 28,456 1,313,639 46.6 Mara 21,760 952,616 43.7 Shinyanga 50,760 1,763,960 34.9 Dodoma 41,311 1,235,277 30.0 Mbeya 63,622 1,487,199 25.4 Kigoma 37,040 853,263 23.1 Iringa 56,850 1,193,074 21.3 Arusha 82,098 1,352,225 16.5 Rukwa 68,635 704,050 10.1 Lindi 66,040 642,364 9.8 Tabora 76,151 1,036,293 14.0 Pwani 32,407 638,015 20.0 Singida 49,341 791,814 16.0 Morogoro 70,799 1,222,737 17.0 Ruvuma 66,477 583,327 12.0 Total Tanzania 885,987 23,174,443 26.1
Source: 1988 Population Census.
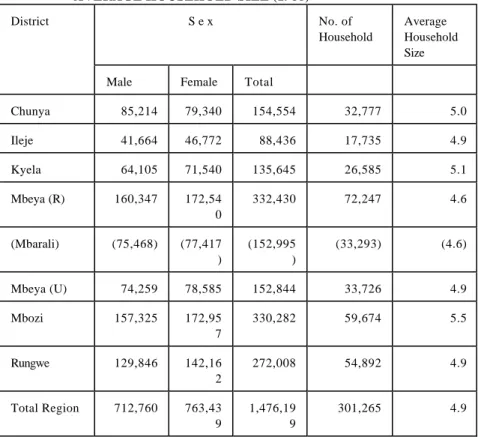
It is observed from Table IX that the 1988 population census recorded average household size of 4.9 persons - lower than the national average of
5.2 persons. Mbozi District had the highest average household size, followed by Kyela and Chunya.
Table IX: POPULATION DISTRIBUTION BY DISTRICT, SEX AND AVERAGE HOUSEHOLD SIZE (1988)
District S e x No. of
Household
Average Household Size
Male Female Total
Chunya 85,214 79,340 154,554 32,777 5.0 Ileje 41,664 46,772 88,436 17,735 4.9 Kyela 64,105 71,540 135,645 26,585 5.1 Mbeya (R) 160,347 172,54 0 332,430 72,247 4.6 (Mbarali) (75,468) (77,417 ) (152,995 ) (33,293) (4.6) Mbeya (U) 74,259 78,585 152,844 33,726 4.9 Mbozi 157,325 172,95 7 330,282 59,674 5.5 Rungwe 129,846 142,16 2 272,008 54,892 4.9 Total Region 712,760 763,43 9 1,476,19 9 301,265 4.9
Fig. 11: Population Distribution by District and Sex in Mbeya Region, 1988 Population Census
0 20 40 60 80 100 120 140 160 180 Chunya Ileje Kyela Mbeya (R) (Mbarali)
Mbeya (U) Mbozi Rungwe
Male Female
It is observed from Table X below that the average household size in Mbeya region in relative terms was lower than the average household size in many regions including Kilimanjaro, Arusha, Tanga, Mwanza and Mara. Table X: POPULATION DENSITY AND HOUSEHOLD SIZE BY
REGION FOR 1967, 1978 AND 1988 CENSUS
Region Land Area (Sq.Kms. )
Population Density Household Average Size
1967 1978 198 8 1967 1978 1988 Dodoma 41,311 17 24 30 4.4 4.7 5.0 Arusha 82,306 7 11 16 4.8 5.3 5.4 Kilimanjaro 13,309 49 68 83 5.0 5.3 5.4 Tanga 26,808 29 39 48 3.8 4.7 5.1 Morogoro 70,799 10 13 17 4.2 4.7 5.3 Coast 32,407 13 16 20 4.0 4.3 4.9
D'Salaam 1,393 256 605 977 - 4.1 4.3 Lindi 66,046 6 8 10 3.7 4.4 4.6 Mtwara 16,707 37 46 53 3.8 4.3 4.4 Ruvuma 63,498 6 9 12 4.0 5.2 5.3 Iringa 56,864 12 16 21 4.5 4.5 4.8 Mbeya 63,617 12 18 25 4.8 5.0 4.9 Singida 49,341 9 12 16 4.1 4.6 5.3 Tabora 76,151 7 11 14 4.5 5.0 5.7 Rukwa 68,635 4 7 10 4.7 5.1 5.3 Kigoma 37,037 13 18 23 4.5 5.5 5.8 Shinyanga 50,781 18 26 35 5.7 5.8 6.3 Kagera 28,388 23 36 47 3.9 4.5 4.9 Mwanza 19,592 54 74 96 5.7 6.0 6.4 Mara 19,566 28 37 50 6.0 6.2 6.7 Average mainland 881,289 14 19 26 4.5 4.9 5.3
Source: Population Census Report (1988)
Table XI: PERCENTAGE DISTRIBUTION OF POPULATION BY SEX AND AGE GROUPS: 1988 CENSUS IN MBEYA REGION
Age groups (years of Rural age)
Rural Urban Total
Male Female Total Male Female Total Male Female Total 0-4 100223 101432 201655 19931 20551 40482 120154 121983 242137 5-19 243001 0 246350 489360 45609 53690 102299 288619 300040 591659 20-39 135225 167726 302951 44066 45779 86845 179291 213505 389796 40-64 73788 90767 164555 15935 14446 30381 89323 105213 194936 65-79 19711 16783 36494 1962 2193 4158 21673 18976 40649
80-Over 6682 8665 121036 2 752 1002 1754 7434 9667 17101 Total 578639 631723 121036 2 128255 137661 265916 706894 7693874 1476278
Source: Population Census Regional Profile - Mbeya, 1998
Fig. 12: Percentage Distribution of Population (Rural) by Age Groups and Sex, 1988 Census in Mbeya Region
0 500 1000 1500 2000 2500 0-4 5-19 20-39 40-64 65-79 80-Over Male Female
Fig. 13: Percentage Distribution of Population (Urban) by Age Groups and Sex, 1988 Census in Mbeya Region
0 10 20 30 40 50 60 0-4 5-19 20-39 40-64 65-79 80-Over Male Female
The economic - able group 15-64 years constitute 50.68 percent of the population, while the dependent group (0-4, 5-14 and 65 + above) constitute the remaining 49.32 percent. It implies that the number of the dependent group is almost the same as the number of the economically supporting group (15-64). When the number of dependants is equal or more than the number of the supporting group there may be a problem of providing adequate support to the needy ones. The point here is that more children or old people create huge demands on the economy that sometimes may not be feasible or affordable.
Migration:
Migration is a movement of people in or out of the region and/or village. Thus, migration falls under two main categories namely, permanent and short-term.
Permanet:
It is a situation, where people move from rural to rural or rural to urban or vice versa in order to obtain more of better place to live/stay or simply to do business. This type of migration is common among agriculturists and livestock keepers especially the Nyakyusa, Masai, Sukuma, Gogo and Safwa people.
Short-Term
This type of migration is common, in Chunya district especially among the tobacco growers and rice growers in the Usangu Plains. Usually, the farmers do come to their original residence after harvest. This type migration is also commonly experienced in areas with limited growth potential like most areas of Chunya district, around Lake Rukwa and South-West of Mbozi.
Employment:
Several studies conducted have revealed that about 80 percent of the population in Mbeya engage in Agriculture. Most of them have an average of 2.5 acres of intercroping and/or monocroping land. People living near Lake Nyasa and Rukwa engage also in fishing activities, whereas those living in forested areas like Chunya are involved in beekeeping. Besides, Mbeya people do keep cattle, goats, sheep and pigs, alhthough in small quantities. The number of livestock is limited due to frequent expansion of crop land area, a situation which has tended to diminish the size of pastures. Other enterprises engaging the people of Mbeya include public and private service, industries and other petty activities.
Climate, Vegetation on Soils:
The climate of Mbeya Region is greatly influenced by physiology and altitude. The climate is generally tropical with marked sessional and attitudinal temperatures and high rainfall variations causing dry and rainy seasons. Temperature ranges between 16oC in the highlands and 25oC in the lowlands areas.
Rainfall:
The region enjoys abundant and reliable rainfall. Annual rainfall varies between 650mm. in Usangu Plains and Chunya to 2600mm. on the Northern shores of Lake Nyasa in Kyela District and highlands of Rungwe and the Southern parts of Ileje District. The rains normally start in October and go through to May with dry and cold spell between June and September. The crop growing season, in most parts of the region begin in November and continues to May.
Soils and Vegetation:
In most arable areas, soils are commonly of moderate fertility, caurse or medium textured and varying from sandy loams, alluvial solids to cracking rocks.
Although a large area of the region is cultivated, large tracks of land are still covered with natural vegetation such as "Miombo" (Broschystegion,Julbernardia) woodland. Areas with rains between 800-1200 mm. per annum favour the growth of Miombo woodland, while areas with less rains especially in the North of the region support the growth of wooded grassland and bushlands of dense thickets - of acacias and thorny trees. Those areas with higher rainfall e.g. Rungwe, Kyela and South - East Ileje support forests, often evergreen and bamboo trickers - except at the highest elevations, where afro-alpine grasslands occur.
Agro-Economic Zones:
The region is divided into 3 main Agro-economic Zones, as shown below: High Potential
Zones:-It includes areas with high rainfall and fertile soils, with a lot of agricultural production. These are the density populated areas i..e. South Usangu Plains, Central Mbeya Plain, Poroto and Ilembo Highlands, East Ileje, West Rungwe Plain, East and Central Rungwe, South Rungwe/North Kyela, and the South Kyela. Lowlands.
Medium Potential
Zones:-Areas that fall under Medium Zone do experience moderate rainfall and they include Rukwa Valley, Mbozi/Ileje Plateau, and North Usangu Plain. Low Potential
Zones:-It includes Central Chunya areas and Msangaji Plateua. Usually rainfalls are unreliable and soils are less fertile.
Highalands Zone
The Highlands zone lies at an altitude of 1,500 to 2,400 metres above sea level and covers the areas of Central Mbeya Plain, Mbeya Highlands, Ilembo and Poroto Highlands East Ileje and West Rungwe Plain, East and Central Rungwe, South Usangu Plain and North Kyela and Southern parts of Rungwe. The Highlands have cool temperatures and receive rainfall exceeding 2,500 millimenters per year.
Crops cultivated include, maize, groundnuts, beans, wheat, potatoes, coffee, bananas, tea, cocoa. Dairy farming is common.
Midlands Zone:
The Midlands zone lies at an altitude of 800 to 1500 meters above sea level and embraces the areas of Rukwa Valley, Mbozi/Ileje Plateau, Southwest of Mbozi, and North Usangu Plain. Rainfalls is highly variable and increases with increasing altitude, ranging from less than 700 mm. per year at North Usangu Plain to 1,700 mm. per year at the Mbozi/Ileje Plateau.
In the Midland zone people prefer cultivating maize, sorghum, finger millet, cotton, cowpeas, groundnuts, cassava, beans and some paddy. Cattle and goats are also common animals in the zone.
Lowlands Zone:
The Lowlands zone lies at an altitude of 500 metres to 1000 metres above sea level occupying mainly the areas of North Chunya Plain, Central Chunya and Msangaji Plateau and Kyela Lowlands. Temperatures are warm with annual rainfall of less than 1000 mm. However, the Kyela Lowlands sometimes get rainfall as high as 2500mm. per year. Several crops thrive well in the Lowlands zone, for instance, tobacco, maize, sorghum, finger millet, cassava, groundnuts, cocoa, cashewnuts, palm oil, paddy and bananas. Cattle, goats and sheep are reared as well.
1.1.4 Topography:
The major topographic features of Mbeya region are:
(a) The Low elevation of the Western Rift Zone - covers lake Rukwa and Nyasa;
(b) The Eastern Rift Zone - covers the Usangu Plains and the neighbouring parts of the Ruaha Trough;
The lowlands within the Rift Valley lie between 500m. and 1400 metres above sea level (m.a.s.1);
Drainage System:
There are three main drainage basins whithin the region. The Ruaha - Rufiji basin extending towards the East; the inland Lake Rukwa basin in the North - West; and the Lake Nyasa basin in the South. Thus the surface runoff pattern corresponds closely to the unimodal rainfall distribution. The South Highlands on the Southern Plateau of Tanzania, form a watershed area of the main rivers draining the region. Main rivers include the Great Ruaha - fed by Kimani, Chimala, Igurusi etc. Tributaries, is one of the great inlet of Indian Ocean. Rivers Zira and Songwe form the inland drainage into Lake Rukwa, while those of Kiwira, Lufilyo, Mmbaka and Songwe drain South wards into Lake Nyasa, which serves as the main reservoir for Malawi; and finally towards Indian Ocean - through Shire and Zambezi Rivers.
SECTION II
2.0 THE REGIONAL ECONOMY:
2.1 INTRODUCTION
The economy of Mbeya region, like that of other regions in the country mainly depends on subsistence agriculture. About 80 percent of Mbeya population depend on agriculture, and the rest of the people depend on livestock-keeping, fishing, small-scale industrial activities, shop-keeping, minor mining and other petty business. It is also reported that over 40 percent of the Regional Gross Domestic Product (RGDP) is derived from the Agriculture.
THE GDP AND PER CAPITA INCOME
The Gross Domestic Product (GDP) of Mbeya region was T.shs.105 billion in 1993 and making a contribution of 5.7 percent to the National GDP. Unexpectedly, in 1994, the GDP dropped slightly to 103 billion in 1994. It is said that a drop in GDP in 1994 was mainly caused by a fall in crop production, industrial output and mining. Nevertheless, the GDP picked up again in 1995 to register T.shs.109 billion, which raised the level of average per capita income to T.shs.61,932 per annum from only 48,737/= in 1994.
Table XII compares both Mbeya's GDP and per capita GDP with the one other three Maize Surplus Producer Regions, commonly known as the "Big Four".
Table XIII: REGIONAL GDPs AND PER CAPITA GDP FOR THE "BIG FOUR" REGIONS (IRINGA, MBEYA, RUKWA AND RUVUMA) IN
MILLION, T.SHS. (AT CURRENT PRICES)
Year Iringa Mbeya Ruvuma Rukwa
GDP Per Capita GDP GDP Per Capita GDP GDP Per Capita GDP GDP Per Capita GDP 1985 5,801 5,204 7,904 5,911 3,329 4,691 2,751 4,534 1986 7,773 6,789 10,36 2 7,517 3,886 5,296 3,886 6,141 1987 11,04 0 9,390 8,074 5,681 9,163 12,077 6,425 9,733 1988 20,51 5 17,01 0 14,54 2 9,874 17,21 0 22,023 12,10 3 17,45 7 1989 32,66 7 26,33 9 23,48 5 15,507 27,41 2 34,109 19,27 3 27,03 1 1990 35,89 7 28,14 4 32,97 8 21,174 18,06 3 21,856 24,34 6 33,20 3 1991 45,66 3 34,81 2 42,24 3 26,374 22,90 9 26,954 31,72 1 42,06 7 1992 56,69 4 42,02 8 52,19 1 31,685 29,56 7 33,828 39,93 3 51,49 5 1993 71,66 4 51,65 9 65,90 1 38,904 38,63 8 42,985 51,63 1 64,74 2 1994 92,02 1 64,50 2 84,90 3 48,737 48,56 5 52,537 66,16 0 80,66 9 Source: Planning Commission Compiled data based on National Accounts of Tanzania 1976-1994
Eleventh edition, August 1995
Fig. 14: Regional GDPs & Per Capita GDP for the "Big Four" Regions "Mbeya Region" in Thousands Million T.Shs. at
Current Prices, 1985 - 1994 0 10 20 30 40 50 60 70 80 90 1 9 8 5 1 9 8 6 1 9 8 7 1 9 8 8 1 9 8 9 1 9 9 0 1 9 9 1 1 9 9 2 1 9 9 3 1 9 9 4 G D P P e r C a p i t a G D P
Fi. 15: Regional GDPs & Per Capita GDP for the "Big Four" Regions "Iringa Region" in Thousands Million, T.Shs. at Current
Prices, 1985 - 1994 0 10 20 30 40 50 60 70 80 90 100 1 9 8 5 1 9 8 6 1 9 8 7 1 9 8 8 1 9 8 9 1 9 9 0 1 9 9 1 1 9 9 2 1 9 9 3 1 9 9 4 G D P P e r C a p i t a G D P
Fig. 16: Regional GDPs & Per Capita GDP for the "Big Four" Regions "Ruvuma Region" in Thousands Million T.Shs. at
Current Prices, 1985 - 1994 0 10 20 30 40 50 60 1 9 8 5 1 9 8 6 1 9 8 7 1 9 8 8 1 9 8 9 1 9 9 0 1 9 9 1 1 9 9 2 1 9 9 3 1 9 9 4 G D P P e r C a p i t a G D P
Fig. 17: Regional GDPs & Per Capita GDP for the "Big Four" Regions "Rukwa Region" in Thousands Million T.Shs. at
Current Prices, 1985 - 1994 0 10 20 30 40 50 60 70 80 90 1 9 8 5 1 9 8 6 1 9 8 7 1 9 8 8 1 9 8 9 1 9 9 0 1 9 9 1 1 9 9 2 1 9 9 3 1 9 9 4 G D P P e r C a p i t a G D P
Fig. 18: A Trend for Per Capita GDP in Thousands Million T.Shs. at Current Prices, Mbeya Region from
1985 - 1994 0 5 10 15 20 25 30 35 40 45 50 1 9 8 5 1 9 8 6 1 9 8 7 1 9 8 8 1 9 8 9 1 9 9 0 1 9 9 1 1 9 9 2 1 9 9 3 1 9 9 4
From Table XII, Mbeya Region seems to have the smallest per capita income compared with other Big Four Regions. Iringa had 64,502/=, Ruvuma 52,537/= and Rukwa had 80,669/=. The relative low level of the per capita income in Mbeya can be explained by differences in populations. The population of Mbeya in 1988 was much higher than that of the other regions.
Table XIII: THE GDP AND PER CAPITA GDP OF MBEYA REGION AT CURRENT PRICES AND PERCENTAGE CHANGE 1980-1994
Year GDP at Prices Tshs. (Millions) Current % Change
Per Capita GDP at Current Prices
T.shs. Exchange Rate T.shs./Dollars U.S.A. Dollars % Change (in Dollars) 1980 2,110 1,838 8.22 224 1981 2,855 35 2,412 8.35 289 29 1982 3,737 30 3,055 9.52 321 11 1983 4,122 10.6 3,277 12.44 263 -18 1984 5,755 40 4,437 18.16 244 -7 1985 7,904 37 5,911 16.50 358 46 1986 10,362 32 7,517 51,70 145 -59 1987 8,074 -22 5,681 83.70 68 -53 1988 14,542 80 9,874 125.00 79 16 1989 23,485 61 15,507 192,00 81 2 1990 32,978 40 21,174 197.00 107 32 1991 42,243 28 26,374 234.00 113 6 1992 52,191 23 31,685 335.00 95 -16 1993 65,901 26 38,904 480.00 81 -15 1994 84,903 29 48,737 553.00 88 9
Source: Planning Commission, Compiled data based or National Accounts of Tanzania, 1997-94 Eleventh Edition, August, 1995.
Table XIII above further highlights the trend in GDP and per capital GDP growth of Mbeya region in the last 15 years (1980-1994). According to Table XIII, the per capaita GDP of Mbeya region at current prices increased in absolute terms from T.shs. 1,838/= in 1980 to T.shs. 48,7737/= in 1994. But this increase is simply nominal as the purchasing power of a shilling fell drastically in dollar terms from US $.224 in 1980 to only US $.88 in 1994. A drop in GDP per head implies that the average living standards of the Mbeya people worsened in 1994. It also means that Mbeya people in 1994 bought fewer goods than they bought in 1980 with a shilling. With regards to the GDP, it is observed from the table that between 1980 and 1988, the growth was very slow and sometimes even dropped (1977). The region experienced significant GDP growth from 1989 and by 1994 it had gone up by 261 percent.
Fig. 19: Contribution(%) of Mbeya Region in Average Annual GDP to the Total National GDP Contribution(%) (1980 - 1994)
Mbeya 6%
Total 94%
Table XIX: AVERAGE ANNUAL REGIONAL GDP CONTRIBUTION TO NATIONAL GDP (1980-1994)-MAINLAND
Regions Average Annual GDP Contribution (%) GDP Contribution Ranking Dar es Salaam 20.33 1 Arusha 7.80 2 Mwanza 7.67 3 Mbeya 6.00 4 Shinyanga 5.80 5 Iringa 5.53 6 Tanga 5.52 7 Morogoro 4.67 8 Kagera 4.60 9 Kilimanjaro 3.67 10 Mara 3.47 11 Tabora 3.40 12 Ruvuma 3.33 13 Ruvuma 3.27 14 Rukwa 3.13 15 Dodoma 3.07 16 Singida 2.87 17 Kigoma 2.53 18 Lindi 2.00 19 Coast 1.00 20
Total 100.00 -
Source: Mbeya Regional Data Bank, 1996.
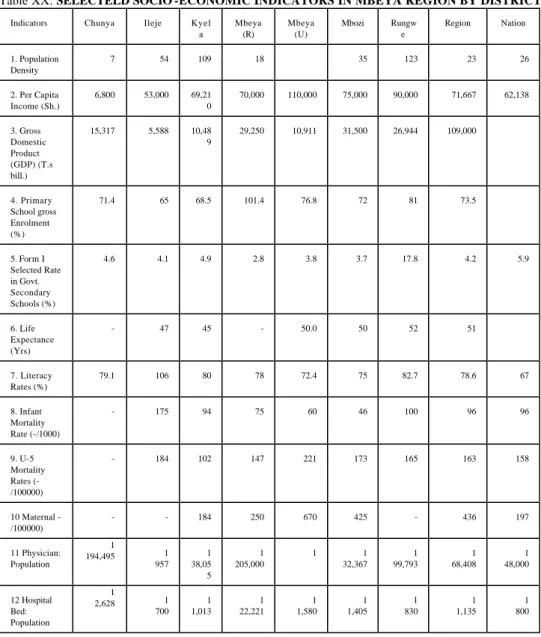
Table XX: SELECTELD SOCIO -ECONOMIC INDICATORS IN MBEYA REGION BY DISTRICTS 1995
Indicators Chunya Ileje Kyel a Mbeya (R) Mbeya (U) Mbozi Rungw e Region Nation 1. Population Density 7 54 109 18 35 123 23 26 2. Per Capita Income (Sh.) 6,800 53,000 69,21 0 70,000 110,000 75,000 90,000 71,667 62,138 3. Gross Domestic Product (GDP) (T.s bill.) 15,317 5,588 10,48 9 29,250 10,911 31,500 26,944 109,000 4. Primary School gross Enrolment (%) 71.4 65 68.5 101.4 76.8 72 81 73.5 5. Form I Selected Rate in Govt. Secondary Schools (%) 4.6 4.1 4.9 2.8 3.8 3.7 17.8 4.2 5.9 6. Life Expectance (Yrs) - 47 45 - 50.0 50 52 51 7. Literacy Rates (%) 79.1 106 80 78 72.4 75 82.7 78.6 67 8. Infant Mortality Rate (-/1000) - 175 94 75 60 46 100 96 96 9. U-5 Mortality Rates (-/100000) - 184 102 147 221 173 165 163 158 10 Maternal -/100000) - - 184 250 670 425 - 436 197 11 Physician: Population 1 194,495 1 957 1 38,05 5 1 205,000 1 1 32,367 1 99,793 1 68,408 1 48,000 12 Hospital Bed: Population 1 2,628 1 700 1 1,013 1 22,221 1 1,580 1 1,405 1 830 1 1,135 1 800
Source: Planning Commission Compiled Data based on Mbeya District Profiles
Chunya
Ileje
Kyela Mbeya (R) Mbeya (U) Mbozi
Rungwe 0 20 40 60 80 100 120 140 Chunya Ileje
Kyela Mbeya (R) Mbeya (U) Mbozi
Rungwe
Fig. 20: Population Density Indicator in Mbeya Region by District 1995
Chunya
Ileje
Kyela Mbeya (R) Mbeya (U) Mbozi
Rungwe 0 20,000 40,000 60,000 80,000 100,000 120,000 Chunya Ileje
Kyela Mbeya (R) Mbeya (U) Mbozi
Rungwe
Fig. 21: Per Capita Income (T.Shs.) in Mbeya Region by District 1995
Chunya
Ileje
Kyela Mbeya (R) Mbeya (U) Mbozi
Rungwe 0 5,000 10,000 15,000 20,000 25,000 30,000 35,000 Chunya Ileje
Kyela Mbeya (R) Mbeya (U) Mbozi
Rungwe
Fig. 22: GDP (Bill T.Shs.) in Mbeya Region by District, 1995
Chunya
Ileje
Kyela Mbeya (R) Mbeya (U) Mbozi
Rungwe 0 20 40 60 80 100 120 Chunya Ileje
Kyela Mbeya (R) Mbeya (U) Mbozi
Rungwe
Fig. 23: Distribution of Primary School Gross Enrolement (%) in Mbeya Region by District, 1995
Chunya
Ileje
Kyela Mbeya (R) Mbeya (U) Mbozi
Rungwe 0 2 4 6 8 10 12 14 16 18 Chunya Ileje
Kyela Mbeya (R) Mbeya (U) Mbozi
Rungwe
Fig. 24: Form I Selected Rate in Government Secondary Schools (%) in Mbeya Region by District, 1995
Chunya
Ileje
Kyela Mbeya (R) Mbeya (U) Mbozi
Rungwe 0 10 20 30 40 50 60 Chunya Ileje
Kyela Mbeya (R) Mbeya (U) Mbozi
Rungwe
Chunya
Ileje
Kyela Mbeya (R) Mbeya (U) Mbozi
Rungwe 0 20 40 60 80 100 120 Chunya Ileje
Kyela Mbeya (R) Mbeya (U) Mbozi
Rungwe
Fig. 26: Literacy Rates (%) by District, Mbeya Region, 1995
Chunya
Ileje
Kyela Mbeya (R) Mbeya (U) Mbozi
Rungw e 0 50 100 150 200 Chunya Ileje
Kyela Mbeya (R) Mbeya (U) Mbozi
Rungw
e
Fig. 27: Infant Mortality Rate (-/1000) by District, Mbeya Region, 1995
Chunya
Ileje
Kyela Mbeya (R) Mbeya (U) Mbozi
Rungwe 0 50 100 150 200 250 Chunya Ileje
Kyela Mbeya (R) Mbeya (U) Mbozi
Rungwe
Fig. 28: U-5 Mortality Rates (-/100000) by District in Mbeya Region, 1995
Chunya
Ileje
Kyela Mbeya (R) Mbeya (U) Mbozi
Rungwe 0 100 200 300 400 500 600 700 Chunya Ileje
Kyela Mbeya (R) Mbeya (U) Mbozi
Rungwe
Fig. 29: Maternal (-/100000) Indicator by District in Mbeya Region, 1995
2.3 PRODUCTIVE SECTORS 2.3.1 Agriculture:
Mbeya region is one of the main food surplus regions in Tanzania. The region has an area of 6,362,200 Ha. of which 3,960,000 Ha. are suitable for agriculture and livestock keeping. However, only an average of 1,3000,000 Ha. are cultivated annually for both food and cash crops. About 80 percent of the population depends on agriculture for their livelihood. The region also produces surplus food (maize, paddy, potatoes, pulses and green vegetables) to the tune of 350,000 tones a year, which in most cases the region exports to other regions like, Dar es Salaam, Dodoma, Singida and the Lake Regions.
A. FOOD CROPS
1 MAIZE
It is the major staple food in Mbeya region. For the past five years (1990-1995) an average of about 220,000 Ha. of the arable land has been under maize production with an average production of 2.5 tones per Ha. Maize is both a major food staple and the most inportant marketed crop in the region (in volume terms). Therefore, maize is of vital importance to the region and its level of production in the region is also an important determinant of the National Maize surplus. It is possible to cultivate maize in all areas of the region, although in some areas the comparative advantage may be greater than other parts of the region depending on varying climatic conditions. Table XXI highlights major food crops production trend between 1990/91 and 1994/95.
Table XXI: PRODUCTION OF MAJOR FOOD CROPS 1990-91 - 1993/94 (TONS) Year/Crop 1990/9 1 1991/92 1992/93 1993/94 1994/9 5 Maize 434,11 1 451,290 436,000 517,623 572,63 0 Paddy 105,33 0 120,945 108,000 113,430 139,18 5 Sorghum/Millet 37,969 28,404 32,474 10,350 17,300 Wheat 146 330 269 485 570 Beans 13,667 18,432 35,136 30,725 30,909 Peas 445 486 533 315 450 Irish Potatoes 65,374 83,700 89,322 77,711 54,580 Sweet Potatoes 45,445 61,340 100,434 111,736 107,38 0 Cassava 27,866 55,500 48,977 83,802 61,602 Bananas 181,79 8 166,435 197,217 213,617 171,67 8 Graundnuts 9,779 5,655 13,600 14,422 13,604 Fruits 16,828 9,275 76,542 83,560 78,650 Simsim 230 350 898 923 440 Vegetables 29,000 18,640 25,437 83,560 10,685 Total 950,31 2 1,033,819 1,160,842 1,210,889 1,259,6 63
Fig. 30: Production of Major Food Crops (Maize) in Thousands Tons, Mbeya Region 1990/91 - 1994/95
200.0 300.0 400.0 500.0 600.0 90/91 91/92 92/93 93/94 94/95
Fig. 31: Production of Major Food Crops (Paddy) in Thousands Tons, Mbeya Region 1990/91 - 1994/95
0.0 50.0 100.0 150.0 200.0 90/91 91/92 92/93 93/94 94/95
Fig. 32: Production of Major Crops (Sorghum/Millet) in Thousands Tons, Mbeya Region, 1990/91 - 1994/95
0.0 10.0 20.0 30.0 40.0 50.0 90/91 91/92 92/93 93/94 94/95
Fi. 33: Production of Major Crops (Wheat) in Thousands Tons, Mbeya Region 1990/91 - 1994/95
0.0 0.1 0.2 0.3 0.4 0.5 0.6 90/91 91/92 92/93 93/94 94/95
Fi. 34: Production of Major Crops (Beans) in Thousands Tons, Mbeya Region 1990/91 - 1994/95
0.0 5.0 10.0 15.0 20.0 25.0 30.0 35.0 40.0 90/91 91/92 92/93 93/94 94/95
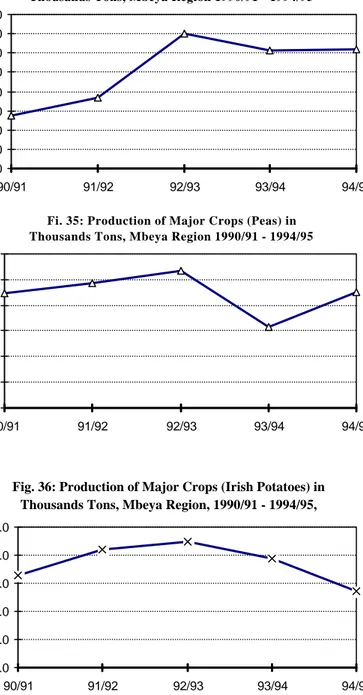
Fi. 35: Production of Major Crops (Peas) in Thousands Tons, Mbeya Region 1990/91 - 1994/95
0.0 0.1 0.2 0.3 0.4 0.5 0.6 90/91 91/92 92/93 93/94 94/95
Fig. 36: Production of Major Crops (Irish Potatoes) in Thousands Tons, Mbeya Region, 1990/91 - 1994/95,
0.0 20.0 40.0 60.0 80.0 100.0 90/91 91/92 92/93 93/94 94/95
Fig. 37: Production of Major Crops (Sweet Potatoes) in Thousands Tons, Mbeya Region, 1990/91 - 1994/95,
0.0 50.0 100.0 150.0
90/91 91/92 92/93 93/94 94/95
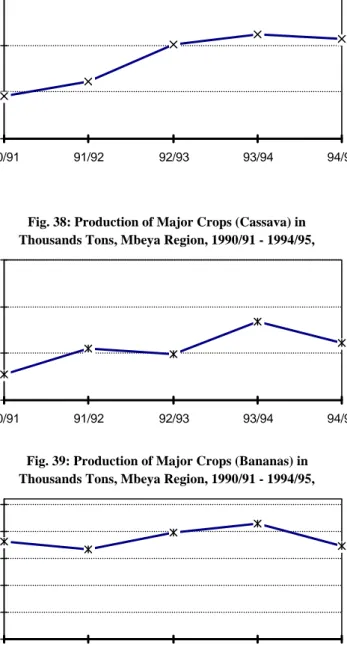
Fig. 38: Production of Major Crops (Cassava) in Thousands Tons, Mbeya Region, 1990/91 - 1994/95,
0.0 50.0 100.0 150.0
90/91 91/92 92/93 93/94 94/95
Fig. 39: Production of Major Crops (Bananas) in Thousands Tons, Mbeya Region, 1990/91 - 1994/95,
0.0 50.0 100.0 150.0 200.0 250.0 90/91 91/92 92/93 93/94 94/95
Fig. 40: Production of Major Crops (Groundnuts) in Thousands Tons, Mbeya Region, 1990/91 - 1994/95,
0.0 5.0 10.0 15.0 20.0 90/91 91/92 92/93 93/94 94/95
Fig. 41: Production of Major Crops (Fruits) in Thousands Tons, Mbeya Region, 1990/91 - 1994/95,
0.0 20.0 40.0 60.0 80.0 100.0 90/91 91/92 92/93 93/94 94/95
Fig. 42: Production of Major Crops (Simsim) in Thousands Tons, Mbeya Region, 1990/91 - 1994/95,
0.0 0.2 0.4 0.6 0.8 1.0 90/91 91/92 92/93 93/94 94/95
Fig. 43: Production of Major Crops (Vegetables) in Thousands Tons, Mbeya Region, 1990/91 - 1994/95,
0.0 20.0 40.0 60.0 80.0 100.0 90/91 91/92 92/93 93/94 94/95 Paddy:
Paddy is the second important cereal crop grown in Mbeya region. An average of 35,000 Ha. are under paddy production, undertaken by both small holders and parastatal organisations. The average yields per Ha. for the past five years (1990/95) has been 3.0 tons. Table XXI shows a fluctuating production trend of paddy between 1990/91 and 1994/95 seasons. For instance, production was 105,330 tons in 1990/91, and in 1991/92 season it went up to 120,945 tons. Production dropped to 108,000 tons in 1992/93 and slowly picked up to 113,430 tons in 1993/94.
Beans:
Beans are important food pulses in Mbeya Region. For the past five years, an average of 30,000 Ha. have been under beans production, with an average yield of about 18,000 tons per annum (approximately 0.6 tons per Ha.) As seen from Table XXI beans production between 1990/91 and 1994/95 increased tremendously from a mere 13,667 tons to 30,909 tons. Nevertheless, production levels are still low especially when productivity stands at 0.6 tons per Ha.
Bananas:
Bananas are permanent food crops in the region, particularly in Kyela, Rungwe, Ileje and Mbeya Rural. An average of 25,000 Ha. are under banana crop in the Region. Production level is at 185,000 tons per annum on the average. According to Table XXI, the Region recorded the highest production level in 1993/94.
Sweet Potatoes:
Sweet potatoes are also very important food crop. About 50,000 tons of patatoes are produced per year in Mbeya Region. Productivity per hectare is still low, only 5 tons per hectare. Irish potatoes are also grown especially in the temperate climate zone.
Oil Seeds:
Oil seeds production in Mbeya region is increasingly becoming important. For the past five years about 8,000 Ha. have been under oil seeds production each year. By the year 2000, oilseeds production is expected to expand to 12,000 Ha.
Food production in Mbeya region has to a large extent been also supplemented by the produce from the state farms as shown in Table XXII.
Table XXII: CROP PRODUCTION IN PARASTATAL FARMS 1990/91-1994/95 IN MBEYA REGION
Name of Farm
Crop 1990/91 1991/92 1992/93 1993/94 1994/95
Ha. Tons Ha. Tons Ha. Tons Ha. Tons Ha. Tons Kapung a Rice 442 1,840 3,000 10,16 0 3,000 5,885 3,000 6,382 3,000 12,00 0 Mbarali Rice 2,39 2 11,00 2 2,442 8,863 2,506 8,500 2,500 8,750 2,300 10,00 0 Magamb a Maize 502 2,129 715 3,377 501 3,253 700 2,912 700 3,500 Magamb a Wheat 314 550 281 513 303 455 176 211 200 300 Magamb a Beans 14 17 33 22 44 29 31 15.5 50 40 Magamb a Sunfl ower 10 6 62 36 19 6 - - - - Magamb a Coffee 5 1.25 5 3.06 5 2.5 5 4.0 5 4.0 Total 3,67 9 15,54 5 6,538 22,97 4 6,378 18,130 6,412 18,27 4 6,255 25,84 4
Source: Mbeya Region, Data Bank, 1996.
Production of rice in Kapunga State Farm in 1990/91 was 2 percent of the overall rice production in Mbeya region. The percentage share increased to 9 percent in 1994/95 season. While rice production in Mbarali in 1990/91 was 10 percent of the total production in the region. Unlike the Kapunga percentage share which increased in 1994, Mbarali percentage share in rice production fell to only 7.
CASH CROPS:
Mbeya region is one of the most important cash crops producer in Tanzania. The region produces over 12,000 tons of coffee, representing about 21 percent of total National coffee production. It produces also 1,800 tons of pyrethrum, equivalent to 48 percent of the National production. Similarly Mbeya region produces 35 percent of tea produced in the whole country. Tobacco and cotton are also produced to the tune
of 1,000 tons and 6,000 tons respectively yearly. Table XXIII below shows production trend in major cash crops in the region.
Table XXIII: CASH CROPS PRODUCTION TREND IN MBEYA REGION BETWEEN 1990/91 AND 1994/95 (TONS)
Name of Crop 1990/91 1991/9 2 1992/93 1993/9 4 1994/9 5 Coffee 16,996 14,694 13,600 17,954 17,709 Tea-Green Leaves 14,150 14,192 10,200 10,428 10,824 Pyrethrum 4,427 7,220 1,800 2,154 1,776 Cotton 4,725 6,780 7,900 7,800 8,900 Cardamom 43 79 138 120 94 Sunflower 2,794 1,285 11,187 4,059 3,748 Cocoa 3,050 2,430 1,600 4,152 3,816 Tobacco 1,000 1,620 1,620 1,800 1,617
Source: Regional Development Perspective Strategies (1995)
Fig. 44: Cash Crops (Coffee) Production Trend (Tons) in Mbeya Region, 1990/91 - 1994/95
0 5,000 10,000 15,000 20,000 1990/91 1991/92 1992/93 1993/94 1994/95
Fig. 44(a): Cash Crops (Tea-Green Leaves) Production Trend (Tons) in Mbeya Region, 1990/91 -
1994/95 0 4,000 8,000 12,000 16,000 20,000 1990/91 1991/92 1992/93 1993/94 1994/95
Fig. 44(b): Cash Crops (Pyrethrum) Production Trend (Tons) in Mbeya Region, 1990/91 - 1994/95
0 2,000 4,000 6,000 8,000 10,000 1990/91 1991/92 1992/93 1993/94 1994/95
Fig. 44(c): Cash Crops (Cotton) Production Trend (Tons) in Mbeya Region, 1990/91 - 1994/95
0 2,000 4,000 6,000 8,000 10,000 4,725 6,780 7,900 7,800 8,900
Fig. 44(e): Cash Crops (Cardamom) Production Trend in (Tons) in Mbeya Region, 1990/91 - 1994/95
10 30 50 70 90 110 130 150 1990/91 1991/92 1992/93 1993/94 1994/95
Fig. 44 (f): Cash Crops ( Sunflower) Production Trend in Tons, Mbeya Region 1990/91 - 1994/95
0 2,000 4,000 6,000 8,000 10,000 12,000 1990/91 1991/92 1992/93 1993/94 1994/95
Fig. 44 (g): Cash Crops (Cocoa) Production Trend in Tons, Mbeya Region 1990/91 - 1994/95
0 1,000 2,000 3,000 4,000 5,000 1990/91 1991/92 1992/93 1993/94 1994/95
Fig. 44 (h): Cash Crops (Tobacco) Production Trend in Tons, Mbeya Region 1990/91 - 1994/95
0 500 1,000 1,500 2,000 1990/91 1991/92 1992/93 1993/94 1994/95 Coffee:
Coffee is one of the major cash crops grown in Mbeya region especially in Mbeya, Mbozi, Rungwe and Ileje districts. About 4,000 Ha. have been under coffee for the past five years. Average production of 0.4 tons of coffee per Ha. has been the trend compared with maximum yield of 1.0 ton/Ha. while the average annual production has been about 12,000 tons. Productivity per Has. still needs to be improved.
Production levels for coffee have been rising and falling over the years. For instance in 1990/91 season it was 16,996 tons, in 1991/92 it was only 14,694 tons, while in 1993/94 it rose to 17,954 tons, but fell again to 17,709 tons in 1994/95.
Tea:
Tea is among traditional cash crops grown in large scale in Mbeya region. Most of the tea estates are private. About 5,535 Ha. are under tea production, with a yield of 3,500 tons per annum. The average yield per tree has been 0.6 kgs, which appears to be much lower than the standard of 3 kgs per tree. However, some of the Private Tea Estates have
managed to raise productivity to 2.0 kgs per tree. Like other cash crops, the production levels of tea also fluctuates as indicated by Table XXIII. Pyrethrum:
Pyrethrum also thrives well in Mbeya region and it is planted in an area almost covering about 2,500 Ha. of land. It's production however, has continued to decline over the years (1990/91 - 1994/95). Pyrethrum production in Mbeya declined by 60 percent from 4,427 tons in 1990/91 to only 1976 tons in 1994/95.
Cotton:
It is a prominent cash crop grown in Chunya District and some few areas of Mbeya (Madibira). The crop covers an area of 5,500 Ha. with annual average production of 6,000 tons. Table XXIII shows production of cotton in tons between 1990/91 and 1994/95.
Tobacco:
Another cash crop mainly grown in Chunya is tobacco and covers an area of about 1,500 Ha. Tobacco annual produuction is 1,000 tons with an average yield of 0.6 ton/Ha. Production levels have been marginally increasing as shown in Table XXIII between 1990/91 and 1994/95. Cocoa:
Cocoa is increasingly becoming an important cash crop in Kyela and Rungwe Districts. The area under Cocoa has increased from 5,022 Ha. in 1990/91 to 5,790 Ha. in 1994/95. However, production per unit still remains low - at 0.6 ton/ha. Table XXIII highlights production levels of cocoa between 1990/91 and 1994/95.
Irrigation:
Several studies conducted in Mbeya region regarding irrigation schemes by FAO (1961), Commonwealth Secretariat (1978-1980), Government initiative (1979-1980) and RIDEP (1982) concluded their reports by recommending Usangu Plains, Rukwa Basin, Kanga River Basin and Ulambya Plain for irrigation programmes. In Usangu Plains (Mbeya Rural), large and small scale, farms were recommended especially in Mbarali, Kapunga, Kimani and Igurusi.
Table XXIV: IRRIGATION DEVELOPMENT BY DISTRICT IN MBEYA REGION - 1995 District Potential Area (Ha.) Area under Irrigation Ha. Chunya 230,050 - Ileje 800 35 Kyela 12,600 50 Mbeya (R) 130,000 50,000 Mbozi 486 215 Rungwe - - Total 373,936 50,300
Fig. 45: Irrigation Development Potential Areas (Thousands Ha.) by District in Mbeya Region, 1995
0.0 50.0 100.0 150.0 200.0 250.0 C h u n y a Ileje K y e l a M b e y a ( R ) M b o z i R u n g w e
Table XXIV indicates that Mbeya region has high irrigation potential still under exploited. Kyela and Ileje districts have the smallest number of land under irrigation. It has not been very clear why only few hectares are being irrigated in Kyela and Ileje. One reason could be probably high investment costs involved.
FARM IMPLEMENTS:
Hand-hoe is the main tool for peasant farmers in Mbeya region. Oxdrawn ploughs technology is significantly spreading among the people. Mbeya Oxzenization Project (CIDA) has played a good role in training and educating peasant farmers on the use of ploughs and animal drawn implements (ridges, cultivators, carts etc). Table XXV shows the type and number of the agriculture equipments available.
Table XXV: THE NUMBER OF AGRICULTURAL TOOLS IN MBEYA REGION, 1996 Type Available Tools In Use Tractors 262 215 Ploughs 42,389 3,283 Cultivators 253 141 Harrows 129 129 Planters 50 42 Trailers 138 120 Ridges 188 28 Ox-carts 378 292 Hoes Over 56,500 ...
Source: Mbeya Region Date Bank, 1996.
Table XXVI: DISTRIBUTION OF AGRICULTURAL IMPLEMENTS BY DISTRICT, (MBEYA REGION) 1992/93. District Tracto rs Ploug hs Cultivat ors Harro ws
Ox-Carts Ridges Planters Trailer
s Chunya 9 7,208 32 9 160 27 2 4 Ileje 3 1,200 23 8 9 18 - 2 Kyela 24 11,00 0 15 8 25 13 5 24 Mbeya 100 9,104 60 23 43 44 18 57 Mbozi 59 13,70 0 123 62 140 86 24 31 Rungwe 21 177 - 4 1 - 1 15
Total 215 42,38 9
253 114 378 188 50 138
Source: Regional Data Bank 1992
FARM INPUTS:
Input requirements for agriculture in Mbeya region in 1993/94 season were 50,000 tons of fertilizer, 1,317 tons of improved seeds, 6,000,000 litres and 6,500 tons of liquid of different chemicals such as insecticides, herbicides, fungicides and pesticides. The supply of inputs in the region is always less than the actual requirement. Also, distribution system of inputs is inefficient as farmers get them late.
Table XXVII below shows the amount of maize improved seeds, beans supplied in Mbeya region in 1993/94.
Table XXVII: QUANTITY OF IMPROVED SEEDS SUPPLIED, 1994/95
Improved Seeds Quantity Supplied (Tons)
(i) Maize T M V H.632 H.6302 H.614 UAC Katumani Sub-Total Maize (ii) Beans: Kabanima Uyole `84' T 3 Sub - Total beans Total Seeds 60 78 400 120 27 692 325 170 130 625 1,317
Table XXVIII: TREND IN SUPPLY OF INPUTS IN MBEYA REGION, 1990/91-1993/94 (TONS) Type of Input 1990/91 1991/92 1992/93 1993/94 Requi remen t Actua l Suppl y Requi remen t Actua l Suppl y Requi remen t Actua l Suppl y Require ment Actual Supply T S P 9,551 4,415 5,000 6,932 6,850 1,332 7,551 1,565 CAN 28,01 4 11,37 8 9,800 8,758 22,70 0 9,613 10,500 7,500 UREA 7,769 5,667 8,000 7,186 6,950 6,741 7,661 5,147 SA 3,820 2,587 1,000 2,354 5,549 1,310 6,029 1,130 NPK 7,354 3,993 8,200 5,949 7,313 6,181 2,885 2,480 S S P 507 - - 997 - 996 900 852 S O P 209 10 - 188 100 98 900 - DAP - - - 2,783 500 1,567 T O T A L 56,71 7 28,45 7 32,00 0 31,96 4 49,37 2 29,05 5 36,926 20,241
Source: Agriculture and Livestock Development: Annual Report 1990/91 - 1993/94
It is observed from Table XXVIII that in all years under discussion, the input requirements and actual supply are two different things. For instance in 1990/91, actual supply was less by 50 percent, in 1991/92 by 0.1 percent, in 1992/93 by 41 percent and in 1993/94 actual supply of inputs was less by 45 percent.
2.3.5 STORAGE FACILITIES
Post harvest loses are in most cases caused by poor food storage facilities. Poor storage facilities usually render food crops vulnerable to pests, moisture or rodents attack. Table XXIX below highlights the
situation pertaining to storage facilities in Mbeya Region. We would not give exactly the number of traditional granaries employed in each locality.
Table XXIX: STORAGE POSITION IN THE REGION (1995)
District No. of Godowns Capacity Capacity Utilized Usage % Mbeya 26 10,150 8,970 88.4 Mbozi 108 42,120 (Tons) 38,970 92 Chunya 79 62,000 48,980 79 Ileje 23 5,850 3,825 65.4 Rungwe 48 14,400 (Tons) 11,100 77.1 Kyela 18 41,600 25,000 60.1 Total 302 176,120 136,845 77.7
Source: Regional Office, Mbeya
Nevertheless, it was reported that apart from the godowns, there were enough traditional food storage facilities in Mbeya. Thus, there is no shortage problem, the problem may be just the quality of the facilities. It was also reported that most of the godowns are not being utilised fully due to trade liberalisation, whereby traders (crop buyers) take the bought crops to markets immediately after purchase. In this regard, the traders do not see the need to store the crops in the godowns and hence render them useless.
Mbeya region has favorable climatic conditions that permit raising and keeping traditional and exotic cattle. The region has 965,212 (1995) cattle - out of which 960,746 are traditional, and 4,466 exotic. There are 171,529 goats, 101,369 sheep, 67,921 pigs and 1,130,456 chicken (poultry). Distribution of livestock in the region as per 1995 data is shown in Table XXX Mbeya district appears to possess large numbers of livestock followed by Mbozi district and Chunya. Kyela district in general seem to possess just a few livestock compared with other districts. For instance, Kyela has the least number of goats, sheep and in terms of cattle, the district comes second after Ileje district with the fewest number. The problem in Kyela with regards to livestock keeping is the inadequacy of land for livestock rearing.
Table XXX: DISTRIBUTION OF TOTAL LIVESTOCK IN MBEYA REGION BY DISTRICT 1995
District Cattle Sheep Goats Pigs Total
Chunya 135,365 16,711 27,791 3,488 183,355 Ileje 36,081 8,519 15,707 3,158 63,465 Kyela 40,243 1,361 1,909 6,303 49,816 Mbeya 512,526 53,226 80,282 17,006 663,040 Mbozi 188,184 15,313 37,316 19,349 260,162 Rungwe 52,803 6,239 8,524 18,617 86,183 Total 965,212 101,369 171,529 67,921 1,306,031 Source:
Chunya Ileje Kyela Mbeya Mbozi Rungwe 0 100 200 300 400 500 600 Chunya Ileje Kyela Mbeya Mbozi Rungwe
Fig. 46: Distribution of Total Livestock (Cattle) by District in Mbeya Region, 1995
Chunya Ileje Kyela Mbeya Mbozi Rungwe 0 10 20 30 40 50 60 Chunya Ileje Kyela Mbeya Mbozi Rungwe
Fig. 46 (a): Distribution of Total Livestock (Sheep) by District in Mbeya Region, 1995
Chunya Ileje Kyela Mbeya Mbozi Rungwe 0 10 20 30 40 50 60 70 80 90 Chunya Ileje Kyela Mbeya Mbozi Rungwe
Fig. 46 (b): Distribution of Total Livestock (Goats) by District in Mbeya Region, 1995
Chunya Ileje Kyela Mbeya Mbozi Rungwe 0 2 4 6 8 10 12 14 16 18 20 Chunya Ileje Kyela Mbeya Mbozi Rungwe
Fig. 46 (c): Distribution of Total Livestock (Pigs) by District in Mbeya Region, 1995
Compared with the 1984 Livestock Census, which registered 646,522 cattle, 134,671 goats, 94,663 sheep and 6,264 pigs, the 1995 livestock count (Table XXX) indicates a remarkable increase of livestock in each category (cattle, goats, etc.) For instance, the number of cattle increased by 49 percent from 646,522 in 1984 to 965,212 in 1995.
2.4.2 DIARY CATTLE DEVELOPMENT
Cattle are generally important for subsistence, particularly for the provision of meat and milk to enrich diet. In attempt to increase the supply of milk and improve the quality, the Government in collaboration with the Swiss Government launched Small Scale Diary Development Programme (SSDDP), known as the Heifer Project International (HPI). In this programme, FI heifers (calves) and bulls are given to selected farmers to improve the quality of
Table XXXI: DIARY CATTLE DISTRIBUTION IN MBEYA REGION (1990/91 - 1994/95)
Year SSDDP H P I
Incalf Heifers
Bulls Total Heifers Bulls DOE Bulk Total
1990/91 109 21 130 - - - - - 1991/92 80 5 85 19 - - - 19 1992/93 95 9 104 104 10 - - 114 1993/94 100 8 108 30 2 20 2 54 1994/95 66 - 66 86 7 40 4 - Total 450 43 493 239 19 60 6 324
Source: Mbeya Region Perspective Strategy (1995)
their stock and increase milk supply. Extension services are also made available to the farmers through training, advice and field visits. It has been reported that between 1990 and 1995 about 20,171 farmers have had some training. Table XXXI shows the number of diary cattle distributed between 1990/91 and 1994/95. The HPI project has increased milk production from 43,580,000 litres in 1992/93 to 45,960,000 litres in 1994/95.
Table XXXII: ANNUAL REQUIREMENT AND MILK SUPPLY IN MBEYA REGION BY DISTRICT
District Annual Requirement (Lts) Annual Production (Lts) Shortage (Lts) Mbeya 14,876,443 11,766,400 3,110,043 Mbozi 15,123,031 11,900,200 3,222,831 Rungwe 8,338,623 10,300,000 N I L Chunya 5,000,000 1,840,000 3,160,000 Kyela 4,158,293 2,160,000 1,998,293 Ileje 10,089,037 7,993,400 2,095,637
Total 57,587,427 45,960,000 11,627,427
Source: RALD - Annual Report (1995)
According to the data in Table XXXII, only Rungwe District does not face milk shortage. Rungwe has a surplus of 1,961,377 litres of milk. The remaining districts in Mbeya region still need to increase their milk production capacities in order to meet demand.
Table XXXIII: REVENUE AND INCOME FROM LIVESTOCK AND ITS PRODUCTS 1990/91 - 1994/95
YEAR LIVESTOCK SLAUGHTERED LIVESTOCK SOLD IN MARKETS Number (No.) Government Revenue (T.shs.) Income to Farmers (T.shs.) Number (No.) Government Revenue (T.shs.) Income to Farmers (T.shs.) 1990/91 45,526 6,473,600 33,110,000 13,694 686,426 235,635,290 1991/92 49,772 7,050,800 42,048,000 7,446 477,859 154,040,594 1992/93 35,128 8,601,800 68,774,000 13,193 703,265 323,423,678 1993/94 34,906 9,582,150 68,551,000 8,482 516,840 298,152,783 1994/95 34,903 9,657,000 64,872,000 3,684 184,200 135,219,361 Total 200,285 42,365,350 277,355,000 46,499 2,568,590 1,146,471,706 Source:
Fig. 47: Government Revenue (Thousands T.shs.) Collected from Livestock Slaughted 1990/91 - 1994/95, Mbeya Region
0 2,000 4,000 6,000 8,000 10,000 1990/91 1991/92 1992/93 1993/94 1994/95
It is evident from Table XXXIII that people could get a lot of money from livestock. The seventh column clearly shows how much income farmers received from the livestock sold in markets between 1990/91 and 1994/95. It is obvious that if quality of livestock is improved their market value goes up as well.
2.2.5 LIVESTOCK INFRASTRUCTURES:
Mbeya region is said to have 65 dips 24 crushes, 30 slaughter slabs, 15 hides sheds and 6 health centres and clinics, but only 25 percent of them are operating. Most of them require rehabilitation and renovation. The distribution of these infrastructures are in Table XXXIV below:-
Table XXXIV: DISTRIBUTION OF LIVESTOCK INFRASTRUCTURE IN
THE REGION BY DISTRICT, 1995
Types Chuny
a
Ileje Kyela Mbeya Mbozi Rungwe Tota l
Dips 7 1 4 23 32 21 65
Crushers 3 1 4 10 5 6 24 Health Centres/Clinics 5 1 1 2 1 1 11 Hide/Skin Sheds 3 1 1 6 3 2 16 Livestock Market 5 - - 10 3 - 18
Source: Planning Commission - Compiled Data based on District Development Profiles
Mbeya region, in addition to already mentioned livestock facilities it has 18 livestock markets and two holding grounds at Igawa and Mbao.
PROBLEMS FACING LIVESTOCK HUSBANDRY: (1) High prices of drugs, equipment and animal feeds (2) Poor services
(3) Foot and mouth, Anthrax, Trypanosomiasis and East Coast Fever diseases
(4) Tsetse infestation
(5) Less attention given to livestock
2.5 NATURAL RESOURCES:
2.5.1 Introduction:
It is estimated that about 12,595 sq.kms or 19.8 percent of the total land area of the region is covered with forests and about 2,314 sq.kms are covered with forests, while 220 sq.kms belong to artificial forests. The most important types of forests in Mbeya region are three namely, Rain forests, Tropical Savannah and Miombo Woodlands. There are also about 18 Forest Reserves and about 63 Proposed Forest Reserves as shown below:-
Table XXXV: FOREST RESERVES DISTRIBUTION AND CATEGORY IN MBEYA REGION BY DISTRICT
District Name of Forest and Type
Category Area (Ha.) Ownership
Chunya Lukwati (F.R) Lwipa (F.R) Kipembawe (F.R) North Lupa (F.R) Kalongoli (F.R) Mbiwe (P.F.R) Patamela (P.F.R) Sianimpala (P.F.R) Mtainula Hills (P.F.R) Ileme (P.F.R) Zira River (P.F.R) Itengu (P.F.R) Protected " " " " " " Productive " " " " 189514.16 69058.81 3149.79 5052.63 2259.91 49147.70