V
i s u a l i z a t i o nC
o r n e rEditors: Claudio Silva, [email protected] Joel E. Tohline, [email protected]
P r o v e n a n c e f o r V i s u a l i z a t i o n s
Re p r o d u c ib il it y a n d Be y o n d
By Claudio T. Silva, Juliana Freire, and Steven P. Callahan
T h e d e m a n d f o r t h e c o n s tr u c tio n o f c o m p le x v is u a liz a tio n s is g r o w in g in m a n y d is c ip lin e s o f scie n ce , as users a re fa c e d w i t h e v e r in c re a s in g v o lu m e s o f d a ta to a n a ly z e . T h e a u th o r s p re s e n t V isT ra ils, a n o p e n s o u rc e p ro v e n a n c e - m a n a g e m e n t s y s te m t h a t p ro v id e s in fr a s tr u c t u r e f o r d a ta e x p lo r a t io n a n d v is u a liz a tio n .
C om puting has been an enor
mous accelerator for science, leading to an inform ation ex plosion in many different fields. Fu ture scientific advances depend on our ability to comprehend the vast amounts of data currently being produced and acquired. To analyze and understand this data, though, we must assemble complex computational processes and generate insightful visualizations, which often require combining loosely coupled resources, specialized librar ies, and grid and W eb services. Such processes could generate yet more data, adding to the inform ation over flow scientists currently deal with.
Today, the scientific com m unity uses ad hoc approaches to data ex ploration, but such approaches have serious lim itations. In particular, scientists and engineers m ust expend substantial effort m anaging data (such as scripts th a t encode com puta tional tasks, raw data, data products, images, and notes) and recording
provenance inform ation (that is, all the inform ation necessary to reproduce a certain piece of data) so th at they can answer basic questions: W h o cre ated a data product and when? W h en was it modified, and who modified it? W h a t process was used to create the data product? W ere two data products derived from the same raw data? T h is process is n ot only tim e-consum ing, but also error-prone.
W ith o u t provenance, it’s diffi cult (and som etim es impossible) to reproduce and share results, solve problem s collaboratively, validate re sults w ith different input data, and understand the process used to solve a p articu lar problem . In addition, data p roducts’ longevity becomes limited—w ithout precise and suffi cient inform ation about how the data product was generated, its value di m inishes significantly.
T h e lack of adequate provenance support in visualization systems m o tivated us to build VisTrails, an open source provenance-m anagem ent sys tem th at provides infrastructure for data exploration and visualization through workflows. VisTrails tran s parently records detailed provenance of exploratory computational tasks and leverages this inform ation be yond just the ability to reproduce and share results. In particular, it uses this inform ation to simplify the process of exploring data through visualization.
Visualization Systems
V isualization systems such as M aya- Vi (http://mayavi.sourceforge.net) and ParaView (www.paraview.org)—which are built on top of K itw are’s Visual ization Toolkit (V T K )1— as well as SC IR un (http://softw are.sci.utahedu/ scirun.htm l) enable users to interac tively create and m anipulate complex visualizations. Such systems are based
on the notion of data flows,2 and they provide visual interfaces for produc ing visualizations by assembling pipe lines out of modules (or functions) connected in a network. SC IR un supports an interface th at lets users directly edit data flows. MayaVi and ParaView have a different interac tion paradigm th at implicitly builds data flows as the user makes “task- oriented” choices (such as selecting an isosurface value).
A lthough these systems let users create complex visualizations, they lack the ability to support data explo ration at a large scale. N otably, they don’t adequately support collabora tive creation and exploration of m ul tiple visualizations. Because these systems don’t distinguish between the definition of a data flow and its instances, to execute a given data flow w ith different param eters (for example, different input files), users m ust m anually set these param eters th ro u g h a G U I. Clearly, this process doesn’t scale to m ore th an a few vi sualizations at a tim e. Additionally, m odifications to param eters or to a data flow’s definition are destruc tive—the systems don’t m aintain any change history. T h is requires the user to first construct the visualiza tion and th en rem em ber the input data sets, param eter values, and the exact dataflow configuration th a t led to a particular image.
R e p r o d u c i b i l i t y a n d S h a r i n g D a t a a n d P r o c e s s e s f o r t h e V i s u a l i z a t i o n C o r n e r
By Claudio Silva and Joel E. Tohline
reetings! W e're the new co-editors fo r th e Visualiza- V J t i o n Corner. Claudio is a co m p u te r science professor at th e U niversity o f Utah and fa c u lty m em b er of th e Scientific C o m p u tin g and Im aging Institute, w here he does research prim a rily in visualization, graphics, and applied geom etry. Joel is a professor of physics and astronom y at Louisiana State University and a fa c u lty m em b er in LSU's Center fo r C o m p u ta tio n and Technology, w ith a research focus on com plex flu id flow s in astrophysical systems. We b o th have extensive experience in high -perform a nce c o m p u tin g . In partnership w ith o u r readers and colleagues, we hope to b rin g you relevant and effective in fo rm a tio n ab ou t visual ization techniques th a t can d ire c tly affect th e w ay ou r read ers d o science. We w o u ld like to use new W eb technologies (Wikis, blogs, and so on) to encourage the c o m m u n ity to
m ore actively participate in th e way we d o things. This firs t colum n discusses the benefits o f provenance and makes a case th a t b e tte r provenance mechanisms are needed fo r visualization. In upcom ing installm ents, w e'll a tte m p t to in fo rm th e scientific c o m m u n ity at large ab ou t th e benefits and technologies related to provenance. In particular, we w a n t to p ro m ote th e idea o f reproducible visualizations. We encourage authors of articles published here to provide m etadata fo r visualizations in th e ir articles th a t le t readers reproduce images as w ell as generate related ones (for exam ple, using d iffe re n t data). Ultim ately, ou r hope is th a t this tre n d w ill spread to th e p o in t th a t published articles w ill contain n o t on ly textua l descriptions of th e techniques, b u t links to data, code, and th e com plete overall process used to generate th e scientific results.
As a m echanism to capture and share provenance m e ta data, authors can use VisTrails to produce specifications of the figures and plots presented in th e ir articles. W e'll archive this in fo rm a tio n at w w w .v is tra ils .o rg /in d e x .p h p / CiSE. The data and processes associated w ith this colum n are already available on th e W eb site, so you can reproduce the m , rig h t now, fro m y o u r desktop!
Finally, before constructing a vi sualization, users m ust often acquire, generate, or transform a given data set—for example, to calibrate a simu lation, they must obtain data from sen sors, generate data from a simulation, and finally construct and compare the visualizations for both data sets. M ost visualization systems, however, don’t give users adequate support for cre ating complex pipelines that support multiple libraries and services.
VisTrails: Provenance
for Visualization
T h e VisTrails system (www.vistrails. org) we developed at the Univer sity of U tah is a new visualization system th at provides a comprehensive provenance-management infrastruc ture and can be easily combined w ith existing visualization libraries. Unlike previous systems, VisTrails uses an action-based provenance model that uniform ly captures changes to both param eter values and pipeline defini tions by unobtrusively tracking all changes th at users make to pipelines in an exploration task. W e refer to
this detailed provenance of the pipe line evolution as a visualization trail, or vistrail.
T h e stored provenance ensures th at users will be able to reproduce the visualizations and lets them easily navigate through the space o f pipe lines created for a given exploration task. T h e VisTrails interface lets users query, interact w ith, and understand the visualization process’s h isto ry In particular, they can return to previous versions of a pipeline and change the specification or param eters to gener ate a new visualization w ithout losing previous changes.
Another im portant feature o f the action-based provenance model is th at it enables a series of operations th at greatly simplify the exploration process and could reduce the tim e to insight. In particular, the model al lows the flexible reuse of pipelines and provides a scalable mechanism for creating and com paring num er ous visualizations as well as their cor responding pipelines. Although we originally built VisTrails to support exploratory visualization tasks, its
extensible infrastructure lets users in tegrate a wide range of libraries. T h is makes the system suitable for other exploratory tasks, including data m in ing and integration.
Creating an Interactive
Visualization with VisTrails
To illustrate the issues involved in creating visualizations and how prov enance can aid in this process, we present the following scenario, com mon in medical data visualization.
Starting from a volu metric computed tomography (CT) data set, we generate different visualizations by exploring the data through volume rendering, isosurfacing (extracting a contour), and slicing. N ote that w ith proper modi fications, this example also works for visualizing other types of data (for ex ample, tetrahedral meshes).
D a ta flo w -P ro cessin g N etw o rk s a n d V isual P ro g ra m m in g
A useful paradigm for building visu alization applications is the dataflow model. A data flow is a directed graph in which nodes represent computations,
V I S U A L I Z A T I O N C O R N E R
(a) (b) (c)
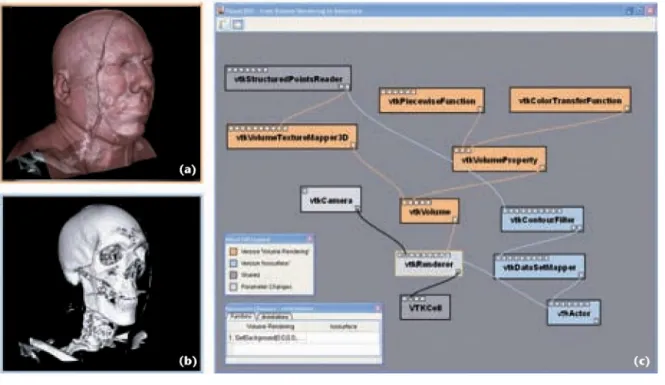
F igu re 1. D a ta flo w p r o g ra m m in g f o r v is u a liz a tio n , (a) W e c o m m o n ly use a s c rip t to d e s c rib e a p ip e lin e fr o m e x is tin g lib ra rie s such as th e V is u a liz a tio n T o o lk it (V T K ). (b ) V isu al p r o g ra m m in g in te rfa c e s , such as th e o n e V isTrails p ro v id e s , fa c ilita te th e c re a tio n a n d m a in te n a n c e o f th e se d a ta flo w p ip e lin e s . T he g re e n re c ta n g le s re p re s e n t m o d u le s , a n d th e bla c k lines re p re s e n t c o n n e c tio n s , (c) T he e n d re s u lt o f th e s c rip t o r V isTrails p ip e lin e is a set o f in te ra c tiv e v is u a liz a tio n s .
and edges represent data streams: each node or module corresponds to a procedure that’s applied on the in put data and generates some output data as a result. T he flow of data in the graph determines the order in which a dataflow system executes the processing nodes. In visualization, we commonly refer to a dataflow network as a visualization pipeline. (For this article, we use the terms workflow, data flow, and pipeline interchange ably) Figure lb shows an example of the data flow used to derive the im ages shown in Figure lc. T he green rectangles represent modules, and the black lines represent connec tions. Most of the modules in Figure 1 are from V T K , and labels on each module indicate the corresponding V T K class. In this figure, we natu rally think of data flowing from top to bottom, eventually being rendered and presented for display
We can use different mechanisms
for creating visualization pipelines— for example, scripting in a modern dynamic language, such as Python. Consider Figure la, which defines the workflow via a script written in Py thon that uses V T K to read a volume data set from a file, extract an isosur face, map the isosurface to renderable geometry, and then finally render it in an interactive window.
Visual programming interfaces for designing data flows have become popular and several systems, such as SCIRun, have adopted them. These interfaces give users a more intuitive view of the pipeline. They also dy namically perform type checking and guide the connection between mod ules’ input and output ports—once the user selects a module’s output, connections are allowed only to the target module’s appropriate input. VisTrails automatically pulls edges toward the correct input port. As we discuss later, another benefit of hav
ing a high-level, structured workflow description is that we can use expres sive languages in querying and updat ing workflows.
C om p arin g a n d E xploring M u ltip le V isu a liza tio n s
Regardless of the specific mechanism we use to define a pipeline, the visu alization process’s end goal is to gain insight from the data. To obtain such insight, users must often generate and compare multiple visualizations. Going back to our scenario, several alternatives exist for rendering our C T data. Isosurfacing is a commonly used technique. Given a function fi
R —> R and a value a, an isosurface consists of the set of points in a do main that map to a—that is, S' = {x e
R": f i x ) = a}.
T he range o f avalues determines all possible isosurfaces that the user can generate. To identify “good” a values that represent a data set’s important
F igu re 2. V isT rails' p a ra m e te r e x p lo r a tio n in te rfa c e . The system c o m p u te s th e re s u lts e ffic ie n tly b y a v o id in g re d u n d a n t c o m p u ta tio n a n d d isp la ys th e m in th e s p re a d s h e e t f o r in te ra c tiv e c o m p a ra tiv e v is u a liz a tio n .
features, we can look at the range of values taken by a, and their frequen cy, in the form of a histogram. Using VisTrails, we can straightforwardly extend the isosurface pipeline to also display a histogram of the data. VisTrails provides a very simple plug in functionality that you can use to add packages and libraries, including your own. For our example, we used matplotlib’s 2D plotting functionality (http://matplotlib.sourceforge.net) to generate the histogram at the top of Figure lc. T his histogram helps in data exploration by suggesting re gions of interest in the volume. T he plot shows that the highest frequency features lie between the ranges [0,25] and [58,68]. To identify the features that correspond to these ranges, we must explore these regions directly through visualization.
Scalable exploration of parameter spaces. VisTrails provides an interface for parameter exploration that lets users specify a set of parameters to explore, as well as how to explore, group, and display them. As a simple ID example, Figure 2 shows an exploration of the
isosurface value as four steps between 50 and 70, displayed horizontally in the VisTrails spreadsheet.
T his spreadsheet lets us compare visualizations in different dimensions (row, column, sheet, and time); we can also link the spreadsheet’s cells to synchronize the interactions between visualizations. Note that VisTrails leverages the dataflow specifications to identify and avoid redundant op erations. By using the same cache for different cells in the spreadsheet, VisTrails lets users efficiently explore numerous related visualizations. Comparing different visualization tech niques.Volume rendering is a power ful computer graphics technique for visualizing 3D data. W hereas many visualization algorithms focus on creating a rendering of surfaces— although they might be surfaces of 3D objects—volume rendering lets us see “inside” the volume. T his tech nique models the volume as cloud like cells of semitransparent material. A surface rendering of the human body might show only the skin, for example, but a complete volume ren
dering might also show the bones and internal organs.
Volume rendering and isosurfacing are complementary techniques, and they can generate very similar imag ery depending on parameters. In fact, distinguishing between them can be difficult. The VisTrails system lets us compare workflows using a visual dif ference interface. To demonstrate this capability, we compute the difference between the original isosurface-gen- eration pipeline and the new volume- rendering pipeline. Figure 3 shows the visual difference of the workflows that we can inspect, along with their resulting visualizations. In Figure 3a, we use volume rendering to create the image, in which we can see the skin on top of the bone structure; Figure 3b shows only the bone structure ren dered with our standard isosurface technique. This ability to (efficiently) compare workflows and visualizations is one of the benefits of the VisTrails action-based provenance model and becomes increasingly important as a workflow becomes more complex and is shared among collaborators.
V I S U A L I Z A T I O N C O R N E R
F igu re 3. A visu al d iffe re n c e b e tw e e n d iffe r e n t p ip e lin e s in VisTrails. W e s h o w th e d iffe re n c e b e tw e e n p ip e lin e s t h a t g e n e ra te d (a) v o lu m e re n d e rin g a n d (b ) iso s u rfa c e v is u a liz a tio n s , (c) T he in te rfa c e d is tin g u is h e s sha red m o d u le s in d a rk gray, th e m o d u le s u n iq u e to is o s u rfa c in g in blue , th o s e u n iq u e to d ir e c t v o lu m e re n d e rin g in o ra n g e , a n d th o s e w ith p a ra m e te r changes in lig h t gray.
F igu re 4. M u ltip le r e n d e rin g te c h n iq u e s , (a) VisTrails re n d e rs v is u a liz a tio n s b y c o m b in in g v o lu m e re n d e rin g a n d is o s u rfa c in g a n d u p d a te s th e m w ith user in te ra c tio n s , (b ) T he c o rre s p o n d in g p ip e lin e re p re s e n ts th e d a ta f lo w fo r c re a tin g in te ra c tiv e v is u a liz a tio n s , (c) VisTrails p ro v id e s a fu lly b ro w s e a b le h is to r y o f t h e e x p lo ra tio n process th a t led to th is fin a l set o f v is u a liz a tio n s .
comparisons arc challenging bccausc they require module-by-module (vi sual program m ing) or line-by-line
(scripting) comparisons. Although the form er can be computationally intrac table (the related decision problem of
subgraph isomorphism is NP-complete), the latter could lead to results th at arc hard to interpret.
T h e V isT r a i l s Sy s t e m
n this article, w e focus on using VisTrails as a too l fo r ex p lo ra to ry visualization. A d d itio n a l features m ig h t be relevant fo r CiSE readers:
• Flexible provenance architecture. VisTrails transparently tracks changes made to w o rk flo w s by m aintainin g a detailed record o f all th e steps fo llo w e d in the e xp lo ra tio n . The system can o p tio n a lly track ru n tim e in fo rm a tio n ab ou t w o rk flo w execution (such as w h o executed a m odule, on w h ic h m achine, and h o w m uch tim e elapsed). VisTrails also provides a flexible an no ta tion fram ew ork th ro u g h w h ic h users can specify ap p lica tio n - specific provenance in fo rm a tio n .
• Querying and reusing history. Provenance in fo rm a tio n is stored in a structure d way. Users have the choice of using a relational database (such as MySQL o r IBM DB2) o r XM L files in the file system. The system provides flexible and in tu itiv e qu ery interfaces th ro u g h w h ich users can explore and reuse provenance in fo rm a tio n . Users can fo rm u la te sim ple keyw ord-based and selection queries (find a visualization th a t a given user created, fo r exam ple) as w ell as structure d queries (find visualizations th a t ap ply sim p lifica tio n before an isosurface c o m p u ta tio n fo r irre gular g rid data sets).
• Support for collaborative exploration. Users can configure the system w ith a database back end th a t can act as a shared repository. This back end also provides a syn chro nization fa c ility th a t lets users collaborate asynchro nously and in a disconnected fashion— the y can check changes in and ou t, akin to a version -co ntrol system (such as subversion (SVN), h ttp ://s u b v e rs io n .tig ris .o rg).
• Extensibility. VisTrails provides a very sim ple p lu g -in fu n c tio n a lity th a t can he lp dyn am ically add packages and libraries. N e ith e r changes to th e user interface nor system reco m pilatio n are necessary. Because VisTrails is w ritte n in Python, in te g ra tin g P ytho n-w ra ppe d libraries is s tra ig h tfo rw a rd .
• Scalable derivation of data products and parameter explora tion. VisTrails supports a series o f operations fo r s im u lta neously ge nerating m u ltip le data products, in clu d in g an interface th a t lets users specify sets o f values fo r d iffe re n t param eters in a w o rk flo w . Users can display the results o f a param eter e x p lo ra tio n side by side in the VisTrails spreadsheet fo r easy com parison.
• Task creation by analogy. VisTrails supports analogies as first-class operations to gu id e sem iautom ated changes to m u ltip le w o rkflow s, w ith o u t req uiring users to dire c tly m anipulate o r e d it the w o rk flo w specifications.
Please v is it w w w .v is tra ils .o rg to access th e VisTrails c o m m u n ity W eb site. Y ou'll fin d in fo rm a tio n in c lu d in g in s tru c tio n s fo r o b ta in in g th e softw a re , o n lin e d o c u m e n ta tio n , v id e o tu to ria ls , and po in te rs to papers and presentations.
VisTrails is w r itte n in P ytho n and uses the m u ltip la t fo rm Q t lib ra ry fo r its user in te rfa ce. The system is open source, released u n d e r th e CPL 2.0 license. The p re -c o m - piled versions fo r W in d o w s , M ac OS X, and Linux com e w ith an in s ta lle r and several packages, in c lu d in g VTK, m a tp lo tlib , and Im age M agick. A d d itio n a l packages, in c lu d in g ones users have w ritte n , are also available, b u t you can easily add ne w packages using th e VisTrails p lu g -in in fra s tru c tu re . D e tailed in s tru c tio n s are available at o u r W eb site.
Interacting with visualizations. The images we generated so far corre spond to simple, static workflows. To perform a more dynamic compari son between volume rendering and isosurfacing, we add a feedback loop into the workflow to let users adjust the visualization interactively. We thus build a new workflow that uses the isosurfacing and volume render ing algorithms simultaneously We add a clipping plane into the volume visualization to assign the volume regions used for each algorithm. In addition, we use a point on the plane to define axis-aligned slices of the volume that we display in distinct spreadsheet cells. T he pipeline in
teractively updates these slices along with the plane during user interac tions. Figure 4 shows the resulting visualizations along with the com plex dynamic workflow required to produce them.
P roven an ce an d
E xploratory V isu alization
T he combination of multiple visual ization algorithms, different librar ies, and the interactions between them considerably complicates the workflow specification. In addition, creating a set of visualizations from data is not always a linear process and often involves several itera tions as a user formulates and tests
hypotheses. W hereas for simple experiments, manual approaches to provenance management might be feasible, complex computational tasks involving large volumes of data or multiple researchers require au tomated approaches. As these tasks’ complexity and scale increases, data organization becomes a major com ponent of the process.
VisTrails manages the data ma nipulated and metadata created in the course of an exploratory task.5 As a user (or group of users) generates a series of visualizations, VisTrails transparently tracks all the steps this exploration followed—that is, the modules and connections added and
V I S U A L I Z A T I O N C O R N E R
F igu re 5. T he VisTrails q u e ry -b y -e x a m p le in te rfa c e , (a) Users can d e fin e a set o f m o d u le s a n d p a ra m e te rs in th e visu al p r o g ra m m in g in te rfa c e to cre a te a q u e ry te m p la te , (b ) T he q u e ry re s u lts are s h o w n in th e h is to r y tre e , w h ic h users can b ro w s e f o r s p e c ific in sta nce s o f th e m a tc h (in s e t).
Table 1. Q u e ry e xa m p le s.
Q u e ry Result
volume H ighlig hts all nodes in the histo ry tree in w h ic h th e string "v o lu m e " appears (fo r exam ple, in a m od ule name, param eter name, a n no ta tion ) usenjuliana H ighlig hts all nodes in the histo ry tree created by
th e user "ju lia n a "
before: March 30, 2007 H ighlig hts all nodes in the histo ry tree created before "M a rc h 30, 2 0 0 7 "
deleted, parameter value changes, and so on. Figure 4c shows a history tree of the different pipelines created in the course of our running example. The nodes in this tree correspond to pipe lines; an edge between two pipelines corresponds to changes performed on the parent pipeline to obtain its child. For readability, by default, only the nodes in the tree that the user tags as important are displayed.
By tracking all the changes made to a workflow ensemble, VisTrails properly captures each step, leaving a complete trail of the work. Hav ing access to the different pipelines’ specifications lets others reproduce and share the results of each step in the exploratory process. To demon strate this, we made the vistrail asso
ciated with this example available for download with the VisTrails system (see “T he VisTrails System” sidebar). You can recreate each figure shown in this article by executing the different nodes in the history tree. Note that by using the action-based provenance model, we obtain a very concise rep resentation of the history, which uses substantially less space than the alter native of explicitly storing multiple
versions of a pipeline.5
T he exploration trail VisTrails cap tures also supports various activities that are crucial for performing reflec tive reasoning and obtaining insights, such as following chains of reasoning backward and forward and comparing different results.4 T he tree-based view lets users
• seamlessly navigate over the history tree and return to previous pipeline versions after reaching a dead end; • undo bad changes;
• reuse pipelines and pipeline frag ments from previous versions; • compare different pipelines and
their results; and
• be reminded, intuitively, of the ac tions that led to a particular result. Thus, users can efficiently explore several related visualizations.
T he issue of reproducibility for vi sualization has been considered be fore,5 but we should note that whereas some visualization and workflow sys tems provide support for provenance tracking, their focus has been on data provenance—that is, information about how the system derived a given data product, including the param eter values used6—and on interaction provenance (such as capturing a visu alization’s viewing manipulations).7 VisTrails is the first system to capture information about how workflows evolve over time.
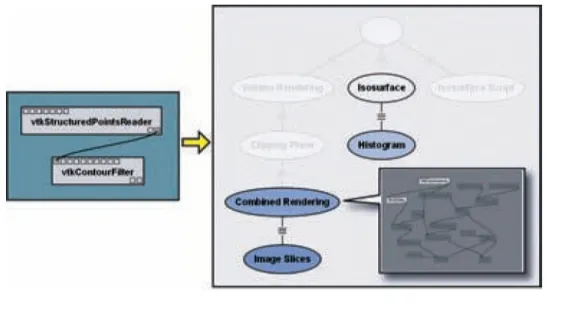
For instance, to generate the composite visualization in our final example, we extended our pipeline labeled Volume Rendering to include
modules from the pipeline labeled Isosurfacing. (Having two pipelines lets us further explore the visualiza tion—by trying different isosurface values, for example [see Figure 2]). In addition, we can compare the pipe lines by dragging one node on top of the other (see Figure 3). These computed differences are useful for understanding the visualization pro cess, and the user can also reuse them. In this case, we applied the modules unique to “Isosurfacing” to “Volume Rendering” to create a new pipeline called “Combined Rendering,” that uses a cutting plane to define regions for the rendering methods. VisTrails can automatically apply pipeline dif ferences (like a patch) to derive new pipelines in a process we call visual ization creation by analogy.s
Another benefit to having a high- level specification of the visualiza tion process is that users can query the pipelines and their execution instances. Scientists can query a vis trail to find anomalies in previously generated visualizations and locate data products and visualizations based on operations applied in the visualization process. VisTrails sup ports simple, keyword-based queries as well as structured queries. In addi tion to providing information about the results (for example, workflow identifiers and attributes), VisTrails can visually display query results by highlighting the workflows and mod ules that satisfy the query. Table 1 shows an example.
Users might also define queries by example.8 As Figure 5 illustrates, us ers can construct (or copy and paste) a pipeline fragment into the VisTrails query tab to identify in the history tree all nodes that contain that frag ment. They can then browse through the highlighted nodes and click on one
to display the workflow and highlight the modules that match the query. Users can then click on the individual modules to view the execution log re cords associated with them.
he VisTrails project has focused on creating an infrastructure to manage the provenance data of ex ploratory tasks. W ith this infrastruc ture in place, our research focus is now on what we can do with all the provenance accumulatation. By m in ing this information, we hope to learn useful patterns that can guide users in assembling and refining complex
computational tasks. Si
A c k n o w le d g m e n ts
T his article summarizes work being done in the VisTrails project. It’s only possible through the work of all our team members: Erik Anderson, Jason Callahan, David Koop, Emanuele Santos, Carlos E. Scheidegger, and Iluy T. Vo. T he data used in this ar ticle is available courtesy of the N a tional Library of Medicine’s Visible IIum an Project. T he US National Sci ence Foundation partially supported this work under grants IIS-0513692, CCF-0401498, EIA-0323604, CNS- 0541560, OCE-0424602, and OISE- 0405402. T he US Departm ent of Energy, an IBM Faculty Award, and a University of Utah Seed G rant also partially supported this work.
R eferences
1. W. Schroeder, K. Martin, and B. Lorensen, The Visualization Toolkit: An Object-Oriented Approach To 3D Graphics, Kitware, 2003. 2. E.A. Lee and T.M. Parks, "Dataflow Process
Networks," Proc. IEEE, vol. 83, no. 5, 1995, pp. 773-801.
3. S. Callahan et al., "Managing the Evolution of Dataflows with VisTrails (extended ab stract)/' Proc. IEEE Workshop on Workflow and
Data Flow for Scientific Applications (SciFlow), IEEE CS Press, 2006.
4. D.A. Norman, Things That Make Us Smart: Defending Human Attributes in the Age of the Machine, Addison-Wesley, 1994.
5. C. Kindlmann, "Lack of Reproducibility Hin ders Visualization Science," IEEE Visualization Compendium, IEEE CS Press, 2006, p. 69. 6. T. Jankun-Kelly, K.-L. Ma, and M. Certz,
"A Model and Framework for Visualization Exploration," IEEE Trans. Visualization and Computer Graphics, vol. 13, no. 2, 2007, pp. 357-369.
7. D.P. Croth and K. Streefkerk, "Provenance and Annotation for Visual Exploration Systems," IEEE Trans. Visualization and Computer Graphics, vol. 12, no. 6, 2006, pp. 1500-1510.
8. C. Scheidegger et al., Querying and Creating Visualizations by Analogy," to be published in IEEE Trans. Visualization and Computer Graphics, 2007.
Claudio T. Silva is an associate professor at the University of Utah. His research inter ests include visualization, geom etry pro cessing, graphics, and high-perform ance com puting. Silva has a PhD in com puter science from SUNY at Stony Brook. He is a m em ber of the IEEE, the ACM, Eu rographics, and Sociedade Brasileira de M atem atica. Contact him at csilva@ cs.utah.edu.
Juliana Freire is an assistant professor at the University of Utah. Her research inter ests include scientific data management, Web inform ation systems, and inform ation integration. Freire has a PhD in com puter science from SU NY at Stony Brook. She is a m ember of the ACM and the IEEE. Contact her at [email protected].
Steven P. Callahan is a research assistantand P hD candidateatthe University of Utah. His research interests include scientific visual ization, visualization systems, and computer graphics. Callahan has an MS in com puta tional engineering and science from the University of Utah. Contact him at stevec@ sci.utah.edu.