Worcester Polytechnic Institute
Digital WPI
Masters Theses (All Theses, All Years) Electronic Theses and Dissertations
2011-05-04
Math Learning Environment with Game-Like
Elements and Causal Modeling of User Data
Dovan Rai
Worcester Polytechnic Institute
Follow this and additional works at:https://digitalcommons.wpi.edu/etd-theses
This thesis is brought to you for free and open access byDigital WPI. It has been accepted for inclusion in Masters Theses (All Theses, All Years) by an authorized administrator of Digital WPI. For more information, please [email protected].
Repository Citation
Rai, Dovan, "Math Learning Environment with Game-Like Elements and Causal Modeling of User Data" (2011).Masters Theses (All Theses, All Years). 722.
Math Learning Environment with Game-Like Elements and
Causal Modeling of User Data
by Dovan Rai
A Thesis
Submitted to the Faculty of the
WORCESTER POLYTECHNIC INSTITUTE in partial fulfillment of the requirements for the
Degree of Master of Science in
Computer Science February 2010
_______________________ Prof. Joseph E. Beck, Advisor
_______________________ Prof. Charles Rich, Reader
_______________________
2
Content
Abstract 5
1. Motivation 6
2. Introduction: Monkey's Revenge 8
3. Background: Games and learning 9
Emotional interest 10 Cognitive interest 10 Cognitive overload 11 Learning Objective 11 4. Theoretical framework 12 Game-like elements 12
Integrating game-like elements into tutor 13
Tutor-game space 15
Game-like elements in Monkey‟s Revenge 18
Embedding domain in a context 18
Visual affordances 19
Other game-like elements 20
5. Design and Development 22
Math content in game-like environment 22
Design decisions 23
Finding fun in the learning 23
Accessibility 24
Time Overload 25
Cognitive Overload 25
Software implementation 26
6. Experiments and analyses 27
Experiment 1: Mily's World 27
3
Experiment 2: Monkey‟s revenge 31
Condition a: Monkey‟s revenge 31
Condition b: Monkey‟s Revenge without visual feedback 31 Condition c: Monkey‟s Revenge without narrative 32
Condition d: Basic tutor 32
Hypotheses 35
Participants 36
Data collection 36
7. Results: comparing tutor versions 38
Liking and satisfaction 39
Learning gain 41
Cognitive overload 41
Time overload 41
8. Results: Causal modeling 42
Variables in causal modeling 44
Causal modeling and Correlation matrix 45 Causal structure, path orientation and domain knowledge 48 Causal modeling and multiple regression 53 Causal modeling: confirmatory, exploratory and graphical tool 55
9. Discussion and Future Work 60
10. Conclusions 61
REFERENCES 61
4
List of Figures
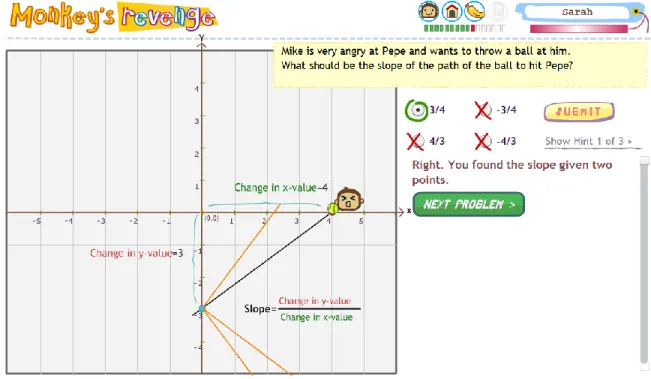
Figure 1 Screenshot of Monkey's Revenge ... 9
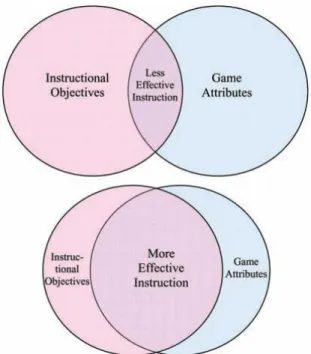
Figure 2 Instructional Effectiveness as Degree of Overlap among Instructional Objectives and Game Attributes ... 12
Figure 3 Three possible tradeoff curves for making tutors more like games ... 14
Figure 4 Finding optimal point in tutor-game space ... 17
Figure 5 Students collect icons as they master a sub-skill ... 21
Figure 6 Students can help Mike decide name for the monkey ... 21
Figure 7 Visual representation gets more abstract in later problems ... 26
Figure 8 Screenshot of Mily's World ... 28
Figure 9 screenshot of Monkey's revenge with all game-like elements ... 33
Figure 10 Screenshot of tutor version without narrative ... 33
Figure 11 screenshot of Basic tutor ... 34
Figure 12 Screenshot of Monkey's Revenge with visual feedback ... 34
Figure 13 Screenshot of Monkey's Revenge without visual feedback ... 35
Figure 14 Screenshot of a page with survey questions ... 37
Figure 15 Screenshot of questions asked as Pre and Post-test ... 38
Figure 16 ratio of students based on their response across ... 40
Figure 17 Causal model from PC algorithm without domain knowledge ... 45
Figure 18 Graph based on correlation matrix ... 47
Figure 19 Causal model with domain knowledge... 50
Figure 20 Block diagram of our causal modeling process ... 55
5
Abstract
Educational games intend to make learning more enjoyable, but at the potential cost of compromising learning efficiency. Therefore, instead of creating educational games, we create learning environment with game-like elements: the elements of games that are engaging. Our approach is to assess each game-like element in terms of benefits such as enhancing engagement as well as its costs such as sensory or working memory overload, with a goal of maximizing both engagement and learning. We developed different four versions of a math tutor with different degree of being game-like such as adding narrative and visual feedback. Based on a study with 297 students, we found that students reported more satisfaction with more „game-like‟ tutor but we were not able to detect any conclusive difference in learning among the different tutors. We collected student data of various types such as their attitude and enjoyment via surveys, performance within tutor via logging, and learning as measured by a pre/post-test. We created a causal model using software TETRAD and contrast the causal modeling approach to the results we achieve with traditional approaches such as correlation matrix and multiple regression. Relative to traditional approaches, we found that causal modeling did a better job at detecting and representing spurious association, and direct and indirect effects within variables. Causal model, augmented with domain knowledge about likely causal relationships, resulted in much more plausible and interpretable model. We propose a framework for blending exploratory results from causal modeling with randomized controlled studies to validate hypotheses.
6
1. Motivation
Games, due to their engagement and popularity, have been a subject of major interest among education designers [1, 2, 3, 4, 5]. Using games in education has a growing number of ardent proponents [3, 6, 8, 14] as well as many unconvinced skeptics [1, 4, 5] . With the arrival of personal computers in 1980s, there was a new interest in using computer games for educational purpose; but the „edutainment‟ industry declined in the late 1990s. Interest in educational games has grown again in this new century with new models, new ideas and new goals. Current educational game research is not limited to traditional curricular content, but is ambitious in innovating curriculum and extending learning space beyond schools [15]. Games are studied and created with an aim to teach new media literacy skills and higher order skills such as critical thinking, problem solving, collaboration, accessing knowledge networks, and judgment of information. While such skills are becoming more relevant and crucial, these are not yet integrated into standard curriculum and assessment. Using games in standard curriculum like math and science is very controversial. Despite games‟ intuitive appeal and popularity, empirical evidence shows games to be generally less effective than tutors when it comes to learning gains [1].
Play has evolutionary utility for learning [31] and most digital games involve learning as a core element as players have to read and seek out new information to master the game. Games and learning researchers have begun to show how the design of computer games embed effective learning principles in highly motivating contexts [3]. Despite this
7
potential for enhancing learning by arousing not only sensory and emotional interest but also cognitive interest, there are some serious limitations and constraints that appear while creating and using games for learning. First, games tend to take up time that could have been used for instruction. Game environments and dynamics can be complex and require students to spend time to learn them first. Besides, play aspect of games can also consume time. Since time on task is an important predictor for learning, students may not learn as much from games as from other material within the same time. Second, games may add additional cognitive load among learners which can be a serious issue when the learning task is cognitively challenging and students are struggling with the content. Third, there is an additional requirement for designers to align instructional objectives and game attributes. If not executed properly, this may not only result in less effective instruction but also may only add extrinsic motivation hindering intrinsic motivation. Students might get the impression that learning is not a fun activity but a boring drudgery which has to be performed in order to get to more interesting game sequences. Therefore, instead of completely integrating educational content into a game framework, we instead choose to incorporate into the tutor those features of games that are motivational but do not overly detract from learning. With this aim, we created first Mily’s World[16] and then Monkey’s Revenge[17], learning environments with game-like elements, the elements of games that are engaging in nature like rewards, fantasy, challenge, animations, etc. We are taking a measured and minimalist approach by incrementally making a complete tutor more game-like by weighing each additional game-like
8
component in terms of retaining all the learning features of a tutor and minimizing the limitations, while exploiting the benefits of games.
2. Introduction: Monkey's Revenge
Monkey‟s Revenge is a coordinate geometry math learning environment with game-like
elements. The system is basically a series of 8th grade coordinate geometry problems wrapped in a visual narrative. Students have to help story characters solve the problems in order to move the story forward. Similar to classic computer tutors such as ASSISTment1, they get hints and bug messages when they stumble upon problem and misconceptions. In the story, a boy, Mike is thrown out of class for playing a game on his cell phone. He is happy to be outside in the sun but the day is going to be a strange one as his world is now mapped into coordinates. As a warm-up problem, students have to find out Mike‟s height in coordinate units based on the coordinate pair of his head. Mike finds
a monkey and being lonely, Mike wants to befriend him. Students can help Mike give a name to the monkey. He builds a house for the monkey, but the monkey is not eager to become domesticated (see Figure 1) and destroys the house, steals his phone and runs away. The boy tries to get back his phone by throwing balls at the monkey. To move the story forward, the students have to solve coordinate problems like calculating distance between the boy and the monkey, the slope of the roof and walls of the house, finding points where the monkey tied to a rope cannot reach bananas and finally figure out
9
slopes, intercepts and equation of the line of the path of the ball. The math content gets more advanced as a student progresses with the story.
Figure 1 Screenshot of Monkey's Revenge
3. Background: Games and learning
Games in education have been a topic of interest and controversy among education researchers. When we add game-like elements to a tutor to make it more game-like, we expect to have a more engaging environment. But, we still do not know how learning changes in the process. We will briefly summarize current literature in terms of how games can aid or limit learning.
10 Emotional interest
Games can make learning enjoyable by offering intrinsically motivating elements like sensory stimuli, rewards, fantasy, challenge, control, personalization, etc. Games, being engaging, make learners more attentive and willing to spend lots of time that fosters practice.
Cognitive interest
Besides giving users an immersive, fun environment to engage, games also offer cognitive support for learning and arouse cognitive interest [9] among learners on the learning content.
Problem-based learning: With games, students can use content knowledge to solve problems and practice skills along the way. Effective games provide learners with multiple opportunities to apply earlier learning to later problems [3].
Authentic contexts and situated learning: The virtual worlds of games make it possible to develop situated understanding. Such games can build problem spaces in which content has authentic utility.
Active and experiential learning: Games allow learners to be an active participant in the learning process rather than just a passive receiver [3]. Games can be used to create an experiential context for understanding around a topic, issue, or principle that a teacher can build on [15]. Games can also give learners well-designed experiences that they
11
cannot have in the real world (like being an electron or solving the crisis in the Middle East) [3].
Cognitive overload
Cognitive load theory [11] states that learning uses a very limited working (or short-term) memory and an unlimited long-term memory. If there are too many game elements to be learned, then cognitive load will exceed the limits of working memory, and therefore, there would be less learning. Games that have a novel environment and complex rules may overload learners who are already struggling with the learning content. Since regular games have a sole purpose of entertaining, they can afford to introduce novel environment and complex rules. However, learning games have to restrain from adding too many extraneous details.
Learning Objective
As illustrated in Figure 2, it is more likely that games will be instructionally effective if the specific characteristics of the game (e.g., setting, player roles and activities, rules, etc.) overlap with specific instructional objectives. This overlap must be consciously structured on the basis of a thorough analysis of the reasons for the instruction and the instructional objectives to be met. [4]. Like any instructional medium or approach, games must provide a means for learners to engage in cognitive and/or motor interactions that directly support instructional objectives. Specific games and game elements are suitable for specific instructional content and objectives. For example: “twitch” gameplay may be
12
suitable for math fluency but not for the algebra problem requiring longer processing and reflection.
Figure 2 Instructional Effectiveness as Degree of Overlap among Instructional Objectives and Game Attributes
4. Theoretical framework
Game-like elements
There have been many attempts to distill game elements, characterize them and study them [2, 6, 8, 14 ]. Malone and Lepper [1987] mentioned challenge, curiosity, control, and fantasy as integral features of games. According to de Felix and Johnson [1993], games are composed of dynamic visuals, interactivity, rules, and a goal. Thiagarajan [1999] asserts that conflict, control, closure, and contrivance are the four necessary
13
components. Juul [2003] suggested that games consist of six elements: rules, variable quantifiable outcome, player effort, valorization of the outcome, attachment of the player to the outcome, and negotiable consequences. In 2001, Garris and Ahlers [2002] discuss about fantasy, rules/goals, sensory stimuli, challenge, mystery, and control. Marc LeBlanc‟s taxonomy [2] of game pleasures for participants identifies eight fundamental
aspects to fulfilling their emotional needs: sensation, fantasy, narrative, challenge, fellowship, discovery, expression and masochism.
Integrating game-like elements into tutor
Integrating game elements into a learning environment is a delicate design process. While there have been many theories and analyses to assess the impact of such game elements in learning [2, 5], there is still a dearth of detailed experimental studies of individual game-like elements. We want to analyze and assess each game-like element and their impact on learning environment.
We have plotted three plausible tradeoff curves of making tutor more game-like in Figure 3. The tradeoff curves for different elements may turn out to be different with different content and domain.
14
Figure 3 Three possible tradeoff curves for making tutors more like games
a. Some game-like elements, such as narrative, may enhance learning by engaging students and adding context to the learning content. But, once the narrative gets too elaborate and complex, it may make learning process very complicated and
confusing.
b. Some game-like elements, such as reward structure, may be orthogonal to learning content and may not interfere with, or directly benefit, learning at all. Such game-like elements may improve learning by engaging learners thus making them more
attentive and increasing time on-task.
c. Some game-like elements, such as user control in navigating between different problem quests, can be very difficult to integrate into educational material, and thus distract the learner from the learning objectives.
Similarly, interaction of different game-like elements may synergize or lead to incoherence and overload. We are also aware of the fact that the results will heavily depend on each game element‟s relevance to the specific learning content, how each
element is designed, delivered and integrated.
15
Tutor-game space
Caillois [1961] describes a game as an activity that is voluntary and enjoyable, separate from the real world, uncertain, unproductive ( the activity does not produce any goods of external value), and governed by rules. Hays [4] defines game as an artificially constructed, competitive activity with a specific goal, a set of rules and constraints that is located in a specific context. According to Salen and Zimmerman, a game is a system in which players engage in an artificial conflict, defined by rules, that results in a quantifiable outcome. There are many academic definitions of games, but none of them
have been accepted as definitive and all encompassing. In fact, there is an active community of game theorists among whom the debate of exactly how to define a game goes on continuously [18]. In Philosophical Investigations, Ludwig Wittgenstein[32] demonstrated that the elements of games, such as play, rules, and competition, all fail to adequately define what games are. Wittgenstein concluded that people apply the term game to a range of disparate human activities that bear to one another only what one might call family resemblances. Entertaining interactive activities that resemble games may incorporate all or only a subset of characteristics set by formal definitions of games. While some regard conflict and competition as central to a game, there are some activities such as The Sims and Farmville, without conflict that are getting more popularity as games than the conventionally defined games. With new media, new demography and new usage, definitions and perceptions of games have constantly evolved.
16
In particular, educational materials created with an aim to entertain as well as educate have always been quite debated if they qualify as games or not. Game enthusiasts have complained that the educational materials that sell themselves as games are just interactive systems but not games at all. There are a lot of poorly designed materials that try to become games without understanding game‟s fundamentals and exploiting the
benefits of games. But there are also lots of carefully designed materials that are game-like but do not fit into the formal definitions of game. So, why are there are so many game-like learning materials that do not qualify as games from conventional definitions of games? There are several possibilities to consider:
Do educational game designers have limited exposure and understanding of games?
Is it really hard to design educational games?
Does something game-like but not exactly a game suffice for educational purposes?
Do learners expect such game-like educational materials to be fully fledged games?
Do educational game designers need to strive to fit in their creations within narrow definitions of games?
While we acknowledge the necessity and value of clear definitions, ill-defined activities like Farmville and The Sims have been not only been successful but also reached new demographics that were not addressed by the traditional video games. Researchers like Rieber[19] have suggested effectiveness of hybrid learning environment combining simulation and games in microworlds. We are also proposing to create a learning environment that incorporates both elements of tutor and game. We want to explore the
17
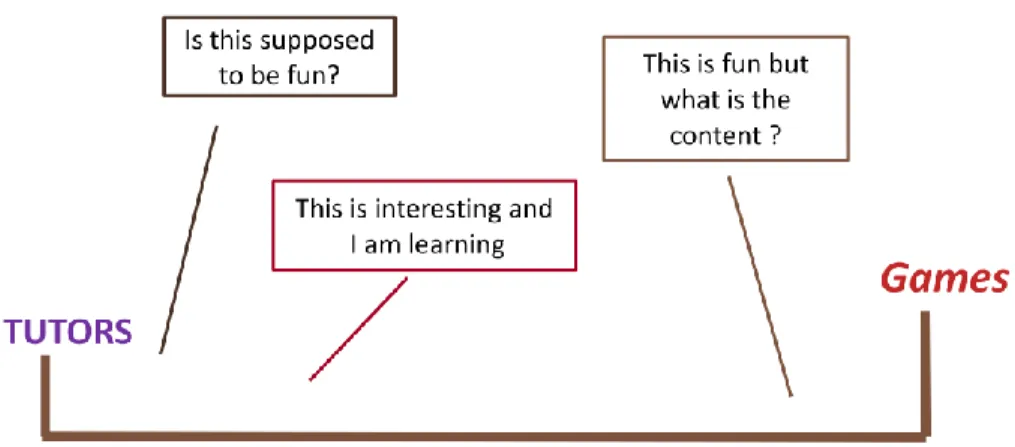
space between tutor and games and want to find an optimal point where we can have both engagement and learning (see Figure 3).
Figure 4 Finding optimal point in tutor-game space
Empirical evidence on games shows that some content and skills are suitable for learning via games while some are not. There are a lot of games on math fluency, rapid responses on simple math skills, but making games out of middle school algebra is more challenging. Our domain, coordinate geometry, is relatively abstract, novel, complicated and challenging for our target population, 8th grade students, and therefore working memory overload is a very serious constraint that we have to consider. Our hypothesis is that the optimal point of our learning environment will be closer to tutor rather than games. We are starting from a very conservative point with an aim to retain all learning features of a tutor and are taking an iterative process to find out the optimal point where we can have both engagement and learning.
18
Game-like elements in Monkey’s Revenge
For our design, we carefully picked the game-like elements that we thought to be relevant and cognitively supportive to our content. Since coordinate geometry is a cognitively challenging task, balancing cognitive overload was a very crucial design challenge for us. In the following paragraphs, we will be discussing the design and learning challenges of the different game-like elements we chose.
Embedding domain in a context
Authentic activities: One of the problems math learners face is that math tends to be abstract and they are not able to directly map what they have learnt in their real life activities. Research on authentic learning has suggested that learning is more efficient and effective when it is embedded in realistic and relevant contexts [10]. Coordinate geometry has abstract representations that have many concrete applications. We tried to incorporate those concrete activities, such as calculating distance between the boy and monkey based on their coordinates and calculating slope of the roof of a house. These activities should be simple and intuitive in relation to the math concept. If they seem complex or unintuitive, students can get confused and uninterested.
Narrative: We see the advantages of narrative in two ways. First, it entertains and engages learners and give a meaningful context for solving problems. Second, if we use a coherent story, the initial story context can be reused for multiple problems, thus saving effort to read context for each new word problem as compared to traditional word problems where the problems tend to have disjoint context. The narrative had to cover a
19
progression of learning content in increasing order of difficulty but at the same time, we could not afford to have an elaborate narrative. We have used absurd humor (e.g. Mike‟s world is mapped into coordinates and he meets a monkey out of nowhere) so that students feel comfortable with sudden twists in narrative which sometimes can be unconvincing.
Visual affordances
Visual problem representation: Graphics not only add appeal but they can help develop mental models, thus reducing the burden on working memory [12]. We used very simple and minimalist visual representation so as not to interfere with the coordinate graph itself. As the problems get harder, they tend to be more abstract and it is harder and unintuitive to have concrete representations. Therefore, we have used a strategy of making the representations more concrete at first (story characters shown as cartoon images in Figure 1) and less so as we proceed (story characters are abstracted to dots in Figure 7). Initial concrete grounding facilitates interpretation in later problems [13].
Immediate visual feedback: We have used different immediate visual feedbacks for student responses to serve both engagement and learning objectives. Immediate visual feedback makes the interface more interactive, giving users sense of control and reinforcement. When the feedback is appealing and interesting, it adds to sensory stimuli. For example, when students give correct slope values of the monkey house‟s roof, the roof will be animated as being built. This gives positive reinforcement to the student for making correct response and also gives them the sense of progress in narrative. Similarly,
20
a ball will be thrown and hit the monkey if user can get the right value for the slope of the path of the ball. While visual feedback on positive responses give students reinforcement, with visual feedback on wrong response, students can tell what the error was and how it relates to the correct solution (e.g. a math fraction game Darts [39]). For instance, if student gives wrong slope value, a line with the wrong slope will be drawn on the graph. In general, the consequences of failure should not be more interesting and exciting than the consequences of success as students may intentionally generate incorrect responses. We have violated this principle in one problem (if user gives wrong coordinate value where the monkey can reach, he will go and eat the banana) as an experiment to observe the influence of such feedback on user‟s actions.
Other game-like elements
Collection: Students can collect badges after each level as they master a sub-skill. By tagging those badges with math skills, we wanted to create a tighter bond between game-environment and content. In Figure 5, student has collected monkey and house icons and has yet to collect banana and cell phone icons.
Building: Students have to solve different problems to build a house. Using various sub-skills to create a single structure, students can see how different mathematical concepts can be integrated within a single entity.
Personalization: Students can name the monkey. Though this seems a small addition on the designer‟s part, students were very excited about this feature.
21
Figure 5 Students collect icons as they master a sub-skill
22
Sensory stimuli: We have used colorful visuals and animations to make it visually appealing to the users. Similarly, we have also added some sound effects to accompany the visual animations like a new house popping up, house being destroyed, a ball being thrown, etc.
5. Design and Development
We have designed and built the learning environment using theories and knowledge from different domains like math, learning science, human computer interaction, game development, and software development.
Math content in game-like environment
We picked 8th grade coordinate geometry as our content domain as this is a very crucial component of middle school math and peculiar in the sense that it combines both geometry and algebra. Though coordinate geometry is rather abstract, it has a lot of concrete applications. Our math content is based on the curriculum of Worcester middle schools. We picked the relevant problems from ASSISTment2, a web based math tutoring system. We have changed some of the questions, created a few of new questions and have verified the changes with a content expert, Ms. Christina Heffernan. Our main criteria while designing the content is to make intuitive mapping of the math content to
23
the story context. The progression of story should follow the progression and complexity of the math content.
Design decisions
There are many frameworks and theories in game design such Mechanics, Dynamics and Aesthetics (MDA) framework [40], theory of flow [41], clear goal setting, meaningful context, etc. Designing educational games pose new challenges and constraints. New research and theories from learning science, game design, multimedia, and human computer interaction have given theoretical and practical guidelines for designing educational games. Based on these theories and unique requirements of our content, we have made some conscious and careful design decisions that we will describe below.
Finding fun in the learning
Researchers in educational games warn of two major mistaken approaches of making educational games: adding educational content in a game and making a game out of learning. They instead suggest of “finding the fun in the learning" and devising ways to
focus on and enhance that fun as a core game dynamic as a good strategy [15]. Finding that “play space” in the learning experience is where the fun can be found. We think that
the fun in coordinate geometry is the fact that this seemingly very abstract concept does have a lot of concrete applications. When students can use these coordinate geometry concepts and skills and apply them to solve their real world problems, they can have a more fun. We have used narrative to tie together the real world activities into an emotionally appealing context.
24 Accessibility
Appeal to entire population: While regular games can focus on one particular sub group within large population and customize and cater to that particular group, educational materials should appeal to all members in the target population, or at least all the students using the system. One option is to build a lot of different versions which is not always an efficient and feasible way. Hence, we need to address both gender and other subgroups with distinctive tastes and preferences. For example: we have used emotional elements like befriending the monkey and offering him a banana, and mischievous events like tying the monkey to a rope and throwing ball to each other. We have taken special care to appeal to both genders. The main protagonist is a male but he is not a stereotypical boy. He is a sensitive character who gets embarrassed when the teacher calls on him, wants to befriend the monkey and is forgiving to him. The center of the narrative is emotional dynamics between the boy and the monkey; girls tend to like such narratives involving animals. The monkey is cute but also naughty and mischievous in a likeable way. We have also tried to make the color theme of the interface gender neutral.
Complexity: Educational games should assume very little or no game literacy among users. Hence, the complexity of interactions should be very simple. We are using a classic tutor interaction in our current version and aim to retain the simplicity in interactions in our future versions of the tutor.
25 Time Overload
Details and fidelity: Since we cannot afford to have elaborate narrative due to time overload, we are creating a narrative with as little detail as possible.
Cognitive Overload
Minimal visual presentation: We have used very minimal visual representation so as not to overwhelm users with too much detail and also not interfere with the coordinate graph itself.
Novelty in narrative: There should be a balance in the novelty of narrative and game environment. It can get too predictable if there is not enough novelty and it can on the other hand create disbelief if there are there are many unexpected events. Due to concerns of cognitive overload, we have not used very novel scenarios like prehistoric times or extra-terrestrial elements but have rather used very familiar characters and events like a classroom and a mischievous monkey. We have added humor and surprising narrative twists to make the narrative engaging.
Concreteness fading: As the problems get harder, they tend to be more abstract and it is harder and counterintuitive to have concrete representations. Therefore, we have used a strategy to make the representations more concrete at first (story characters shown as cartoon image, as in Figure 1) and less so as we proceed (story characters are abstracted to dots, as in Figure 7). Initial concrete grounding facilitates interpretation in later problems.
26
Figure 7 Visual representation gets more abstract in later problems
Software implementation
We have developed the system in Flash. The front end is in Actionscript, XML and CSS and the back end for logging is in PHP and MYSQL. We have used all vector diagrams to make the flash document compact and flexible. While creating the user interface, we have tried to incorporate user experience design so as to make it intuitive, appealing and age appropriate.
27
6. Experiments and analyses
Experiment 1: Mily's World
Mily‟s World was the first generation of our approach where students meet Mily, a
9-year old girl who is the protagonist of the narrative. She has a puppy and some friends with whom she plays soccer. Students are engaged in many different math-related tasks. For example, they calculate Mily‟s height and the distance between her and her puppy
based on the coordinates of their heads. As they proceed, students help Mily decide the name of the puppy and then help create a doghouse (see Figure 8). When students give the correct answer for slopes, the doghouse wall and roofs are built gradually and then a new doghouse pops up. The puppy develops a bad habit of chewing socks; so Mily ties him to a post. Students have to help her find the coordinates of a position to place the socks where the puppy cannot reach them. Afterwards, Mily goes out with her friends to play soccer wearing the socks that the students have kept the puppy from chewing. Here, students have to calculate slopes and equations of the path of the ball as Mily and her friends play.
28
Figure 8 Screenshot of Mily's World
Mily’s World was assigned as homework to 8th grade students (12-14 year olds) in a
school in the suburb of a small city in the Northeastern USA. Sixty six students started the exercise and 58 students completed it. Those students also used ASSISTment in regular basis. There were 16 math questions and 12 survey questions and one open ended feedback question. Since we considered addition of game-like properties as both a cognitive intervention and an emotional one, we wanted to see if this is preferred by students who have preference for real-world problems and using pictures for learning math. We asked them these questions before using the tutor:
Do you find real-world examples helpful for solving math problem? a) Yes, examples are helpful b) No, they make it more confusing Do pictures help you learn math?
29
a) Yes, pictures help me b) I am not sure c) No, pictures don’t help me
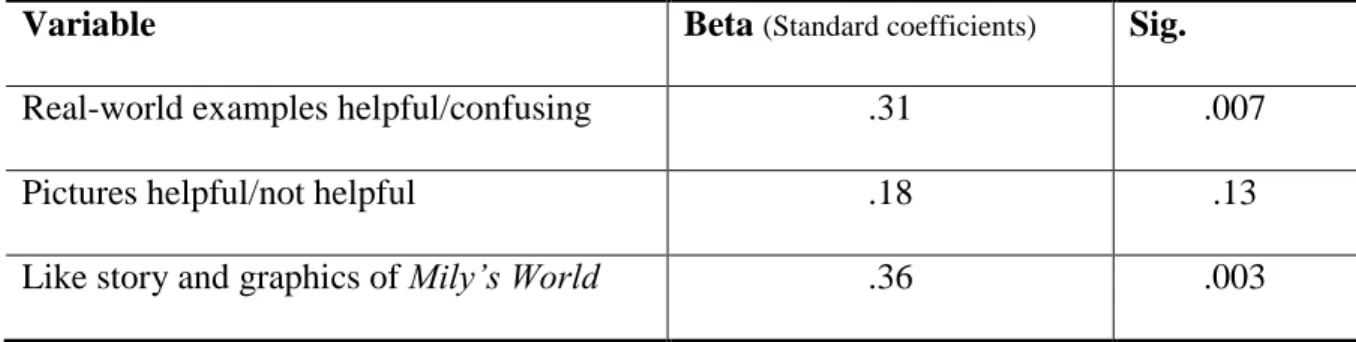
We later asked the students about their experience with Mily’s World. On the question of whether they like Mily’s World, 20% said they liked it, another 20% said they did not like it and 60% said they find it ok. When we made a regression analysis between liking Mily and students‟ other survey responses (Table 1), we found that liking is dependent on whether they liked the story and graphics of Mily (emotional interest) and also on whether they find real world examples helpful or confusing (cognitive aspect). The open responses from students also revealed that some students found the mapping of math content to real-world scenario helpful while other found it confusing.
Table 1 Linear regression analysis, Dependent variable: like_Mily‟sWorld (R Square= 0.35)
Variable Beta (Standard coefficients) Sig. Real-world examples helpful/confusing .31 .007 Pictures helpful/not helpful .18 .13 Like story and graphics of Mily’s World .36 .003
We also asked students about their preference between Mily’s World and Assistment. 52% preferred Mily’s World, 13% preferred Assistment and 35% had no preference. This question was asked in the middle of the exercise instead of the end as we wanted to include the students who do not finish the exercise (who are more likely to dislike it, and therefore important to include in our study). So, their preference of Mily’s World can be a
30
factor of relative difficulty (questions ordered in increasing complexity in Mily’s World) along with the novelty effect.
Based on students‟ open responses, we found that the students generally liked the
interactive approach of using pictures and feedback, but felt that the story was not age-appropriate for them. “The story was a bit childish, but it was clever how everything was
incorporated. I found everything easy”. This was our first iteration of finding the optimal
point in the tutor-game space.
Lessons learned
This was our first iteration in our quest to find an optimal point in tutor-game space. We had started from very a conservative point with minimal game-like elements. Our first question was if we made this interesting enough as to engage students. Based on students‟ feedback, we found that we failed to make it engaging enough for all students.
The major concern and complaint of students was that the narrative was not age appropriate and appeared rather simple. We had used a younger protagonist (around 10 years old) so that students would be willing to help her solve her problems. However, students did not like this approach and found the character and content too young for them. According to theory on aspirational desire, children like to feel they are more grown up than they really are and prefer to have their character a bit older than they are. When a product seems too babyish, a child will be insulted and will not want to have anything to do with it [33]. Based on the students‟ reviews, we created a new version of tutor called: Monkey‟s revenge. We created a new character the same age as the target
31
students and added mischief and humor to make the narrative more interesting. We also made the user interface more responsive to user input.
Experiment 2: Monkey’s revenge
Our aim is to assess tutor with game-like properties overall and each game-like element individually. To make this comparative assessment and analysis, we created four different versions of Monkey‟s Revenge (described on pages 8-11) with different combinations of game-like elements. All versions had same 16 math problems in the same sequence. Students also get the same hints and bug messages.
Condition a: Monkey’s revenge
This is the full version of Monkey‟s Revenge with all the game-like elements we
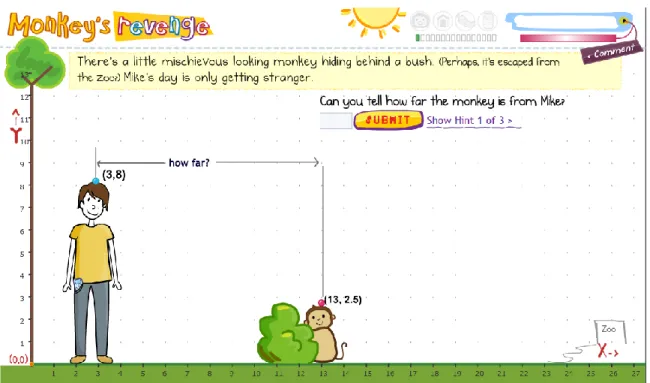
described in Section 4. Figure 9 demonstrates a problem in the tutor where Mike finds a monkey hiding behind a bush that looks like he escaped from a zoo. Students have to calculate the distance between Mike and the monkey based on the coordinates of their heads. Afterwards, Mike wants to befriend the monkey as he is feeling lonely (Figure 6) and decides to name the monkey.
Condition b: Monkey’s Revenge without visual feedback
This tutor version (Figure 12) has no visual feedback. In full version (Figure 12), there would be visual feedback on students‟ correct and incorrect response. For example, if
student gives incorrect value of slope, lines with the wrong slope would be drawn on the graph (in Figure 12, two lines leading down and to the right) and if the student gives the
32
correct response, a ball would hit the monkey and he would make a „hurt‟ face. In the
version with no visual feedback, students receive only text feedback.
Condition c: Monkey’s Revenge without narrative
This tutor version had all the activities and pictures but the activities were not tied together in a story. For example, students have to calculate the distance between Mike and monkey based on the coordinates on their head (Figure 10). But there is no narrative element present in tutor version a as illustrated in Figure 9 and Figure 6.
Condition d: Basic tutor
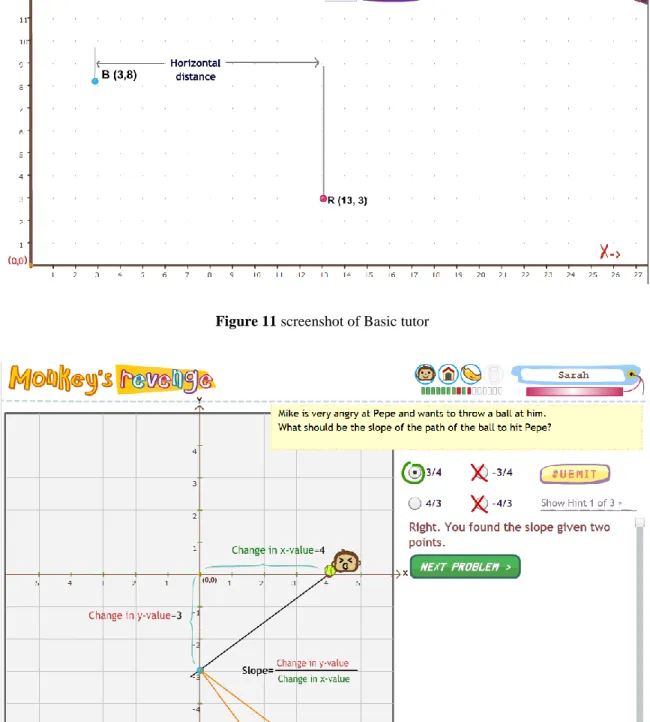
This is a basic tutor without any game-like elements. The problems are abstract math problems without any context, pictures and narrative. Even though they receive the same hints and feedback, they do not get immediate visual feedback present in previous two tutors. Figure 11 shows the problem where students have to calculate horizontal distance between two points based on their coordinates.
33
Figure 9 screenshot of Monkey's revenge with all game-like elements
34
Figure 11 screenshot of Basic tutor
35
Figure 13 Screenshot of Monkey's Revenge without visual feedback
Hypotheses
We had four main hypotheses for the experiment.
I. Tutor with game-like elements lead to higher student engagement and satisfaction compared to basic tutor.
II. Tutor with game-like elements lead to higher learning gain compared to basic tutor. III. Individual game-element such as narrative and visual feedback lead to higher student
engagement and satisfaction.
IV. Individual game-element such as narrative and visual feedback lead to higher learning gain
36 Participants
A total of 297 middle school (12-14 year olds) students from four Northeastern schools of the United States participated in this study. They were randomly assigned to the four groups. The randomization was within each class. One fifth of students used this as homework while the rest did it as a classroom activity. We excluded data from the students (9, 7, 9, 11 from conditions a, b, c, d respectively) who did not complete the exercise.
Data collection
We collected data in the following categories.
Survey questions: We asked the students 16 survey questions in a 5 point likert scale from “strongly disagree”(1) to “strongly agree”(5). The survey involved questions on
students‟ attitude towards math, pedagogical preference, experience within tutor and their liking and satisfaction with the tutor. We asked some questions before they started the exercise, some questions while they were doing the exercise and some after they completed the exercise. The students were also allowed to leave open feedback on the tutor.
37
Figure 14 Screenshot of a page with survey questions
Performance data: We logged students‟ activity and performance within the tutor such as the number of hints asked, attempts made and attempt time.
Pre-test and post-test: The students were asked 8 item open-response questionnaire as pre-test and the same set as post-test. We collected pre/post-tests from only 216 students and 51 students did not complete the post-test. Thus, we had data from 165 students which was graded by the experimenter, blind to the student‟s tutor condition. The correlation between pre-test and post-test is 0.6(p<0.01) and correlation between pre-test and pre-post gain is -0.48(p<0.01).
38
Figure 15 Screenshot of questions asked as Pre and Post-test
7. Results: comparing tutor versions
We wanted to compare data from different tutor versions in terms of students‟ liking and satisfaction, learning gain and other measures such as cognitive overload and time overload.
39
Table 2 Students‟ data across experimental conditions (means and 95% CI))
Tutor Like tutor
(max 5) LikeTutorCombined (max 19) Learning gain Posttest-Pretest (max 10) a. Monkey‟s revenge (N=62) 3.9±0.3 13.5±1.1 0.41±0.6(N=34)
b. without visual feedback (N=69) 3.8±0.3 13.3±1 0.88±0.6(N=46)
c. without narrative (N=63) 3.6±0.3 11.7±1.2 0.31±0.6(N=41)
d. Basic tutor (N=67) 2.8±0.3 9.7±1.2 0.45±0.6(N=44)
Liking and satisfaction
In terms of liking the tutor, we found a gradient across increasing levels of being game-like. However, statistically, the three groups with game-like elements are similar to each other and different from Basic tutor. We also asked if students liked specific elements such as story and graphics. The mean responses were 4.0 (N=101) for story and 4.0 (N=158) for pictures. The following is sample of students‟ open comment feedbacks.
“I liked how the monkey was brought into the story and how I got to give him a name. Also I liked how the story went with the coordinates and it wasn’t too difficult but helped me learn. Some of the problems were confusing though.”
“You made this exercise fun by putting in pictures, words and a story! These problems made me want to do more; I was always excited for what might happen next!”
“I liked the pictures, but some of the questions were pretty confusing. You could word the words a little better.”
“I think that the problems are challenging, but they could be harder. The storyline is great, same with the pictures. It would be great if the game was more interactive in a learning manner.”
“The monkey was very cute and usually I have a problem focusing but this helped me stay focused because I liked it a lot. Thank you!!! :)”
40
“This was very fun. I enjoyed playing it. I liked being able to customize my characters name, and it made it more fun to play. Also it made learning a little more interesting. The monkey was mean though.”
“I can’t do these problems. I didn’t like the pictures or scenario. I already have low self esteem.”
We think that running such a study as homework would be a better design than classroom activity, as some students in Basic condition may feel they got an unfair deal, as
illustrated by the following feedback:
“I did not like this program. It was boring and I wish I got monkeys revenge and I could have named my monkey Dr. wiggles. It would have been more fun and exciting if Dr. wiggles stole my phone.”
Based on students‟ rating and open feedback, we can conclude that adding game-like elements increased students‟ liking and satisfaction with the tutor. Though this finding
may seem obvious, we had made a very conservative progression from tutor towards game and were concerned that we would not be able to attain engagement.
Figure 16 ratio of students based on their response across likert scale (1-5) on statement "I like this tutor" 0 0.05 0.1 0.15 0.2 0.25 0.3 0.35 0.4 0.45
Monkey's Revenge Without visual
feedback
Without narrative Basic tutor
R ati o of r esponses
Ratio of students based on their response across likert scale (1-5) on statement "I like this tutor"
1 2 3 4 5
41 Learning gain
We were not able to find any conclusive results or pattern in terms of learning gain. We think that there are a couple of main reasons for this inconclusive result. First, the intervention was brief and it involved different skills. Hence, students did not have enough time to practice. Second, we used the same set of questions as pre-test and post-test which might be a reason that students were negligent while doing the post-post-test as they had recently done the pretest.
Cognitive overload
We were concerned that adding narrative and pictures may pose cognitive overload among students. On the survey question, “I found the problems difficult because of the story and pictures”, students‟ mean response was 1.9 (N=187). The mean correct
responses among the experimental groups are almost the same (9, 10, 10, 9). So, we are assuming that pictures and story might not have added difficulty, at least to solve the problems that students had prior knowledge on. However, we would like to have a better way of assessing cognitive overload.
Time overload
One of our goals is to make narrative captivating without making it detailed and long. Students in all three groups spent around 13 minutes on solving the problems. Students in the narrative condition spent 2 more minutes in additional story.
42
8. Results: Causal modeling
Beyond making confirming analysis of the overall effect of this intervention in student satisfaction and learning, we are also interested in making exploratory analysis of the user data to understand interrelationships between student characteristics and tutor variables. Engagement and learning can vary among students along the lines of gender, prior knowledge, and pedagogical preference. In addition, different students use the tutor differently in ways that affect their overall learning. Knowledge of these interrelationships gives us clearer picture of students‟ learning and ultimately will help us further refine the intervention. While exploring such relationships is an established practice in education community, statistical analyses like correlation matrices [Arroyo et al., 2005] and multiple regression [Arroyo et al., 2009] are the commonly used tools to show the associations between different variables. In this study, we are using a causal modeling approach which not only tells us association between the variables but also the direction of associations thus making causal inferences.
Making causal inferences based on non-experimental statistical data has been a controversial topic [Freedman, 1987, Rogosa, 1987, Denis, 2006]. Randomized controlled trials are the standard approach to take care of intervening third variables so that we can safely make causal claims. However, recent works on probability and philosophy [Pearl, 2009, Sprites et al., 2001] has given us ways to infer causal inferences based on observational data making certain causal assumptions. As a simple example, imagine if we find that wet grass is correlated with both rain and sprinkler but rain and
43
sprinkler are not correlated with each other; we can then claim that it is in fact rain and sprinkler causing wet grass but not the other way around. If, for example, wet grass caused sprinkler and rain, then we would expect to observe that sprinkler and rain correlated with each other. Since we did not observe that, we can reject this model by contradiction. However, it is not always possible to infer causality from observed associations; as such systems are frequently underdetermined with multiple causal models being statistically equivalent (Markov equivalence[Pearl, 2009]).
Along with using causal modeling to explore and analyze our data, we will be evaluating the causal modeling approach itself. We will compare it against the standard statistical approaches of correlation and multiple regression.
Causal models: Causal models are graphical models that make the additional assumption that the links between nodes represent causal influence. By causal, we mean that a link AB indicates that if we intervene and change the value of A, then B will change. For example, students in a higher grade are generally taller than students in a lower grade. However, there is no causal link between a student‟s grade level and height. That is, if we
intervene and promote a student three grade levels, we should not expect him to suddenly grow a foot taller. Thus, there is no causal relationship. In fact, this effect is how we define a causal relationship: manipulating the cause should have an influence on the effect. If it does not, the two variables are merely associated with each other (as are height and grade level). Causal modeling is a generic name used for statistical methods like path analysis and Structural Equation Modeling (SEM), and represents both the technique used and the assumptions underlying the analytic approach.
44
We conducted our experiments through the free software package TETRAD [Glymour et al., 2004], which is designed to simplify the construction of causal models. It supports both Bayesian networks and SEM. For this work, we made use of its SEM capabilities.
Variables in causal modeling
We asked a total of 16 survey questions about students‟ attitude towards math,
pedagogical preference, experience within tutor and enjoyment and satisfaction with the tutor. We used a five point Likert scale from „strongly disagree‟ to „strongly agree.‟ We
then used factor analysis to reduce the variables into six categories:
likeMath: “Mathematics is interesting.”; “I enjoy the challenge presented by Math problems.”
mathSelfConcept: “I am afraid of Math.”; “ I am afraid of doing word problems.”; “I enjoy the challenge presented by Math problems.”
pedagogical preference: “I like to learn from Computers rather than books.”; “I find real
world examples helpful for learning Math.”
tutorHelpful: “This helped me learn.”; “I found the hints helpful.”; “These problems
helped me learn about slopes.”
tutorConfusing: “I find the questions very confusing.”
likeTutor: “This tutor (Monkeys revenge) looks interesting.”; ““I liked this tutor.””; “I
will recommend this tutor to a friend learning coordinate geometry.”; “This is better than the computer math programs I have used before.”; “The problems were boring.”
45
From students‟ log data, we calculated variables like %correct (ratio of correct problems
to total problems); avgAttemptTime (average time student spent on each attempt) and avgHints (average number of hints students asked on each question).
Along with other variables gender, game-like, preTestScore (students‟ score on pretest) and prePostGain (students‟ gain score from pre-test score to post-test score), we had a total of 13 variables.
Causal modeling and Correlation matrix
Based on the data we collected, we used TETRAD with the PC search algorithm to generate a causal graph (Figure 17). Causal model has basically four types of associations:
AC (A has direct effect on C)
ABC (A has indirect effect on C through mediating variable B)
ABC (A and C have spurious association since they are correlated but not causally related, and B is the confounding variable)
ABC (A and C are independent of each other)
46
We also generated a graph based on correlation matrix (Figure 18). We computed the correlation of every variable against each of the other 12, and added a link in the graph whenever the correlation was statistically reliable.
Correlation is relatively lenient about making associations whereas causation is strict, as it only puts a link after controlling all other variables in the model. In other words, the link from game-like to likeTutor in Figure 17 indicates that there is no variable, that when used to compute the partial correlation, that can remove this relationship. From figure 17 and Figure 18, we see that, due to ensuring no variable(s) can remove the link, causal modeling has far fewer links than the correlation model. When causal model does not link two nodes, it might have correctly identified absence of link, we would call that a true negative. On the other hand, it might have missed a link that should be there which we would call a false negative.
True negatives (indirect and spurious associations): Correlation is not causation as there might be possible confounders causing the spurious association (see definition iii, above), and causal modeling controls for all third variables regarding them as possible confounders. From the correlation matrix, we see that likeTutor and %correct are correlated which would suggest that students who like the tutor performed better. This result would have been an evidence for student engagement, since students who liked the tutor are presumably more engaged while using it. But the causal model (Figure 17) infers that this is a spurious association confounded by likeMath. Students who like math tend to like tutor more and to have better performance. Once we control for likeMath, there is no relation between likeTutor and %correct.
47
Figure 18 Graph based on correlation matrix
Still, the causal model is limited to assertions about the observed variables as there might be other confounders which we have not observed. After controlling for all possible confounding variables within the system, the causal model has inferred that
likeMathlikeTutor. But it is possible that being agreeable on survey questionnaire might be an unobserved confounder affecting both variables.
Causal modeling makes distinction between direct and indirect association. likeMath
and avgHints are negatively correlated (-0.3**) which suggests that the students who like math ask fewer hints. But once we control for %correct, that correlation is gone (see Figure 17). So, we can conclude that the students who like math ask for fewer hints only because they already know the correct responses and so do not need as much help. The students who like math and have few correct responses will ask for as many hints as a student who does not like math and has few correct responses.
48
False negatives (reduced statistical power and multicollinearity): Controlling on third variables reduces statistical power and we might get false negatives if we have few data. We made a small simulation and found that adding more data removes false negatives without adding false positives. But when the independent variables are correlated among themselves, we face the problem of multicollinearity. Multicollinearity is a statistical phenomenon in which two or more predictor variables in a multiple regression model are highly correlated. That is, a multiple regression model with correlated predictors can indicate how well the entire bundle of predictors predicts the outcome variable, but it may not give interpretable results about any individual predictor, or about which predictors are redundant with others.
For example: avgAttemptTime is correlated with both %correct (0.3**) and
preTestScore(0.3**). But since, %correct and preTestScore are highly correlated among themselves (0.6**), avgAttemptTime is conditionally independent to both of them. We can see that avgAttemptTime is an isolated node in figure 17; in contrast, the correlation graph (Figure 18) indicates avgAttemptTime is related to both preTestScore and
%correct.
Causal structure, path orientation and domain knowledge
Beyond false positive and false negatives, which simply deal with the presence or absence of a link, we can also examine whether the link orientation is plausible or not. Some of the links had plausible orientations, such as likeMath likeTutorgame-like,
49
which suggests that students who like math also liked the tutor more, and students who had more a game-like tutor reported greater liking. Using the information that likeTutor is correlated with both likeMath and game-like, but likeMath and game-like are independent between themselves, the PC search algorithm correctly identifies that it is not likeTutor
influencing likeMath and game-like but the other way round (see [Pearl, 2009] for a discussion of “colliders” such as this). However, we see that there are other edges which
are incorrectly oriented, such as %correctpreTestScore. Student performance on the tutor cannot have influenced a pre-test that occurred before students began using the tutor.
Correlation underdetermines causality as covariance in statistical data is rarely sufficient to disambiguate causality. Therefore, even after we use search algorithms to find some structure, there are a number of “Markov equivalent” structures. For example, given a data set with just two variables A and B which are correlated with each other, true causal structure can be AB or AB, and there is no way to tell which model is correct. However, we can narrow our search by adding domain knowledge. In TETRAD, we can add domain knowledge in the form of knowledge tiers which represent the casual hierarchy. Causal links are only permitted to later tiers, and cannot go back to previous tiers. We used the following knowledge tier based on our knowledge of assumed causal hierarchy and temporal precedence.
i. Gender
ii. Game-like, mathSelfConcept iii. likeMath, Pedagogical preference iv. preTestScore
v. %correct, avgAttemptTime, avgHints, tutorConfusing, tutorHelpful vi. likeTutor
50 vii.prePostGain
We are taking the temporal order of when variables occurred, which is not necessarily when they were measured. For example: we asked students‟ experience with tutor
tutorConfusing, tutorHelpful after they finished the tutor activity. Still, we have placed them in the same tier as the tutor activities like avgAttemptTime, avgHints since students‟
experience would have affected their tutor activities. Since the pairs (likeMath, mathSelfConcept) and (tutorHelpful, likeTutor) are highly correlated, we placed them in different tiers even though we cannot specify which one precedes which.
51
We see from Figure 17 and Figure 19 that adding domain knowledge not only fixes the path orientations (preTestScore%correct), but have changed the whole causal structure adding some new causal links (gendermathSelfConcept, pedagogicalPreferencetutorHelpful, correctavgAttemptTime).
At first, it may appear that knowledge of causal hierarchy only helps to orient the edges specifying which one is cause and which one is effect. I.e. If A is higher than B and we found that A and B are correlated, then AB.
However, besides distinguishing variables as potential causes and effects, the domain knowledge also restricts the set of variables to be considered as confounders and mediators. Aside from improving efficiency, this approach also results in stronger inference. Let us consider an example where we are interested to know the relation between two variables A and B. We have the following knowledge tiers:
Tier 1: C Tier 2: A Tier 3: M Tier 4: B Tier 5: E
We should partial on C to consider it as a potential confounder, and on M as a potential mediator. But variable E cannot be a confounder or a mediator and conditioning on E is not required. In fact, we should not condition on E as we might get a false positive. If the true causal model of A, B, and E is AEB, where A and B are independent but have E as a common effect. However, if we compute the partial correlation of A and B, partialing out E, then we have produced a statistical correlation between A and B.
52
Sometimes, we do not know about the causal hierarchy of the variables we are trying to analyze and may not know which is the cause and which is the effect, but having information of the causal hierarchy of third variables, such as whether they are a potential confounder or a potential mediator, can help infer if there is any causal path between the variables of interest. We can illustrate this with a concrete example in education.
Suppose we have observed that engagement and learning are correlated, but want to understand the causal relation between them. Imagine there are two other variables, prior knowledge, a potential confounder (since it is a possible cause of both), and performance, a potential mediator (since it co-occurs with both). Consider two scenarios: if partialling out prior knowledge removes the correlation, then we know there is no causal relationship between engagement and learning, and the causal structure is engagementprior knowledgelearning. On the other hand, if partialing out performance removes the correlation between engagement and learning, then there is still an indirect causal effect between the two, either engagementperformancelearning, or learningperformanceengagement. So even though we were unable to provide information about the causal direction between engagement and learning, by providing information about other variables we are able to better differentiate if there is any causal relation.
Interestingly, adding domain knowledge can also address the problem of multicollinearity. preTestScore and %correct were correlated with each other (Figure 18). Therefore, we did not see their effect on avgAttemptTime in Figure 1 because when it calculated both partial correlations (preTestScore, avgAttemptTime | %correct) and
53
(%correct, avgAttemptTime | preTestScore) there was no statistically reliable correlation remaining due to the colinearity of %correct and preTestScore. However, providing the domain knowledge provided powerful information: since we have set preTestScore on higher causal tier than %correct, %correct cannot be a possible confounder or mediator and therefore, the partial correlation (preTestScore, avgAttemptTime | %correct) is not calculated. As a result, the link from preTestScore to avgAttemptTime is placed based on correlation (preTestScore, avgAttemptTime) while controlling for other variables aside from %correct. Thus, by excluding %correct as a confound or mediator, we are able to infer additional causal links.
Causal modeling and multiple regression
Causal modeling is a sophisticated extension to multiple regression and basically adds two things to multiple regression.
a) Two-dimensional graphical representation instead of flat one-dimensional b) Causal assumptions to direct inference algorithm
We are using an example of multiple regression to illustrate this.
likeTutor = 7.8*tutorhelpful + 5*game-like - 3.2*tutorConfusing + 3*likeMath + 2.2*pedagogicalPreference -0.5 (Equation 1)
Causal model employs a series of multiple regression and is two-dimensional rather than one. Addition of one more dimension offers the following benefits:
Direct and indirect effect: Multiple regression only looks at direct effect but fails at identifying indirect effects. For example: we can see from causal model (Figure 19) that