Computer Self-Efficacy of GED Examinees and GED Test Results
A Dissertation submitted to the Graduate School Valdosta State University
in partial fulfillment of requirements for the degree of
DOCTOR OF EDUCATION
in Adult and Career Education
in the Department of Adult and Career Education of the Dewar College of Education and Human Services
August 2016
Tanya D. Southerlin
M.S., Valdosta State University, 2000 B.S., Valdosta State University, 1997
© Copyright 2016 Tanya Dierdra Southerlin All Rights Reserved
FAIR USE
This dissertation is protected by the Copyright Laws of the United States (Public Law 94-553, revised in 1976). Consistent with fair use as defined in the Copyright Laws, brief quotations from this material are allowed with proper acknowledgment. Use of the material for financial gain without the author’s expressed written permission is not allowed.
DUPLICATION
I authorize the Head of Interlibrary Loan or the Head of Archives at the Odum Library at Valdosta State University to arrange for duplication of this dissertation for educational or scholarly purposes when so requested by a library user. The duplication shall be at the user’s expense.
Signature ________________________________________
I refuse permission for this dissertation to be duplicated in whole or in part.
i ABSTRACT
The purpose of this study was to investigate whether relationships existed
between the degree of computer self-efficacy of examinees and their performance on the computer-based 2014 General Equivalency Diploma (GED) exam. Recommendations for both research and practice were made that addressed potential challenges. The study was developed based on the concerns from the GED community regarding computer-based testing and how it may effect student performance.
The study was conducted at two technical colleges in Georgia and used a convenience sampling process to gather 100 surveys and 15 interviews from first time computer-based GED examinees. Data were collected using the Computer Self-Efficacy Survey for Adults, created by James H. Brown, and interviews conducted by the
researcher. Descriptive statistics, an analysis of variance (ANOVA), factorial analysis of variance tests, and interviews were used for data analysis. Social Learning Theory, created by Albert Bandura (1971), was used for the research study’s conceptual
framework to explain an individual’s perception of his or her ability to use a computer. Overall findings from the statistical analysis of this study indicated that
examinees who had a higher sense of computer self-efficacy scored higher on the Reasoning Through Language Arts and Science sections of the GED exam. Significant relationships were also found to have existed when comparing the examinees’ age and socio-economic status. Younger examinees had higher GED exam scores and reported a higher sense of computer self-efficacy than did the older population on the Reasoning Through Language Arts and Science sections of the exam. For the same sections, individuals who reported a higher annual household income also scored higher on the exams and had a higher sense of computer self-efficacy. Overall males scored higher on
ii
Reasoning Through Language Arts and Science, but there was not a significant difference in the scores. Interviewees felt comfortable taking the exam on computer, did not
experience anxiety or uneasiness, felt confident in their abilities to use a computer, and did not feel they needed to become familiar with the computer prior to taking the exam.
iii TABLE OF CONTENTS I. INTRODUCTION Introduction ...1 Conceptual Framework ...6 Statement of Problem ...7
Purpose of the Study ...7
Research Questions ...7
Significance of Study ...8
Limitations of the Study...9
Definition of Key Terms ...10
Summary ...12
II. REVIEW OF LITERATURE Introduction………13
History of Computer-Based Testing………..14
Historical Background of the GED……….………...15
Theoretical Foundation of Self Efficacy………18
Triadic Reciprocal Determinism……….………...……19
Self-Efficacy Judgments……… 21
Development of Computer Self-Efficacy……….………... 22
The Digital Divide……… .28
Measurements of Computer Self-Efficacy………...30
Murphy Computer Self-Efficacy Scale…….……….…………... .31
Compeau and Higgins Computer Self-Efficacy Scale….……….………… .32
iv
Summary……… ………..……….….35
III. RESEARCH DESIGN AND METHODOLOGY GED Examination Process…..……… ………...36
Research Questions……….... 37
Description of the Population ………..………. 37
Sample……….…...41
Research Method and Design……… 42
Independent Variables………... 43
Dependent Variable………... 44
Data Collection Procedures………... .44
Instrumentation………. .45
Analysis of Data……… .48
Guided Interview Protocol……… .50
Summary………... .51
IV. DATA ANALYSIS AND RESULTS Introduction……… ..………..52
Representativeness of Sample………..………..53
Computer Self-Efficacy Survey for Adults and GED Exam Results…… . ……….57
Inferential Findings… ..………..59
Detection of Outliers… ..………....59
Assumptions……… ..……….60
Relationship Between CSESA and GED Exam Results…… . ……….61
v
Assumptions………. .71
Relationship Between Demographics, CSESA, and GED Scores……... .72
Perceived Challenges of Test Participants……… ..………...98
Summary of Findings ...103
V. CONCLUSIONS, DISCUSSIONS, AND RECOMMENDATIONS Introduction……… ..………107
Overview of the Study…… .………108
Description of Sample……...………...108 Procedures……… ..………..109 Conclusions……… ..………110 Discussion……… .………..112 Limitations………. .117 Recommendations……… ...117 REFERENCES……… .………...122 APPENDICES APPENDIX A. Computer Self-Efficacy Scale for Adults (CSESA) ...130
APPENDIX B. Author’s permission to use CSESA ...137
APPENDIX C. Administrative Guidelines for Using CSESA ...139
APPENDIX D. Interview Form ...141
APPENDIX E. GED Test Candidate Rules Agreement ...144
APPENDIX F: Permission to use material from MIS Quarterly in Dissertation Research...147
vi
APPENDIX G: Descriptive Statistics for Computer Self Efficacy Survey ...149 APPENDIXH: Factorial ANOVA Summary Table for the Dependent
Variable Reasoning Through Language Arts………. ...153 APPENDIXI: Factorial ANOVA Summary Table for the Dependent
Variable Social Studies……… ....………..155 APPENDIXJ: Factorial ANOVA Summary Table for the Dependent
Variable Science……… ....…………157 APPENDIXK: Factorial ANOVA Summary Table for the Dependent
Variable Mathematical Reasoning……… ...………159 APPENDIX L: Valdosta State University Institutional Review Board
vii
LIST OF FIGURES
Figure 1: Compeau and Higgins Computer Self-Efficacy Research Mode…… ..……….23 Figure 2: Percentage of students enrolled in 2014 by age group into adult education programs at Ogeechee Technical College (OTC) and for the State
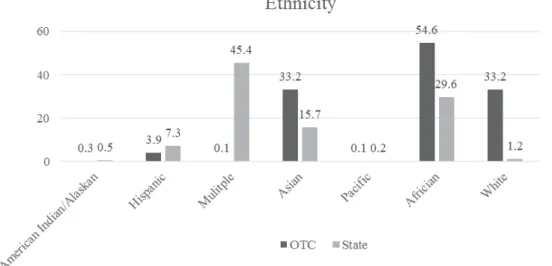
of Georgia……… .………….40 Figure 3: Percentage of students enrolled in 2014 by ethnic group into adult
education programs at Ogeechee Technical College (OTC) and for the
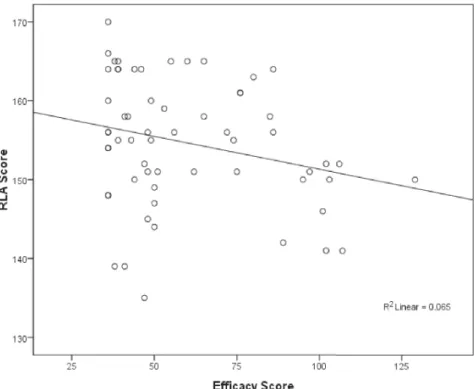
State of Georgia……… .………41 Figure 4: Relationship between scores on the Reasoning Through Language Arts
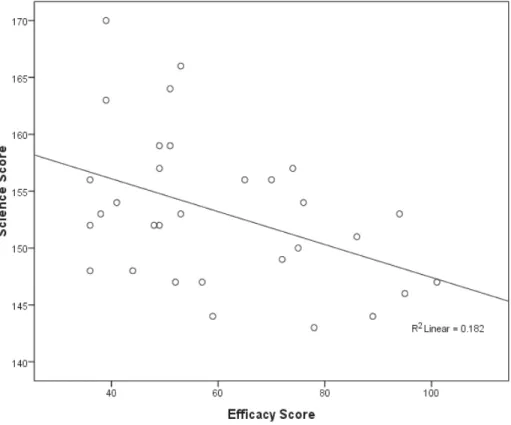
exam and Computer Self-Efficacy Score taken by 60 examinees… .………....64 Figure 5: Relationship between scores on the Science exam and Computer
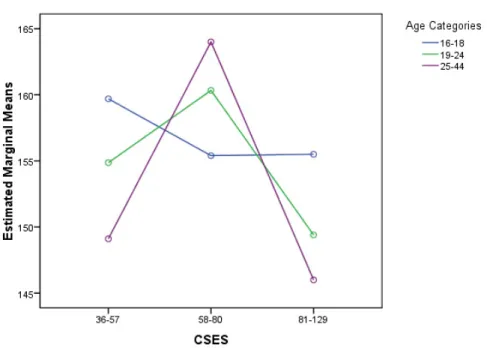
Self-Efficacy Score taken by 30 examinees……… .……….68 Figure 6: Effects of Age and Computer Self-Efficacy Scores on Reasoning
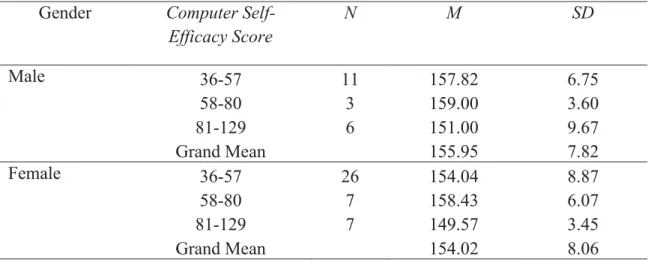
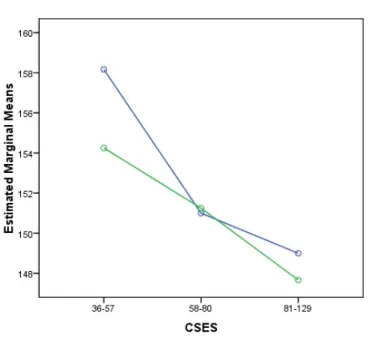
Through Language Arts Exam Scores……… .………..76 Figure 7: Effects of Gender and Computer Self-Efficacy Scores on Reasoning
Through Language Arts Exam Score……… .……….…78 Figure 8: Effects of Gender and Computer Self-Efficacy Scores on Science
viii
LIST OF TABLES
Table 1: Population Percentage with Less than a High School Diploma or
Equivalency………..………...39 Table 2: Demographics of CSESA Survey Respondents………. .…………..56 Table 3: Descriptive Statistics for GED Exam Section Taken……… ..………...58 Table 4: Potential Outliers Based on Outlier Labeling Technique………… ..…………60 Table 5: ANOVA Summary for Reasoning Through Language Arts Scores…… ..……63 Table 6: ANOVA Summary for Social Studies Scores……… .……..65 Table 7: ANOVA Summary for Social Studies Scores without Outlier…… .………….66 Table 8: ANOVA Summary for Science Scores………..…………....67 Table 9: ANOVA Summary for Mathematical Reasoning Scores………..70 Table 10: Descriptive Statistics for Age and Computer Self-Efficacy Score
for Reasoning Through Language Arts Exam Scores………...75 Table 11: Descriptive Statistics for Gender and Computer Self-Efficacy
Score for Reasoning Through Language Arts Exam Scores………78 Table 12: Descriptive Statistics for Socio-Economic Status and Computer
Self-Efficacy Score for Reasoning Through Language Arts Exam
Scores……… ..………..81 Table 13: Descriptive Statistics for Gender and Computer Self-Efficacy Score
for Science……… ..………..89 Table 14: Descriptive Statistics for Socio-Economic Status and Computer
Self-Efficacy Score for Science……… ..…………..93 Table 15: Demographic Representation of Interviewees Compared to Those
ix
ACKNOWLEDGEMENTS
I am sincerely grateful to my committee for assisting and guiding me through the dissertation process. Without your support and encouragement, I would not have been successful. Dr. Reynaldo Martinez, you have been my rock during my time as a doctoral student at Valdosta State University in both your guidance as my advisor and my
dissertation chair. Dr. Ellis, you were one of the most influential and passionate
professors I had during my time in the program. You are a truly inspirational instructor. Dr. Steven Downey you made the research seamless and have been my foundation. Dr. Michael Capece, my educational experience with you, at Valdosta State University, stems decades and I am truly grateful and humbled by your acceptance to serve on my
committee.
My completion of this project could not have been accomplished without the approval from Ogeechee Technical College and Coastal Pines Technical College to conduct the study. A very special acknowledgment to April Hennecke for assisting me in the process and never wavering in her commitment to providing me with the support necessary to make this project as success.
x DEDICATION
1
Chapter I INTRODUCTION
The conversion of the General Equivalency Diploma (GED®) paper-based test to a computer-based test has been a topic of discussion for over 20 years. As was the case with many large-scale test developers, GED Testing Service® began investigating the transition of the GED exam from paper to computer tests. “A significant concern then arises as to whether offering only a computer-based format of the GED exam will reduce the number of candidates taking the GED exam because of possible variation in the candidate population’s level of familiarity with computers” (George-Ezzelle & Hsu, 2006, p. 2).
Parshall and Kromrey (1993) brought an analysis of examinee characteristics associated with mode effect on the high-stakes Graduate Record Examination (GRE) test to the forefront of discussion in their presentation at the Annual Meeting of the American Educational Research Association. Until this time, only the ACCUPLACER was being delivered on computer; developed and administered by the College Board in 1990, this exam was a lower stakes college admissions entrance exam (Luecht & Sireci, 2011). Although various exams would follow the process of becoming computer-based or computer adaptive (Luecht & Sireci, 2011) it would not be until 2006, when the GED Testing Service published results of the GED candidate computer familiarity study, that the discussion of computerizing the GED would become conceivable. Using a logistic regression model, data were analyzed to assess correlations “between computer comfort,
2
age, highest grade complete, test format preference, and likelihood and testing if the GED exam had been available only in computer-based format” (George-Ezzelle &
Hsu, 2006, p. 11). George-Ezzelle and Hsu’s research study produced initial results for GED examinees’ computer familiarity and although there were positive results for the study, limitations were identified by the researchers. The majority of the responses indicated that they had prior experience with computer-based exams, worked on a
computer at least once a week, preferred a computer-based format and if given the option would have taken the GED if only available on computer (George-Ezzelle & Hsu, 2006).
As American businesses continued to demand a more educated labor force, the GED Testing Service® implemented the new exam as a means to provide a workforce to meet those needs. The GED Testing Service® contracted with Pearson Vue testing services to ensure that earning a GED would not only be equivalent to a high school diploma, but also be the starting point for college admissions. Additionally, the new test would help adults remain competitive in the workforce. States across America slowly migrated to the new mode of testing with reluctance and apprehension (GED Testing Service®, 2013b). The new GED exam was implemented nationwide in January 2014, leaving the computer-based exam as the only testing option for examinees.
General Education Development computer-based testing has become a nation-wide concern as the fear of taking a test on the computer rises (Clymer, 2012). “Many recognize the need for computerizing the GED exam as well as the importance of
computer literacy in the marketplace. Nonetheless this change may present challenges in effectively serving test takers that lack access to and proficiency with computers” (Clymer, 2012, p. 5).
3
In the years 2012 and 2013, there was a state-wide initiative for Georgia to eliminate paper-based testing; and according to discussions this researcher had with both test takers and adult education staff, many were apprehensive about the migration to computer-based testing. Taking the GED on computer versus the traditional paper-and-pencil format was perceived as posing challenges for certain populations due to their lack of computer literacy and low self-efficacy levels. “Since access to computers has long been a problem for many adult education providers, this computer literacy need is an issue that will warrant serious attention” (Clymer, 2012, p. 5).
In their study of secondary analysis of data in 1993, Parshall and Kromrey made the suggestion that continued research be conducted to determine if test mode had any impact on test performance. Although their research focused on the test mode effect, one of the analyses that was conducted was to determine if any relationship existed between mode effect, variety, and amount of computer experience by asking the following questions: “how often do you use a computer, how often have you used a mouse on a personal computer and, for what kinds of activities do you use a personal computer” (Parshall & Kromrey, 1993, p. 22). Although results suggested minimal impact to support a relationship between computer experience and test mode effect, various limitations were noted, due to the design of the study, by the researchers. It should be recognized, however, that this 1993 research study was conducted prior to Compeau and Higgins coining the term “computer self-efficacy” and the development of the initial test of measurement. It could be implied that Parshall and Kromrey were attempting to investigate computer self-efficacy levels prior to creation of the concept.
4
The variables investigated in this study showed only a relatively weak
relationship to mode effect. Further investigation tailored to this question should be conducted in order to determine those variables which distinguish those examinees whose performance is affected by mode of test administration from those whose performance is not (Parshall & Kromrey, 1993, p. 39).
According to Al-Amri (2008), there had been minimal research conducted on the association between examinees’ computer familiarity and performance on computer-based testing. Because the GED Testing Service® implemented the new assessment in January 2014, research should be conducted to investigate if potential problems associated with computer-based testing existed.
While the needs of this testing program have been established psychometrically, it is important to consider other points of view. Issues affecting examinees must be evaluated as well, such as prior experience with computers, proficiency, and examinee comfort, as these factors may act as mediators or moderators in performance across modes (Poggio, Glasnapp, Yang, & Poggio, 2005, p. 26). An informal survey was conducted at the 2013 Adult Literacy Conference held in October in Atlanta, Georgia. The Assessment Services Coordinator and the Dean for Adult Education at Ogeechee Technical College spoke with colleagues in order to gain anecdotal or personal concerns. Approximately 40 individuals were asked if they were aware of any concerns regarding the implementation of a computer-based only GED exam. Although there were limited statistical data that indicated any concerns surrounding the technical details of the new exam, teachers, directors, state staff, and examiners stated that examinees statewide had voiced concerns that they had limited
5
computer skills and significant computer anxiety that prohibited their interest in
attempting the 2014 exam series. In addition, Clymer (2012) indicated that “preparation programs will have to be revamped to include not only computer literacy and
keyboarding for those without these skills because the new GED will include higher-order thinking skills, which are not the focus of the current GED test” (p. 6).
The 2014 GED exam focused on adult learners by opening doors to college, job training, and career opportunities through an alignment process that was representative of current high school standards delivered exclusively on computer. To ensure all
individuals were ready and capable of employment or transition into post-secondary education, it was imperative that the GED be viewed as comparable to the high school diploma. The 2014 GED Series Test® (2014b) was comprised of the following; 1) Reasoning Through Language Arts (RLA) (estimated 150 minutes to complete), 2) Mathematical Reasoning (estimated 120 minutes to complete), 3) Science (estimated 90 minutes to complete), and 4) Social Studies (estimated 90 minutes to complete). This exam utilized seven different item types: extended response, drag-and-drop, drop-down, fill-in-the-blank, hot spot, multiple choice, and short answer. All of these testing
modules required the examinee to possess at least a basic computer skill level. In addition to using a mouse, test-takers must be able to: scroll down a page, drag-and-drop answers to a graph or chart, navigate between tabs to read passages, type two short answers and two extended responses, use basic word processing tools, select answers or symbols from drop-down menus, and use a virtual calculator (Lipke & Farrell, 2013, p. 8).
6
Lipke and Farrell’s study was used to investigate the extent to which computer-oriented self-efficacy influenced examinees’ performance on the computer-based GED exam. Concerns needed to be investigated and addressed so individuals taking the computer-based GED can be successful and remain competitive with high school graduates. Identified concerns with the 2014 version of the computer-based GED exam could lead to testing modifications and/or computer skills training which could be implemented in the local GED centers.
Conceptual Framework
Self-efficacy is rooted in Social Learning Theory and was founded by Albert Bandura as a means to explain an individual’s perception of his or her ability to deal with certain situations (1971). Social Learning Theory is multi-dimensional, therefore this research only focused on the role of cognitive factors in individual behavior. Bandura promoted two sets of expectations as cognitive forces that drove an individual’s behavior. One is outcomes and the other is self-efficacy. Self-efficacy is a perceived behavior influenced by choice of actions, quality of an individual performance, and the level of persistence (Compeau & Higgins, 1995b). Self-efficacy is the conviction that one can successfully accomplish the behavior required to produce a particular outcome. This concept is grounded in four basic areas including: 1) cognitive, 2) emotional, 3)
motivational, and 4) selective processes. Individuals with weak self-efficacy tend to shy away from tasks they perceive as difficult, have low aspirations with weak goals, and tend to dwell on personal deficiencies rather than focus on overcoming adverse situations (Bandura, 1997). Likewise, according to Compeau and Higgins (1995b) one can
7
generalize that individuals with higher computer self-efficacy would be expected to be able to comfortably use computers and have positive experiences doing so.
Computer self-efficacy was built on Bandura’s definition of self-efficacy as it applied to individuals’ perceptions of their ability to be successful in their utilization of a computer. Compeau and Higgins (1995b), in Computer Self-Efficacy: Development of a Measure and Initial Test, defined computer self-efficacy as “a judgment of one’s
capability to use a computer. The concept is not concerned with what one had done in the past but rather with judgments of what could be done in the future” (Compeau and Higgins, 1995b, p. 192). Their three dimensions to computer self-efficacy are: 1) magnitude, 2) strength, and 3) generalizability.
Statement of the Problem
The problem of this study was the concern that by implementing a GED
computer-based only exam, student performance may be negatively impacted by the lack of computer skills and efficacy. Since the migration to a computer-based only exam minimal research has been conducted to determine if concerns exist with examinees’ ability to be successfully on the GED.
Purpose of the Study
The purpose of this study was to investigate whether relationships existed
between the degree of computer self-efficacy of examinees and their performance on the computer-based 2014 GED exam. Recommendations are made that would address any challenges generated from the study.
Research Questions This study addressed the following research questions:
8
1. What relationships, if any, exist between the computer self-efficacy of examinees and participants’ performance on their initial section of the computer-based GED exam taken?
2. To what degree, if any, do the following demographic factors affect the interactions between computer self-efficacy and a computer-based GED exam?
a) age b) gender c) ethnicity
d) socio-economic status
3. What challenges do GED examinees experience when taking a GED computer-based exam?
Significance of the Study
When computer-based GED testing began, technical colleges in Georgia and across the United States were searching for a means to reduce costs. Computer-based GED testing was the perfect avenue to decrease staff and cut long-term cost, with little regard for issues examinees may have with computer-based testing (Clymer, 2012). Many assumed that there were significant apprehension and concerns with migrating the GED from a traditional paper-based exam to a computer-based exam but there was limited research on which to base this conclusion and additional research needed to be conducted to provide a more concrete understanding. “Future research should focus on the impact of self-efficacy on development of computer skills and on understanding the generalizability of computer self-efficacy” (Compeau & Higgins, 1995b, p. 207). The results of this study will provide greater insight into the relationship between test-takers’
9
computer skills and attitudes and their performance on the new computer-based GED exam.” Further, the results will prompt more discussion surrounding computer-based GED testing and the impact it may have on examinees in Georgia.
Limitations of the Study
The first limitation of this study was the possibility of a small sample size due to the desire to collect data from first time computer-based GED examinees. It was difficult to predict the number of examinees that would participate in the study, therefore by gathering data from surrounding technical colleges it increased the sample size and addressed the limitation issue. In addition, convenience sampling was used which limits the generalizability of the data. The third limitation of this study was the nature of the student-reported data. Relying on perceptual data is subjective and although this study focused on examinees’ feelings and emotions, it can be assumed that a concern could exist due to perception. Perceptual data limited the degree of confidence to which the conclusions could be inferred. In addition, the participants of this study were from one geographical region of Georgia, and outcomes may not be generalizable for the entire state.
The research study gathered data that produced statistical findings that focused on computer self-efficacy and concerns individuals had regarding taking the exam on
computer. The statistical findings from the study can be use to provide valuable
information regarding possible modifications or changes to the ways people prepare for the new exam. “With the new test being delivered exclusively on computers, adult literacy providers must consider teaching computer skills in order to prepare learners for testing, if they have not already” (Lipke & Farrell, 2013, p. 10).
10
Definitions of Key Terms
This section lists and provides conceptual and operational definitions of key terms used in this study:
2002 Series GED Test: Version of the GED exam given from 2002 to December 2013 (GED Testing Service®, 2014a).
2014 Series GED Test: Version of the GED exam beginning January 2, 2014 (GED Testing Service®, 2014a).
Coastal Pines Technical College (CPTC): A unit of the Technical College System of Georgia (Technical College System of Georgia, 2014d).
Computer self-efficacy: Compeau and Higgins (1995b) were the first to coin the term computer self-efficacy and referred to it as “a judgment of one’s capability to use a computer” (p. 192).
Demographic factors: Characteristics assigned to age, gender, ethnicity, and socioeconomic status (Brown, 2008).
Examinee: An individual who is taking the exam on computer (Parshall & Kromrey, 1993).
GED Analytics™: Real time database created by GED Testing Service® used to create and generate reports for GED examinees nationwide (GED Testing Service®, 2014a).
GED Testing Service®: A joint venture between the American Council on Education (ACE) and Pearson. The new organization was formed in 2011 and was modeled to represent a public-private partnership” (GED Testing Service®, 2014b).
11
Georgia Adult Learner Information System (GALIS): Statewide data system used to identify students enrolled in Adult Education Programs in Georgia (Technical College System of Georgia, 2014b).
TCSG Navigator: New data system for GED testing in Georgia that replaced PASSPORT effective April 1, 2014 (Technical College System of Georgia, 2014c).
Ogeechee Technical College (OTC): A unit of the Technical College System of Georgia (Technical College System of Georgia, 2014d).
Pearson Vue: Provider of computer-based testing solutions for information technology, academic, government, and professional testing programs, including the GED (Pearson Vue, 2014).
Preparation programs: State supported adult education programs operated through a technical college in Georgia (Technical College System of Georgia, 2014a). Self-efficacy: Self-efficacy is situational and highly influences people’s
“decisions, goals, their amount of effort in conducting a task, and the length of time they persevere through obstacles and difficulties” (Khorrami-Arani, 2001, p. 18).
Social Cognitive Theory: Albert Bandura's (1971) theory that conceptualizes cognitive, vicarious, self-regulatory, and self-reflective processes as they relate to human motivation and behavior (Bandura, 1997).
Technical College System of Georgia (TCSG): Directs Georgia’s technical colleges, academic, adult education, and workforce development programs (Technical College System of Georgia, 2014d).
12
Walk-in examinee: A GED examinee who has not received any preparation from a state supported adult education center (Technical College System of Georgia, 2014a).
Summary
This chapter offered a brief introduction to computer self-efficacy and the
reasoning behind the need for further investigation into concerns associated with computer self-efficacy levels and performance on the computer-based GED exam.
Limited research has been conducted on the perceptions individuals have of their own ability to utilize a computer for computer-based exams. With technology advances consistently on the rise, the anticipation is that computer skills will continue to be necessary in order to secure and maintain employment. The GED exam has been no exception to this, as the nation transitioned to a solely computer-based exam in 2014.
13 Chapter II
REVIEW OF THE LITERATURE
This research study was designed to assess computer-based GED examinees’ levels of computer self-efficacy and the influence these had on their performance. A review of literature was conducted to create an understanding of the concerns
surrounding computer-based testing, generate a foundation for the study, and to assist in identifying gaps that may exist in the research. The following topics were reviewed to ensure a comprehensive review a literature was conducted 1) the historical context and background of the GED test, 2) the theoretical foundation of self-efficacy, 3) Bandura’s concept of self-efficacy, 4) the founding of computer self-efficacy, and 5) measurements of computer self-efficacy.
A list of topics were used to complete the research for this study which included: application of Social Cognitive Theory, training for computer skills, overcoming
computer anxiety for adult learners, computer self-efficacy, E-learning self-efficacy, technostress, self-efficacy scales, validations, Social Cognitive Learning, social
modeling, digital divide, and behavior modeling. The following databases were used to research the above topics: ERIC, GALILEO, Google Scholar, Proquest, VTEXT, (Networked Digital Library of Theses and Dissertation), Research Gate, GED Testing
14
Service®, Pearson Vue, GED Analytics™, GALIS (Georgia Adult Learners Information System).
History of Computer-Based Testing
The first large-scale exams to become computer-based appeared in 1985; the United States Army’s Computer Adaptive Screening Test, the College Board’s Computerized Placement Test, currently known as the ACCUPLACER, and the Computerized Adaptive Differential Ability Tests of the Psychological Corporation (Luecht & Sireci, 2011, Salkind, 2010) were among the first. The ACCUPLACER was considered a low-stakes test, although it was viewed as the first transition to computer-based testing for the educational field. According to Luecht and Sireci (2011), the first high-stakes test that was given as a computer-based test was the certified network engineer (CNE) examination. That exam was administered in the Drake Prometric sites beginning in 1990 and was subsequently followed by the Education Testing Services Graduate Record Examination (GRE) in 1992 at Sylvan Learning Centers. Since that time, various agencies, companies, and education institutions have migrated to computer-based testing, to include National Council Licensure Examination (NCLEX) for nursing students, the Armed Services Vocational Aptitude Battery (ASVAB), and the Graduate Management Admission Council (GMAT).
Although numerous concerns surrounding computer-testing existed, the desire to migrate towards a more accessible means of test administration outweighed those issues. Designing an exam to meet the technical specifications can be costly, and the process must also take into account the importance of maintaining the validity and reliability of the test questions. Delivering an exam on computer has transformed from simple
15
computer-based fixed tests (CFT) to more complex designs of adaptive testing models (Luecht & Sireci, 2011). Earlier forms of computer-based testing consisted of testing terminals that were directly attached to a mainframe computer, making the process of mass distribution cost prohibitive. With computers being readily accessible, including laptops, tablets, and even smartphones, computer-based testing has exploded onto the market. Various types of computer-based exams were offered in secondary and post-education, employment, adult post-education, industry, professional, and military arenas because testing centers and labs could be arranged into classrooms, auditoriums,
conference rooms, and even hotels. This made computer-based testing more accessible and convenient to examinees and administrators. Educational institutions used computer-based testing as part of the admissions process and business and industry used multiple types of psychological and employment tests to assist in the hiring process (Luecht & Sireci, 2011).
Historical Background of the GED
The origins of the GED dates back to 1942 when it was created by the American Council on Education (ACE) to address the need World Word II veterans were facing upon their return home from the war. Many of the veterans did not possess a high school diploma and were facing difficulties in securing employment. Originally, the American Council on Education had been created during World War I to:
involve the national associations of high education in the war effort, and one of its first objectives was to prevent college-educated men from being used on the battle lines in order to avoid ‘destroying the reservoirs for the production of experts’ and ‘the reckless waste of irreplaceable talent’ (Quinn, 2002, p. 7).
16
Upon the end of World War I, the council was charged with designing tests that would assist in the selection, training, and assignment of military personnel. In an attempt to ease the transition for veterans, the ACE released the GED after several years of designing and developing the test. It was announced in mid-1943 that over 400 institutions in the country had officially accepted the exam for credit into respective institutions (Quinn, 2002). It was estimated, that since 1942, over 18 million Americans have received their GED and have used the diploma as a stepping stone to better
employment or entrance into college (Clymer, 2012).
Since that time, the GED exam has undergone revisions in 1978, 1988, 2002, and again in 2014. Changing attitudes towards education caused the 1978 exam to shift focus, making social studies and science separate tests geared towards conceptual knowledge rather than simple memorization (GED Testing Service®, 2014a). The 1988 exam experienced changes that reflected the shift in global awareness and worldwide technological advancements with the addition of a writing sample, increased critical thinking, and problem-solving skills. These revisions encouraged societal awareness and ensured the material be reflective of more adult-related material. As more businesses and industry began requiring either a high school diploma or GED for entry level positions into employment, the 2002 test was designed to mirror a high school diploma (GED Testing Service®, 2014a).
Today, the GED Testing Service Mission Statement is as follows:
In an ideal society, everyone would graduate from high school. Until that becomes a reality, we, the General Educational Development Testing Service, will offer the opportunity to earn a high school equivalency diploma so that
17
individuals can have a second chance to advance their educational, personal, and professional aspirations (GED Testing Service, 2009, p. 1).
In 2011, the American Council on Education (ACE) announced a partnership with Pearson Vue charged with the creation of the GED 21st Century Initiative, to include a new computer-based GED exam. The new exam focused on Common Core State Standards reflective of the needs of a global economy and to encourage people to enter college, hence the goal of a redesigned, 2014 version of the exam was conceived (Clymer, 2012).
GEDTesting Service® conducted a usability study in 2011 to investigate the transition to a computer-based exam. By working with Pearson Vue to determine how examinees would react to operating computer hardware and software, the study reflected needs identified by the population. The usability study was designed with instruments to assess three different participant traits for the project: 1) age, 2) native language, and 3) level of computer experience. The skills that were measured ranged from basic use of a mouse and keyboard, to interacting with on-screen item types, such as scrolling, drag and drop, and pop-up windows. Three rounds of testing occurred during January and
February 2010, resulting in various recommendations that would enhance the ease of the use of the computer upon delivery of the computer-based test. One noteworthy
suggestion was to ensure that examinees had basic keyboarding skills; this study was followed up later with the comparability study completed by the GED Testing Service®.
The 2002 version of the exam was administered in a computer-based format in a comparability research study in 2010 by the GED Testing Service®. It was conducted in eleven states: Arizona, California, Colorado, Florida, Georgia, Michigan, Missouri, New
18
Jersey, North Carolina, Texan and Virginia. These exams were delivered to over 7,500 individuals and were promoted as a paid practice exam. Examinees were offered a tutorial once they began the exam on the computer, and they were allowed the same allotted amount of time as the traditional paper-based exam (GED Testing Service®, 2011a).
The conclusions reached by these studies led to no changes in policy or program strategy. As GED Testing Service moves forward in adding CBT, it will continue to monitor comparability to ensure that the computer-based GED test is a valid measure of a test-taker’s knowledge (GED Testing Service®, 2011a, p. 2). The computer-based GED exam was originally scheduled to be implemented nationwide in 2012, but due to the outcome of the usability and comparability studies, the original design needed more than 500 modifications to the instruction and delivery of the exam before implementation could occur nationwide (GED Testing Service, 2011b).
Theoretical Foundation of Self-Efficacy
The component of self-efficacy originated from Albert Bandura’s Social Cognitive Theory and is the concept that individuals have the power to produce results based on their perceived ability to complete a task. The belief that one is capable of performing certain tasks, in order to attain certain goals, is the foundation for this theory. Bandura distinguished the difference between self-esteem and self-efficacy, as the
definitions were too often mistakenly identified. Unlike self-esteem, which focused on judgment of self-worth, self-efficacy focused on judgments of personal capability. Khorrami-Arani (2001) also indicated in her research, that Olivia and Shapiro “…described the importance of not confusing self-efficacy with self-esteem…both
19
concerned with the judgments of individuals, they do not share any direct relationship with each other” (p. 18). To further clarify, it is important to recognize that while individuals may experience higher self-efficacy in one area, they are not guaranteed to have that same experience in other areas of life. Improving self-efficacy required one of the following events, or judgments, to occur which assists in increasing the level of self-efficacy: 1) feedback from others, 2) modeling after others, and 3) having a successful experience.
Self-efficacy judgments are held to have a substantial influence on the emotional responses of the individual. Individuals will tend to prefer and enjoy behaviors they feel they are capable of performing and to dislike those they do not feel they can successfully master (Compeau & Higgins, 1995a, p. 196).
Triadic Reciprocal Determinism
Social Cognitive Theory identified three elements which influenced self-efficacy: 1) behaviors, 2) environment, and 3) personal or cognitive factors. Bandura labeled this as the triadic reciprocal determinism, causing factors to influence each other to form a human agency. The relationship among internal personal factors, external environment factors, and behavior is a bidirectional process that works simultaneously rather than as a single event, causing efficacious people to be cognitive of their opportunistic structures in society. The elements work in tandem and can shift directions based on changing factors such as the environment, opportunities, alterations in behavior, or feedback from others. “By influencing the choice of activities and the motivational level, beliefs of personal efficacy make an important contribution to the acquisition of the knowledge structure on which skills are founded” (Bandura, 1997, p. 35). Hence, positive feedback may then
20
lead to a higher level of self-efficacy, whereas negative feedback or behavior modeling would tend to enhance negative perceptions causing a rise in lower levels of self-efficacy.
“Beliefs of personal efficacy also regulate motivation by shaping aspirations and the outcomes expected for one’s efforts” (Bandura, 1997, p. 35). Individuals’ desire to succeed is a contributing factor toward Social Cognitive Theory; if a fear of failure exists the motivating factor driving them towards the desire will diminish.
As part of his Social Cognitive Theory, Bandura coined the term “self-efficacy” to describe individuals’ perceptions and beliefs of their ability to complete a task. In 1986, Bandura defined self-efficacy as:
People's judgments of their capabilities to organize and execute courses of action required to attain designated types of performances. It is concerned not with the skills one has but with judgments of what one can do with whatever skills one possesses (Compeau & Higgins, 1995b, p. 191).
According to the theory, self-efficacy has significant influence over one’s goals, actions, successes, and even failures. As individuals begin to learn from their successes and failures, they use the information to better assist them in assessing their own self-efficacy. Bandura noted that there are four principle sources for the acquisition of the information: 1) actual experiences that are derived from exposure to the situation, perhaps by observation, 2) vicarious experiences that are learned indirectly, 2) verbal persuasion through encouragement from others and 4) physiological indicators such as anxiety or fear due to a lack of skills (Miltiadou & Yu, 2000). In more detail, prior experience is considered to be the most reliable and valuable source of learning any new
21
material; learning through experience offers exposure to situations that cannot be
duplicated through experiment. Observing others at a task that may seem overwhelming or too difficult provides a sense of encouragement to others, therefore offering a sense of inspiration. In addition to observation, verbal encouragement from others offers support and increases their personal strength resulting in an enhancement in the inspiration level.
Lastly, physiologically changes in the body including sweating, increased heart rate, shaking, or muscle tension, may show signs of an increase in anxiety. This increase in anxiety can be a deterrent to attempting new tasks or exposure to various situations which could seem overwhelming (Miltiadou & Yu, 2000).
Self-Efficacy Judgments
The concept of self-efficacy is multidimensional and includes three separate judgments: magnitude, strength, and generalizability. Magnitude refers to the level of a task which is perceived as attainable by the individual. People with higher levels of self-efficacy are able to view their ability to complete more difficult tasks, whereas those with lower self-efficacy are only able to perceive their ability to complete more, lower level tasks. Self-efficacy strength is the second dimension that focused on the level of belief an individual has about their ability to conquer obstacles, complete tasks, and face
adversarial situations. Their level of self-efficacy could determine if they will be deterred from more difficult tasks and if they have a lower level of self-efficacy then they are more susceptible at shying away from situations that appear overwhelming.
Generalizability focused on “the extent to which perceptions of self-efficacy are limited to particular situations” (Compeau & Higgins, 1995b, p. 192). People may only be able to perform certain tasks under certain situations, therefore the levels of self-efficacy
22
change according to the circumstance and often become situational (Compeau & Higgins, 1995b).
Self-efficacy is a significant factor to individuals whose tasks or goals may be enhanced and/or threatened by their perceived ability. The contribution of self-efficacy towards successes and failures may be a factor when a decision is made to pursue
attainable goals or complete what some may consider fairly minimal tasks, like the use of a computer.
Development of Computer Self-Efficacy
The term computer self-efficacy has been defined by Compeau and Higgins (1995b) as “a judgment of one’s capability to use a computer” (p. 192). Compeau and Higgins discovered through their research that computer self-efficacy had a significant impact on individuals’ perceptions of their ability to use a computer and that if they failed to perceive themselves as being competent they would be less likely to use a computer. Using Bandura’s Social Cognitive Theory’s component of self-efficacy, Compeau and Higgins (1995b) published the first research on computer self-efficacy “aimed at understanding the impact of self-efficacy on individual reactions to computing technology” (p. 2). As the dimensions of self-efficacy identified distinct judgments, Compeau and Higgins (1995b) incorporated those concepts into the definition of computer self-efficacy. Just as the magnitude of one’s perceived level of capability can be used to assess ability to complete tasks, face situations, or overcome obstacles, the same judgment can be used to assess one’s ability to complete more difficult computer-oriented tasks. The higher the level of computer self-efficacy, the more likely an individual will be capable of adapting and using computer software and hardware.
23
Likewise, if an individual has lower computer self-efficacy, the tendency to be reluctant at facing those challenges increases. Strength in computer self-efficacy refers to the “level of conviction about the judgment, or the confidence an individual has regarding his or her ability to perform the various tasks” on a computer (Compeau & Higgins, 1995b, p. 192). If individuals have higher levels of computer self-efficacy, it is expected they would be able to adapt more quickly to various computer programs and software
(Compeau & Higgins, 1995b). Compeau and Higgins’ Computer Self-Efficacy Research Model process is shown in Figure 1. Compeau and Higgins (1995b) used Social
Cognitive Theory as the foundation for computer self-efficacy; the higher the level of computer self-efficacy the higher the expected job-related outcomes, or performance. The assumption was that people who had higher computer self-efficacy levels tended to Figure 1: Compeau and Higgins Computer Self-Efficacy Research
Model. Adapted with permission (see Appendix F) from “Computer self-efficacy: Development of a measure and initial test,” by
24
enjoy their time working with a computer (liking), therefore producing less anxiety and resulting in heavier computer use (outcome).
An article published in 1993 on the effects of high stakes computer-based GRE testing was found to be one of the first studies designed to investigate if test mode affected performance outcomes (Parshall & Kromrey, 1993). Parshall and Kromrey presented data from a study of secondary analysis to the Annual Meeting of the American Educational Research Association in Atlanta, Georgia, in April 1993. Using data from the Educational Testing Service’s Graduate Record Examination (GRE) Program’s computer-based testing pilot from the fall of 1991, Parshall and Kromrey analyzed characteristics from 1,114 examinees to determine if test mode had any effect on
performance. Included as a characteristic were demographic variables, and computer-use variables including experience, frequency, and mouse usage. Because this was a study that utilized secondary analysis, many of the outcomes proved to be inconclusive; however, the research could be considered the foundation for the discussion of concerns surrounding the transition of paper-based tests to computer-based tests.
The GED Testing Service® conducted its own research on GED computer-based testing, though it was limited and addressed computer familiarity rather than the
computer self-efficacy levels of examinees, indicating a need for a more thorough
investigation into these concerns (George-Ezzelle & Hsu, 2006). Surveys were mailed to previous GED examinees in all 50 states and the District of Columbia who took their exam in 2004; a total of 44,920 surveys were mailed with an 11% response rate. The researchers indicated limitations that were recognized in the study including, incorrect mailing addresses, recent examinees, and a nonresponse bias. “Even though the
25
respondents were able to be matched to the population of GED candidates on variables such as age, educational level, and race/ethnicity, no population data exists on measures of computer familiarity” (George-Ezzelle & Hsu, 2006, p. 13).
Goldberg and Pedulla (2002) focused on the computer familiarity of the practice Graduate Record Exam (GRE). Although the GRE was an entrance test used for
admission into college graduate programs and had been computer-based for 10 years, the understanding of computer familiarity could be implied for any computer-based
assessment. The authors used the following as one of three research questions to
examine whether a test takers’ level of computer familiarity had any association with test scores: “What is the relationship between computer familiarity and CBT score?”
(Goldberg & Pedulla, 2002, p. 1058). Their suggestions for further study into the impact computer familiarity may have on the successful completion of a computer-based exam could imply the necessity for determining the need of an examinee’s computer self-efficacy.
The effect of computer familiarity on CBT performance also deserves further attention, especially considering the proliferation of computerized tests beyond those designed primarily for student populations such as in this study. In
particular, it is likely that computer usage is more variable among people who are not part of the traditional undergraduate age group and among people who are more socioeconomically diverse (Goldberg & Pedulla, 2002, p. 1066).
A multi analysis of covariance (MANCOVA) was used to assess whether there was a statistical relationship between computer familiarity and test condition. It was determined that there was a significant main effect on all three parts of the GRE when
26
one factored in computer familiarity, indicating that test mode did have an effect on the scores for GRE test takers (Goldberg & Pedulla, 2002).
“One of the main contributing factors that should be examined when conducting comparability research is the existing computer familiarity of test takers and its
interaction with performance on CBT” (Al-Amri, 2008, p. 24). Al-Amri discussed in his research that upon a considerable review of literature, it could be concluded that
measuring the level of a test takers’ computer familiarity was imperative when discussing findings regarding computer-based testing. Al-Amri attempted to answer the extent to which computer familiarity affected participants’ performance on a computer-based exam by utilizing the high-stakes Test of English as a Foreign Language (TOEFL). One of the six research questions the researcher attempted to answer included, “To what extend does prior computer familiarity affect participants’ performance on CBT” (Al Amri, 2008, p. 26). The researcher used a questionnaire to measure the computer familiarity and computer attitude over a 3-month time span in a first-year student medical course. Correlations existing between the examinees’ computer familiarity scores and their performance on the computer-based exam indicated no significant relationship existed (Al Amri, 2008).
In their article titled Computer Based Assessment (CBA): A Long Way to Innovation, Schär and Hofer (2007) suggested that the conversion to computer-based testing should be a holistic approach through all phases of development. They
summarized the pros and cons associated with computer-based testing which reflected similar concerns categorized by other authors with similar research questions; computer
27
anxiety and computer familiarity were two of the primary concerns with computer-based testing (Schär & Hofer, 2007).
In more recent years, He and Freeman (2010) investigated the concept of computer self-efficacy by conducting a study using 281 undergraduate business major students enrolled in two Management Information Systems courses. He and Freeman (2010) combined portions of various survey instruments to create a tool used in a pre-test and post-test online format that measured the degree to which social norms, computer anxiety, gender, age, and job status affected the computer self-efficacy of individuals. The instrument was a 5-point Likert survey, combined with Compeau’s Computer Anxiety Rating Scale (CARS), to measure computer anxiety and Venkatesh and Davis’ instrument which measured social norms as it related to Information Systems Theory. Markas’survey instrument that measured general self-efficacy and two other items which measured individuals’ attitudes towards computers were also used. This study was instrumental because the authors argued that computer self-efficacy is rarely explored in research literature and that more exploration should be conducted in order to create a foundation for other researchers in the field (He & Freeman, 2010).
The results of He and Freeman’s (2010) study suggested no significant correlation exists between computer self-efficacy and gender, age, job status, or social norms. The most significant determining factor in relation to individuals’ computer self-efficacy was the extent of their computer knowledge, which significantly reduced their computer anxiety. There were significant limitations with the study, and the researchers suggested there were issues with the validity of several of the indicators used to measure computer self-efficacy.
28
The Digital Divide
The digital divide is a term often used by sociologists or economists to describe the technological gap that exists between social classes. Attewell (2001) suggested that “poor and minority families are less likely than other families to have access to
computers or the internet, creating a technology gap between ‘information haves’ and ‘information have-nots’” (p. 252). The differences that may exist within the divide are driven by factors such as age, ethnicity, gender, and socioeconomic status; these factors can affect households, individuals, businesses, regions, and even countries (Attewell, 2001). The research outcomes vary in response to the reasoning behind the digital divide. Attewell (2001) suggested the inequality stemmed from financial resources hindering lower income families’ accessibility to computers and the internet. Cooper (2006) proposed that gender was the most significant contributing factor affecting the digital divide, whereas Volkom, Stapley, and Amaturo (2014) found that the generation gap of age was the identifying factor when defining the digital divide.
Technology is consistently evolving and according to Volkom et al., (2014), the generational gap existing within the digital divide suggests that age “…has recently been reported to be a more important predictor of technology use than sex” (p. 558). In their review of literature, it was found that older adults, having lower self-efficacy towards computers, tended to be more intimidated by the use of technology than younger adults. Volkom et al. (2014) conducted their research in an effort to determine if gender had any effect on the use of technology. In addition, they wanted to determine if there was sufficient reason to suggest younger participants were more comfortable with computers and experienced less anxiety and frustration than that of older adults. The sample
29
consisted of 276 self-reported adults who completed a 43-item questionnaire designed to measure frustration levels surrounding computers, reasons for using social media, and perception questions towards technology. The statistical findings revealed that older adults were more frustrated and less comfortable with current technology than the younger generations, and that males had a greater comfort level than females when working with technology (Volkom et al., 2014).
Copper (2006) conducted a meta-analysis from 20 years of research material which proposed there were differences between gender within and across the digital divide. Results indicated that females suffered more than men from computer related anxiety. An increase in anxiety generated more negative attitudes toward computers, causing females to use computers less often in comparison to men. Although Copper suggested that females were at a technological disadvantage, the evidence from the research also indicated that people from all ages, as well as internationally, were affected by the divide. Cooper’s research study was one among a wide range of research on the digital divide and suggested that “technology is arguably the lynchpin of our modern society. It is hard to conceive of many aspects of our lives that do not rely on technology in general and computers in particular” (Cooper, 2006, p. 320).
The United States Census Bureau began asking key questions regarding computer usage in 1984 and internet access in 1997. In an effort to produce data that targeted areas of the country with minimal or limited access to computers and internet access, the 2008 Broadband Data Improvement Act was created. The United States Census Bureau followed by adding targeted questions on the 2011-2013 American Community Survey (ACS). The ACS is an ongoing annual survey that provides data for communities to use
30
in planning for investments and services needed within their respective area. The survey assists federal and state government in financial distribution to communities based on need (File & Ryan, 2014).
File and Ryan reported, in the 2014 American Community Survey report, that an estimated 83.8% of the homes in the United States had computers and 74.4% had Internet access. This is a considerable shift from 1984 when only 8.2% reported having a
computer and in 1997 only 18% reported Internet access. Likewise, of those percentages in 2013, those who reported higher usage were of the ages 15-34, white non-Hispanic, and more than $150,000 household income (File & Ryan, 2014, p. 4). In addition, the statistical data indicated that males and females both had readily available access to computers and the Internet in their home. There was a significant digital gap between those who had a reported disability (739%) and those who did not have a reported disability (90.4%).
Measurements of Computer Self-Efficacy
Bandura created a scale to measure an individual’s level of perceived self-efficacy. He strongly encouraged using the approach that no one measure fits all, and levels should be designed to meet the needs of those being assessed. He warned that discretion should be used when designing levels of measurement, arguing that such an approach could disassociate meanings from perceptions. Instead, he argued, “scales of perceived self-efficacy must be tailored to the particular domain of functioning that is the object of interest” (Bandura, 2006, p. 307). Bandura stated that self-efficacy is only concerned with one’s perceived capabilities and that constructs should reflect a judgment of capability rather than a statement of intention. Bandura (2006) wrote a Guide for
31
Constructing Self-Efficacy Scales as a tool to be used in the creation of self-efficacy measurement scales.
According to Bandura, self-efficacy scales should include content validity, conceptual analysis of the relevant domain of functioning, and gradations of challenge encapsulated into a response scale format. In order to minimize response biases, the self-efficacy scale must have “safeguards built into the instructions and the mode of
administration” and be recorded privately, identifiable by code numbers instead of names (Bandura, 2006, p. 314).
Murphy Computer Self-Efficacy Scale
Various scales had been developed to measure computer self-efficacy and have been modified from the well-known Murphy scale. The Murphy computer self-efficacy (CSE) scale measured subscales of hardware, software, and mainframe skills which were considered potentially outdated due to current advancements with computers and
technology (Brown, 2008). The Murphy scale was developed, in the late 1980s, in response to a need to address a gap in the measurement of computer self-efficacy. At the time of the research, Murphy found that the only scales that existed measured attitudes towards computer technology.
The scale consisted of a 42-item response survey created and submitted to an expert panel of five for review; the panel subsequently removed 10 questions for a total of 32. The scale was created in a 5-point Likert-type format with each question
employing a positive question beginning with the phrase “I feel confident” and ranging from very little confidence to quite a lot of confidence. The items were then coded into three factor areas: 1) Beginning Level Computer Skills, 2) Advanced Level Computer
32
Skills, and 3) Mainframe Computer Skills. Implications for this study suggested continuous development of measurement scales for computer self-efficacy, especially those using actual measures or observations, those working with gender analysis, and computer attitude in relation to computer self-efficacy (Murphy, Coover, & Owen, 1988).
Karsten and Roth (1998) published the results of a study on computer self-efficacy at the university level. Using a Likert-type scale design, the Murphy Computer Self-Efficacy Scale, to measure pre and post computer self-efficacy, they assessed 156 students enrolled in three sections of Introduction to Information Systems in an
undergraduate year. The analyzed data, from a two-tailed t test and correlational analysis, implied that there was a significant difference between the computer self-efficacy levels of students at the beginning of the course compared to their levels at the end of the semester. The researchers recognized that similar measures existed which provided a more in-depth analysis of computer self-efficacy. “A need remains for continued research to refine, analyze, and compare the several available CSE measures from both an educator’s and researcher’s viewpoint” (Karsten & Roth, 1998, p. 67). Prior to this research, computer self-efficacy research was conducted on individuals in the workforce and was not yet designed for high-stakes computer-based testing.
Compeau and Higgins Computer Self-Efficacy Scale Prior to Compeau and Higgins’ publication, Computer Self-Efficacy: Development of a Measure and Initial Test in 1995, only a limited number of measurements or scales of self-efficacy, as it relates to computers, existed. It was
suggested, based on the review of literature, that “…examination of existing measures of computer self-efficacy indicated the need for additional development work” (Compeau &
33
Higgins, 1995b, p. 193). It was found that one of the first initial measurements of self-efficacy in a computing context was in 1986, and it utilized a three-scale item that measured general perceptions of computer usage in participants’ jobs. Another
measurement tool used a four-item scale, a revision from the three-scale model, however the scale only measured general usage with no questions, specifically targeting computer self-efficacy. Another five-scale tool appeared to have measured some level of computer self-efficacy, but was still limited with the addition of other concepts (Compeau & Higgins, 1995b). Based on their findings of limited measurable scales for computer self-efficacy, their efforts in creating a single measure for computer self-efficacy was the foundation for others to investigate the area without the concerns for specific limitations. One of the hypotheses in the research was “the higher the individual's computer self-efficacy, the higher his/her outcome expectations” (Compeau & Higgins, 1995b, p. 195). Findings resulted in the higher levels of self-efficacy an individual had, the more likely they were to use a computer and experience less computer anxiety.
Social Cognitive Theory perspective suggests that an understanding of both self-efficacy and outcome expectations is necessary to understand computing
behavior. This research, in developing and testing a measure of computer self-efficacy, lays the foundation for future research concerning the Social Cognitive Theory perspective on computing behavior and the unique influence of
individuals' perceptions of their computing abilities (Compeau & Higgins, 1995a, p. 206).
Unlike other research measurement scales, Compeau and Higgins’ measurement tool used a 10-item scale that focused on job tasks by incorporating questions that would
34
measure task difficulty by capturing differences in self-efficacy magnitude and strength. By applying Social Cognitive Theory, Compeau and Higgins (1995b) used the following areas of influence for 14 hypotheses used to research the measurement scale:
encouragement by others, others’ use, support, computer self-efficacy, outcome expectations, affect (positive), and anxiety. Encouragement by others was defined as verbal persuasion from others to the individual in the reference group. This influence was expected to have an impact on the individuals’ self-efficacy based on positive or negative persuasion. Others’ use, was the theoretical rationale for behavior observed by others, or behavior modeling. It assumed that an individual’s self-efficacy was
influenced by the observation of others’ ability to use and actively work on the computer. An organization’s support towards the use of and training in computers was expected to have an influence on an individual’s computer self-efficacy (Compeau & Higgins, 1995b).
Computer Self-Efficacy Scale for Adults
After the review of literature, there was only one scale that measured computer self-efficacy specifically targeted at adults. James H. Brown modified the original Murphy scale to create a Computer Self-Efficacy Scale for Adults (CSESA) that was designed to gather information focused on adults and the perceptions of their computer skills. “The CSESA was designed to differentiate among adults in their perceptions of their computer skills and abilities across a wide age span, different perceived computer skill levels, gender, and ethnicity” (Brown, 2008, p. 1). The CSEA measured 36 items and required approximately 20 minutes to complete. Brown provided specific guidelines for the recreation, design, and administration of the scale. The survey was designed by
35
both the author and professionals in the education field who taught basic computer courses to adults. It was created with the thinking that many individuals would be self-taught on computers or may have participated in some type of computer skills training. There were three suggestions made to the items 1) keep the item as is, 2) delete the item, or 3) change the way the item is stated. After review from an expert panel, a pilot study (n = 108) was conducted for content validity and the outcomes suggested an overall high mean computer self-efficacy score for three computer domain subscales (Brown, 2008).
Summary
The literature review presented in this chapter provided a historical background for investigation into computer self-efficacy and how it has evolved from Bandura’s original perception of efficacy. Although there is limited research on computer self-efficacy, in relation to high-stakes testing, the need for additional research has been recommended by various researchers. Although research was conducted on transitioning the GED exam from a paper-based to computer-based format, more information needed to be gathered on the computer self-efficacy of individuals taking the exam.
The problem investigated in this study was the concern that GED examinees had low computer literacy skills that in turn may have caused a lack of appropriate computer self-efficacy impacting success on the computer-based 2014 GED exam. The literature review provided the contextual foundation necessary to guide the study to determine if influence existed between computer self-efficacy of examinees and their performance on the computer-based GED exam and to determine if examinees experienced any
36 Chapter III <