MPRA
Munich Personal RePEc Archive
New renewable electricity capacity under
uncertainty: The potential in Norway
Fleten, Stein-Erik and Ringen, Geir
Norwegian University of Science and Technology
January 2009
Online at
http://mpra.ub.uni-muenchen.de/12857/
Abstract-- Uncertainty affecting project values makes investors hesitate to build new capacity unless
profitability is significant. When analysing the potential for new renewable power system capacity in a region, it is therefore necessary to properly capture both uncertainty effects and decision-making behaviour of investors. Important stochastic factors typically include wholesale electricity prices and certificate prices. We calculate trigger levels for the sum of these factors, and compare these with the current long-term contract prices to estimate the potential for new renewable electricity capacity. We take into account the cost and technical potential of small hydro and wind in Norway, the number of pre-notifications, concession applications and grants, and the capacity targets of subsidising governmental bodies. With an electricity certificate policy target of 41 TWh per year of new renewables for Sweden and Norway combined until 2016, we estimate that 12 TWh wind power and 6.2 TWh hydropower will be built in Norway. Due to the option value of waiting, most of this capacity will come after 2010.
Index Terms— Finance, Hydroelectric power generation, Power system planning, Stochastic processes, Uncertainty, Wind energy
1.
I
NTRODUCTIONGood conditions for wind energy and small hydropower, and periods of high electricity prices, make many investors plan for new power projects in Norway. At the same time, regulators and other planners need an overview of the future expansion of power capacity. This paper reports on the use of an alternative method, as compared to traditional discounted cash flow models, to consider the path of expan-sion of renewable electricity generation capacity. Our alternative method takes into account uncertainty in electricity prices and in so-called green certificate prices, which are sources of uncertainty that make investors hesitate to build unless profitability is highly favourable. The period considered is from 2005 to 2016, which includes the end of the first phases of the planned green electricity certificate market arrange-ment in Norway and Sweden. These electricity certificates are to be sold by eligible renewable producers and bought by retailers, who are required to buy a certain volume1.
Power prices and electricity certificate prices are modelled as stochastic processes, whose parameters are estimated from historical data and from long-term equilibrium analyses. Electricity certificate prices depend on the level of political ambition for the amount of new renewable capacity to be installed for Norway and Sweden jointly. Two levels are analysed; a low ambition level of 31 TWh/yr and a high of 41 TWh/yr. How the certificate market affects power prices is assumed to be reflected in the forward prices that contribute to estimating the parameters of the power price process. This means that we rely on the financial market for electricity to be efficient, i.e. that it reflects the available information on all factors influencing future electricity prices.
S.-E. Fleten and G. Ringen are with Department of Industrial Economics and Technology Management, Norwegian University of Science and Technology, NO-7491 Trondheim, Norway (e-mail: stein-erik.fleten@iot. ntnu.no)
1 See Jensen and Skytte (2002) who explain and discuss the green certificate policy scheme in light of its effect on consumer prices,
considering the interaction between the electricity market and the green certificate market.
New renewable electricity capacity under
uncertainty: The potential in Norway
A license to build a wind power farm or a small hydropower plant is a real option, where the investor has the right, but not the obligation, to pay the investment cost to get the cash flows of the project. Based on the technical and economic potential for new wind power and small hydropower, we calculate trigger levels in terms of the sum of power prices and electricity certificate prices, for when the investments should be made, and consider the probability that this price sum will reach these trigger levels in the future. With a low ambition level for the electricity certificate arrangement, we expect that 3.2 TWh/yr wind power and 6.2 TWh/yr hydropower is built in Norway by 2016. With a high ambition level we expect 12 TWh/yr wind power and 6.2 TWh/yr hydropower. Wind power has particularly high (option) value of waiting, making much wind capacity come online towards the end of the considered horizon.
The main real option we focus on is the option to postpone the investment, as analyzed by McDonald and Siegel (1986); an overview of the theory of real options is found in Dixit and Pindyck (1994). Real options in electricity markets are studied by e.g. Deng, Johnson and Sogomonian (2001), Keppo and Lu (2003), Botterud and Korpås (2007), Fleten, Maribu and Wangensteen (2007), Kjærland (2007) and Bøckman et al. (2008), all focusing mainly on the investor view. Also taking this viewpoint, Fleten and Näsäkkälä (2003), Näsäkkälä and Fleten (2005), Siddiqui and Marnay (2008), Abadie and Chamorro (2008) and Correia et al. (2008) consider investment in thermal power plants with uncertainty in electricity and fuel prices, and possibly emission prices. A number of articles deal with broader investment responses and technology adoption under uncertainty of climate change policies. Fuss et al. (2008) find that policy-driven uncertainty such as uncertainty in the total quota levels (the cap on aggregated emissions set by policy makers) postpones investments in emission-reducing technology, whereas mean-reverting electricity price uncertainty hastens such investments. Laurikka and Koljonen (2006) point out that carbon emission trading brings along additional risk to investors in the form of uncertainty not only in emission quota prices, but also in the number of freely allocated allowances. Using a bottom-up approach in the form of an optimization model, Maribu et al. (2007) study how small distributed power sources could be adopted in the future by the US commercial building sector.
2.
T
HE ELECTRICITY AND ELECTRICITY CERTIFICATE MARKETS2.1 Common policy instruments promoting renewables
In Europe, the most common instrument for promotion of new renewable capacity is feed-in tariffs. Eligible producers receive fixed price for their output, higher than expected market prices, and it is common that network/grid companies are responsible for calculating the amount of subsidy and for distributing the cost onto the consumers’ bills. Another arrangement is to invite tenders for a certain amount of renewable power, and select projects to receive subsidies. The policy for wind power in Norway has been to grant investment support before the project has been started. However, from 2007 on a market arrangement for electricity certificates is planned. In such a market, electricity retailers need to buy certificates for a certain percentage of the electricity they sell. Eligible producers can sell certificates, and the government decides which production is eligible and what percentage the retailers should comply with. Such a policy measure uses a market mechanism to make sure that cost-efficient projects enter the market early. The arrangement is expected to give an eligible producer the right to sell certificates for a period of ten years.
Sweden has had a certificate market in place since 2003, and the goal is to increase the share of renewables to 16.9% of total production in year 2010. Retailers that do not comply with the quota will be sanctioned in the form of payment of 150% of the average certificate market price during 1 April to 31 March the following year.
2.2 Electricity price model
Nordic electricity prices exhibit seasonality over the year, over the week and through the day. Prices are also mean reverting, with a high spot price volatility estimated to 195% annually based on daily data from
1993-01-01 to 2004-12-31. Long-term (futures price) volatility is decreasing with time to maturity, and for the contract with three years to delivery, the annual volatility is 13%. A model that captures these properties is the two-factor model proposed by Lucia and Schwartz (2002), which can be expressed as follows:
t t t f t X
P = ()+ +
ε
(1)Here, f(t) describes the seasonality of electricity prices, Xt is the state variable for a short term factor, and
εt is the state variable for a long term factor. The risk adjusted stochastic processes for the two factors can be expressed as follows: X X t t X dt dZ dX =
κ
⋅(α
− )⋅ +σ
⋅ (2) ε ε εσ
μ
ε
dt
dZ
d
t=
⋅
+
⋅
(3)dt
dZ
dZ
X⋅
ε=
ρ
⋅
(4) where dXt is the stochastic change in the short term factor, dεt is the dynamics of the long term factor. Further, κ is the speed of mean reversion of the short term factor, α is the long term mean of the short term factor, σX is the volatility parameter of the short term factor, με is the drift parameter of the long term factor, and σε is the volatility parameter of the long term factor, and ρ is the correlation coefficient between the short and long term factors.There is an active derivatives market for electricity, and using the fact that expected risk-adjusted electricity prices equal forward prices, it can be shown that
T e X e T f P E T P F T T T ε κ κ +ε + − ⋅α+μ + = = − ⋅ −⋅ ) 1 ( ) ( ) ( ) , ( 0 0 0 0 0 (5)
Here, T is the maturity date of the forward contract. Since electricity needs to be delivered as a flow over time, the price given in Eq. (5) is for a theoretical contract that is not traded in practice. Ordinary time (T)-average is employed in the parameter estimation in order to connect prices of contracts having short delivery periods with contracts having longer delivery periods, such as seasonal and annual contracts.
The seasonality function used is shown below (for time measured in weeks):
⎟ ⎠ ⎞ ⎜ ⎝ ⎛ + ⋅ ⋅ ⋅ = 52 2 ) ( cos ) (T γ T τ π f (6) where γ is the amplitude of the seasonality and τ is a phase angle making sure the maximum of the function is in January. This seasonality reflects only annual patterns, not weekly or intradaily. The short term patterns are left out because they do not influence the decisions to invest in long-term generation assets.
The parameters of the price model are estimated based on historical prices of futures and forward contracts traded on Nord Pool from January 1996 to December 2004, giving 9380 observations. The method of parameter fitting uses least squares iteratively and is described by Cortazar and Schwartz (2003). Results are displayed below.
TABLEI
RESULTS OF ESTIMATING PRICE PROCESS PARAMETERS.
Short term factor X0 -5.7 €/MWh
Long term factor ε0 29.8 €/MWh
Amplitude γ 3.7 €/MWh
Phase angle τ -1.36
Speed of mean reversion κ 0.032
Long term mean of short term factor α -7.3 €/MWh
St. dev. short term factor σX 3.56 €/MWh
St. dev. long term factor σε 0.67 €/MWh
Correlation short – long term ρ -0.28
2.3 Electricity certificate price model
For modelling the electricity certificate prices, we choose a relatively simple, standard model, a geometric Brownian motion:
ES ES ES ES ES
P
dt
P
dz
dP
=
λ
⋅
⋅
+
σ
⋅
⋅
, (7)where λ is the growth rate of certificate prices, and σES is the volatility of certificate prices.
Because no historical data on the joint Swedish-Norwegian electricity certificate market is available, the estimation of the parameters in Eq. (7) needs to rely on judgment and expert opinion. We rely on an assumption that certificate price variability will be roughly the same as it has been in the Swedish case. Thus we estimate σES as the square root of the variance of changes in log prices from the Nord Pool record of electricity certificate market prices, daily from 2004-03-03 to 2005-02-25. The result is σES = 0.034. Regarding the growth rate, we use the analysis by Swedish energy authorities (Statens Energimyndighet (2005)) as a starting point. That study considers two levels of ambition regarding the amount of new renewable electricity generation capacity to be installed due to the certificate arrangement. The low level of ambition calls for 31 TWh/yr by 2016 for Norway and Sweden jointly, and the high ambition level has an aim of 41 TWh/yr. Using the energy system planning tool MARKAL, prices for electricity certificates were estimated to 90 SEK/MWh in 2016 for the low ambition level, and 140 SEK/MWh for the high ambition level. Among important assumptions is the use of a 5% discount interest rate. For a 10% rate, the corresponding numbers were 180 SEK/MWh and 240 SEK/MWh. We consider an interest rate near the middle of the 5-10 % interval to be most appropriate, and therefore we use price averages as starting point. Further we consider the average Nord Pool electricity certificate price the last week of 2004 as the starting price from which prices evolve to their expected level in 2016 (actually 2017 since the joint certificate market was postponed one year). The resulting growth rate is λ = -0.00075 for the low ambition level and
λ = -0.00020 for the high ambition level.
We remark that the growth rate λ is an important parameter, i.e. small changes will change results significantly. It is therefore unfortunate that its determination needs to be based on judgment, and the conclusions should be read with this in mind. Further, it should be remarked that the choice of a geometric Brownian motion model leads to rather large (option) values of waiting. An interesting alternative, left for future work, is to examine the consequences of changing the model to a mean reverting process.
3.
W
IND POWER AND HYDROPOWERP
ROJECTSWind power farms and small hydropower plants represent the most promising renewable technologies in Norway. Other technologies, such as those based on biomass, solar PV, ocean waves and geothermal heat, will therefore not be considered in this paper.
3.1 Classification of projects
We have used wind data from six different weather stations and from three wind mill locations, dating up to six years back. Using standard methods, taking into account air density, local topography and height above ground, the raw data have been converted to become useful for wind power considerations. The average wind speed has been identified as a useful classification parameter, and our data indicates an ave-rage wind speed of around 9 m/s. By inspection of our data we have chosen to divide the projects the following way; Class 1 is most favourable having wind speed of 9.0 m/s. Class 2 and 3 have wind speeds
of 8.5 m/s and 8.0 m/s respectively.
Using Weibull distributions fitted to the wind data together with turbine-specific descriptions of power output as a function of wind speed, we are able to calculate potential wind power output. This has been done for 8 different turbines for all three wind speed classes, making a total of 24 time series of weekly power generation. In Fig. 1, the expected energy output per week over the year is shown for wind speed class 1, for three different turbines that differ in terms of rated power. Average wind speed is calculated using a nave height of 75 m, causing somewhat unfavourable conditions for the NEG Micon mill having nave height of 92 m and rated power of 2.75 MW, since wind speed increases with height above ground.
Regarding hydropower, Norway is in the favourable position of having annual hydropower capacity of roughly 95% of the annual domestic consumption. The remaining 5% are covered mainly by import. The era of building large scale hydropower projects is over in Norway, but there is still a large potential for smaller projects; 25 TWh of sub-10 MW projects having investment costs below 0.34 €/kWh according to Jensen (2004). The most important factor regarding the profitability of small hydropower projects is the inflow.
Fig. 1. Energy generation for selected wind turbines. Average wind speed is 9.0 m/s.
Expected weekly generation (Class 1)
0 50 100 150 200 250 300 1 4 7 10 13 16 19 22 25 28 31 34 37 40 43 46 49 52 Week MWh
Vestas V80 2000/80 Onshore Nordex N80/2500 NEG Micon
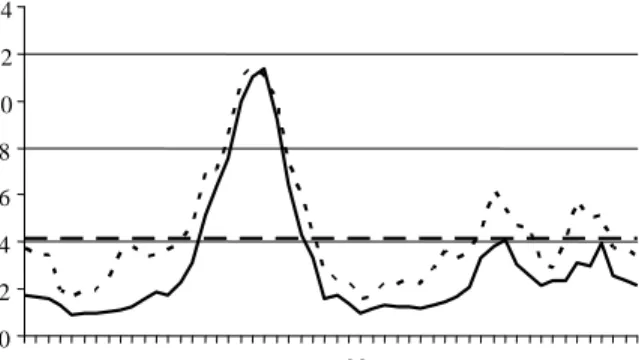
Fig. 2. Inflow profile of the river Svorka.
Fig. 2 shows the inflow profile of the river Svorka, south-west in Norway. We used data from four small hydropower projects, including Svorka, to calculate the potential for new hydropower. The four cases include information on the catchment area, losses connected to flooding and other inflow parameters, the installed capacity, the net head of water, whether there is a reservoir connected to the plant, the type of turbine, the generation of power over the year (summer and winter), and finally the investment cost. The average investment cost is 1100 €/kW, measured per installed capacity, and varies in the interval 0.25-0.30 €/kWh measured per expected annual generation. The average investment cost is 0.29 €/kWh, and we define this to be the cost in class 2. Class 1 and 3 costs is set to 0.19 €/kWh and 0.38 €/kWh respectively. The investment cost of most profitable class is set according to the experience from the best projects (Norwegian Water Resources and Energy Directorate (2003)), while class 3 has an investment cost that is on the borderline of social profitability according to Hofstad (2002).
3.2 Profitability of projects
This subsection contains a net present value analysis of wind and hydro projects.
Average investment cost for wind power is 1160 €/kW, based on data from project proposals in Norway. This is somewhat higher than can be seen elsewhere for onshore wind farms, but may be attributed to higher material cost associated with icing, high wind speed and rough weather conditions. The cost of strengthening and connecting to the transmission network varies among projects, and must be borne by the project developer. Operations and maintenance is set to 1.9% of investment cost. Other costs include payment for transmission services of 0.14 €/kWh, balancing market payments of 1.26 €/kWh, property tax of 3.3 ‰ of investment cost, compensation to land owner and municipality of 0.50 €/MWh. Lifetime is estimated to 20 years, availability is 97%, and each wind farm has 18 NEG Micon mills of 2.75 MW, giving a total of 49.5 MW. Construction time is 1.75 years, and inflation is set to 2.5%. Fig. 3 shows the resulting net present value for the low ambition level, for varying rates of return and for the three different wind power classes. If the discount interest rate is above 5.3%, which is reasonable to assume, then we can conclude that very little wind power will be built in the low ambition level scenario. However, at a high ambition level of 41 TWh/yr, with present values shown in Fig. 4, wind power appears attractive for average wind speeds above 8.5 m/s and at rates of return lower than 5.3%. The certificate price corresponds to an investment grant of 23-36% of total investment for rates of return in the 4-6% interval. Inflow Svorka 0 2 4 6 8 10 12 14 1 4 7 10 13 16 19 22 25 28 31 34 37 40 43 46 49 52 Week m3/s
The cost of electricity, defined as the annuity of the investment cost, plus all other (annualized) cost elements except depreciation, divided by the annual generation, is e.g. 41.8 €/MWh for the best wind class at the highest ambition level and using a required return of 6%.
The small hydropower projects we consider have operations and maintenance cost, including cost of insurance, of 1.25% of investment cost. We use the same per unit cost estimates as for wind power regarding transmission services, balancing services, and property tax. Fig. 5 shows net present value of the three profitability classes for varying levels of rate of return; renewable policy ambition level is the low 31 TWh/yr. We see that the attractiveness of hydropower is much greater than that of wind power. For class 2, the base case, the internal rate of return is 6.9%. For the class of more profitable projects, the profitability is excellent. For the class of least profitable projects, very little capacity is likely to be built. This unless for instance the winter production is very high compared to annual production. For the high ambition level, the corresponding net present values are shown in Fig. 6. From this we see that profitability is very good in classes 1 and 2. The projects in these classes will to an extent be free riders in the electricity certificate arrangement. The cost of electricity for the base class 2 at 6% required rate of return in the high ambition scenario is 33 €/MWh.
Fig. 3. Net present value for wind power for new renewable ambition level of 31 TWh/yr, for three levels of average wind speed; 9.0 m/s (solid line), 8.5 m/s (dash line) and 8.0 m/s (dotted line), and for varying rates of return.
NPV for low ambition level (NEG Micon 2750/92)
-20 -15 -10 -5 0 5 10 4 % 5 % 6 % 7 % ERT after Million
Fig. 4. Net present value for wind power for new renewable ambition level of 41 TWh/yr, for three levels of average wind speed; 9.0 m/s, 8.5 m/s and 8.0 m/s, and for varying rates of return.
Fig. 5. Net present value for hydropower for new renewable ambition level of 31 TWh/yr, for three levels of investment cost to annual generation; 0.19 €/kWh, 0.29 €/kWh and 0.38 €/kWh, and for varying rates of return.
Fig. 6. Net present value for hydropower for new renewable ambition level of 41 TWh/yr, for three levels of investment cost to annual generation; 0.19 €/kWh, 0.29 €/kWh and 0.38 €/kWh, and for varying rates of return.
NPV for high ambition level (NEG Micon 2750/92)
-15 -10 -5 0 5 10 15 4 % 5 % 6 % 7 % ERT after Million
Class 1 Class Class 3
NPV for low ambition level
-3 -2 -1 0 1 2 3 4 5 4 % 5 % 6 % 7 % ERT after tax Million €
Class Class Class 3
NPV for high ambition level
-2 -1 0 1 2 3 4 5 4 % 5 % E 6 % 7 % RT after Million
4.
P
ROJECT ANALYSIS UNDER UNCERTAINTYThe net present value analyses such as the ones displayed above represent a deterministic view of the world. In reality investors can postpone the start of power projects in order to benefit from added information about realization of uncertainty in e.g. prices before sinking the investment. For each project there will be a trigger profitability level below which the investor will wait further, even though net present value may be positive. We will use the total price, the sum of wholesale electricity price and electricity certificate price, as the profitability indicator. We take the tradeoffs associated with waiting or investing now into account as shown below.
4.1 Individual project strategy
Projects above 1 MW installed capacity will need to acquire a license to invest. Such licenses have a limited number of years to expiry, and near expiry the investor seemingly faces a now-or-never choice of investing then or never. However, the investor can apply for an extension, or simply apply for a new license. With this in mind we assume that the investment opportunity does not expire.
The value of the investment opportunity is a real option that will be valued using the methods explained by Dixit and Pindyck (1994). Given the prices processes (2), (3) and (7), the trigger profitability level depends on the short term factor, the long term factor and the electricity certificate price level. The problem of analyzing the investment decision thus has three dimensions, and is quite complex. To lower the complexity, we approximate the uncertainty of the problem by aggregating the three prices processes into one, the total electricity price. Analysis of the error of this simplification is left for future work.
The aggregation is explained next. We first use Monte Carlo simulation of the price processes (2), (3) and (7). From this we get a distribution of the total price, which we subsequently approximate to a one-factor geometric Brownian motion process of the form
dz P dt
P
dPTOT =
α
ˆ⋅ TOT ⋅ +σ
P ⋅ TOT ⋅ (8) where dPTOT is the change in total price,α
ˆ
is the growth parameter and σP is the volatility parameter. For the low ambition level we get a slightly negativeα
ˆ
, and for the high ambition level we get a slightly positiveα
ˆ
. Annual volatility is set to max 30%.From the theory (Dixit and Pindyck (1994)) we know that the value of the investment opportunity, F, can be expressed as
( TOT) TOT
F P = ⋅C P β (9) where C is a constant to be determined, and β > 1 is given by
2 2 2 2 2 ˆ ˆ 1 1 2 2 f P P P r α α β σ σ σ ⋅ ⎡ ⎤ = − + ⎢ − ⎥ + ⎣ ⎦ (10) where rf is the risk free rate of interest. The constant C and the trigger price PTOT* is calculated from the so-called value matching and smooth pasting conditions, stating that when investing the value of the investment opportunity equals the net present value, and that at the point of investment the derivative of the investment opportunity (as a function of total price, an exponential function) equals the derivative of the net present value. The reader is referred to Dixit and Pindyck (1994) for details; note that with our assumptions all projects will have a net present value that is linear in the total price of electricity. If the net present value is expressed using constants a and b as follows,
( TOT) TOT
NPV P = ⋅a P +b (11) then the trigger price and the constant C is
* TOT b P a a β = ⎛ − ⎞ ⎜ ⎟ ⎝ ⎠ (12) *( 1) TOT a C P β β − = ⋅ (13)
We also calculate the probability P of the total price reaching the trigger level, and the expected time E(T*) to this happening, assuming that the starting level is lower than the trigger. The formulas are given below (Rhys, Song and Jindrichovska (2002)):
( )
2 * * 2 1 ˆ ln 0 P TOT TOT P P T Eσ
α
− ⋅ ⎟ ⎟ ⎠ ⎞ ⎜ ⎜ ⎝ ⎛ = (14) 1 ˆ 2 * 2 0 − ⋅⎟
⎟
⎠
⎞
⎜
⎜
⎝
⎛
=
P TOT TOTP
P
P
σ α (15) Option values and net present values as a function of total price can be shown as in Fig. 7, for wind power class 1 (9.0 m/s) and a high renewable capacity ambition level. The option has no value for low price levels, but starts to increase when the total price exceeds ca. 31 €/MWh. At a price of 57.6 €/MWh, the trigger level, one can see that the option value equals the net present value, and the option value curve touches the net present value curve tangentially. At this level of net present value it is optimal to invest.Fig. 7. Net present value and real option value for a wind power project in class 1, for new renewable ambition level of 41 TWh/yr.
4.2 Strategies for all projects
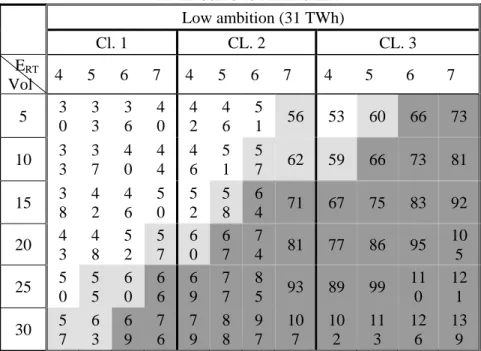
The results of the real options analysis are shown in tables below. The results vary on the policy ambition level, the profitability class, the required rate of return and the volatility of total price. In the tables, cells are coded using shades of gray: White means that the trigger price has been reached already, there is no value in waiting and the project should be started as soon as possible. Light gray means that total price is close to the trigger price, and that there is little reason to postpone the project further.
Medium gray means that the trigger price will be reached with probability one at some point in the future, so it is optimal to wait. Dark gray means that the trigger level most likely is never going to be reached. These projects are not likely to ever be built. The numbers inside the cells are the trigger price levels.
Project value -70 -60 -50 -40 -30 -20 -10 0 10 20 30 10 20 30 40 50 60 70 Trigger PTOT* (€/MWh) Million€ NPV Real option
Wind power results are in Tables II and III, and hydropower results in Tables IV and V.
TABLEII
RESULTS OF REAL OPTIONS ANALYSIS OF WIND POWER PROJECTS FOR LOW AMBITION LEVEL, FOR VARYING VOLATILITY OF TOTAL PRICE (%) AND MINIMUM ACCEPTABLE RATE OF RETURN IN %.TRIGGER LEVELS ARE SHOWN IN CELLS IN
€/MWh.WHITE MEANS THAT THE TRIGGER PRICE HAS ALREADY BEEN REACHED,LIGHT GRAY MEANS THAT TOTAL PRICE IS CLOSE TO THE TRIGGER PRICE,MEDIUM GRAY MEANS THAT IT IS OPTIMAL TO WAIT.FOR VOLATILITY LEVELS
OF σp=15 OR HIGHER, THE TRIGGER PRICES ARE ALL VERY HIGH AND ARE NOT SHOWN.
Cl. 1 Cl. 2 Cl. 3 ERT Vol 4 5 6 7 4 5 6 7 4 5 6 7 5 5 1 5 5 5 9 6 3 5 4 5 9 6 3 6 8 5 9 6 3 6 8 7 3 10 5 6 6 1 6 5 7 0 6 0 6 5 7 0 7 5 6 5 7 0 7 6 8 1 TABLEIII
RESULTS OF REAL OPTIONS ANALYSIS OF WIND POWER PROJECTS FOR HIGH AMBITION LEVEL, FOR VARYING VOLATILITY OF TOTAL PRICE (%) AND MINIMUM ACCEPTABLE RATE OF RETURN IN %.TRIGGER LEVELS ARE SHOWN IN
CELLS IN €/MWh. LIGHT GRAY MEANS THAT TOTAL PRICE IS CLOSE TO THE TRIGGER PRICE,MEDIUM GRAY MEANS THAT IT IS OPTIMAL TO WAIT, AND DARK GRAY MEANS THAT THE TRIGGER LEVEL MOST LIKELY IS NEVER GOING TO BE
REACHED. Cl. 1 Cl. 2 Cl. 3 ERT Vol 4 5 6 7 4 5 6 7 4 5 6 7 5 5 6 6 1 6 5 7 0 6 0 6 5 7 0 7 5 6 5 7 0 7 5 8 1 10 6 7 7 3 7 8 8 4 7 2 7 8 8 3 9 0 7 8 8 4 9 0 9 7
TABLEIV
RESULTS OF REAL OPTIONS ANALYSIS OF HYDROPOWER PROJECTS FOR LOW AMBITION LEVEL, FOR VARYING VOLATILITY OF TOTAL PRICE (%) AND MINIMUM ACCEPTABLE RATE OF RETURN IN %.TRIGGER LEVELS ARE SHOWN IN
CELLS IN €/MWh.WHITE MEANS THAT THE TRIGGER PRICE HAS ALREADY BEEN REACHED,LIGHT GRAY MEANS THAT TOTAL PRICE IS CLOSE TO THE TRIGGER PRICE, AND DARK GRAY MEANS THAT THE TRIGGER LEVEL MOST LIKELY IS
NEVER GOING TO BE REACHED.
Low ambition (31 TWh) Cl. 1 CL. 2 CL. 3 ERT Vol 4 5 6 7 4 5 6 7 4 5 6 7 5 3 0 3 3 3 6 4 0 4 2 4 6 5 1 56 53 60 66 73 10 3 3 3 7 4 0 4 4 4 6 5 1 5 7 62 59 66 73 81 15 3 8 4 2 4 6 5 0 5 2 5 8 6 4 71 67 75 83 92 20 4 3 4 8 5 2 5 7 6 0 6 7 7 4 81 77 86 95 10 5 25 5 0 5 5 6 0 6 6 6 9 7 7 8 5 93 89 99 11 0 12 1 30 5 7 6 3 6 9 7 6 7 9 8 8 9 7 10 7 10 2 11 3 12 6 13 9
TABLEV
RESULTS OF REAL OPTIONS ANALYSIS OF HYDROPOWER PROJECTS FOR HIGH AMBITION LEVEL, FOR VARYING VOLATILITY OF TOTAL PRICE (%) AND MINIMUM ACCEPTABLE RATE OF RETURN IN %.TRIGGER LEVELS ARE SHOWN IN
CELLS IN €/MWh.WHITE MEANS THAT THE TRIGGER PRICE HAS ALREADY BEEN REACHED,LIGHT GRAY MEANS THAT TOTAL PRICE IS CLOSE TO THE TRIGGER PRICE,MEDIUM GRAY MEANS THAT IT IS OPTIMAL TO WAIT, AND DARK GRAY
MEANS THAT THE TRIGGER LEVEL MOST LIKELY IS NEVER GOING TO BE REACHED.
High ambition (41 TWh) CL. 1 CL. 2 CL. 3 ERT Vol 4 5 6 7 4 5 6 7 4 5 6 7 5 34 37 40 44 47 52 57 62 60 67 74 81 10 40 44 48 416 56 62 68 75 72 79 88 97 15 48 53 58 63 66 74 81 89 85 95 105 115 20 57 63 68 75 79 88 96 106 102 113 125 137 25 67 74 81 88 94 104 114 125 120 134 148 162 30 79 87 95 104 110 122 134 147 141 157 174 191 4.3 The potential
In order to separate small hydropower from other hydro, and to separate the three cost classes, we have used data from the Norwegian Water Resources and Energy Directorate regarding hydropower projects that are under construction, have a license, not under license duty, and prenotified. This data contains information on installed capacity, annual generation, investment cost for 659 projects. From these we have extracted 258 projects that are between 1 and 10 MW and that fall within our cost classification. This will provide a picture of the potential for small hydropower in Norway, and aggregate information is shown in Table VI.
TABLEVI
TOTAL POTENTIAL OF NEW SMALL HYDROPOWER PROJECTS.
Class TWh/yr (%)
Cl. 1 3.36 28.0
Cl. 2 4.36 36.3
Cl. 3 4.28 35.7
TABLEVII
TOTAL POTENTIAL OF NEW WIND POWER PROJECTS. Average wind speed TWh/yr
> 9 m/s 15 8.0-8.9 m/s 31 7.0-7.9 m/s 62
Regarding wind power, a similar analysis has been done by ECON (2004), resulting in Table VII. An assumption made is that no more than 0.8 TWh/yr is built in Finnmark county in the north; larger capacity requires very costly transmission expansion.
By combining the results of the analysis of the potential with the cost and profitability analysis done in the previous section, it is possible to construct cost of electricity curves as shown below in Fig. 8, for two different levels of the required rate of return.
Fig. 8. Cost of electricity curves for increasing levels of annual generation.
We see that an increase in the required rate of return from 5% to 6% makes the cost increase by roughly 2.5 €/MWh. Up to 12 TWh it is small hydropower that dominates the cost curve. Increasing capacity from 12 TWh on the cost curve requires mainly wind power. The cost curve does not reflect barriers such as acquiring a license, financing, network bottlenecks, capacity limitations regarding engineering and construction services etc.
5.
P
ATH OF EXPANSIONIn order to consider the path of capacity expansion, it is necessary to synthesize the net present value analysis, the analysis under uncertainty, and the technical-economic potential. The goals of the main subsidizing governmental institution for these kinds of projects, ENOVA SF, and the Norwegian Water Resources and Energy Directorate’s record of licensed projects, projects for which a license application is being processed, and prenotified projects, are also taken into account in the expansion path consideration. Our uncertainty analysis does not give a path of expansion through time, so the discussion will to an extent be qualitative, and regards the period from 2005 to 2016.
Since policy measures such as the one discussed here will lead to different benefits and losses for different types of producers and consumers on either side of the national border, a major issue in the policy debate is distribution of these benefits and losses. In fact this issue lead to a temporary halt in the progress toward a joint Norwegian-Swedish electricity certificate market. An analysis of the distribution
Cost curve for windpower and small hydro
0 10 20 30 40 50 60 0 4 8 12 16 20 24 28 32 36 40 44 48 52 56 Annual generation [TWh] €/MW 6 % 5 %
of benefits and losses is left for future work.
5.1 Low ambition level
Installed wind power is currently 0.48 TWh/yr in Norway, and additionally 1.67 TWh/yr under contract with ENOVA will come online by 2007. Thereafter we estimate that licensed projects will be built, so that by 2010 there will be 3.2 TWh/yr wind power in Norway. There are two main reasons for this, first that ENOVA is initiating a round of investment grant calls for wind power in order to reach its objective of 3 TWh/yr wind power within 2010. Second, expiring wind power licenses makes the investment decision into a now-or-never problem, because the government may give the license to a competing party, or may not renew the license. I.e. the net present value analysis is the relevant decision base, and there are some 1.5 TWh/yr projects with sufficient profitability. Between 2010 and 2016 there will hardly come additional wind power.
Regarding hydropower, there are a lot of projects coming online in the 2005-2007 period, judging by the current activity. Until 2010, even the analysis that takes into account price uncertainty shows that there are many projects where the investors will want to initiate project development instead of waiting for better information/higher prices. See Table IV. Up to 2011 we thus estimate that there will be a development of 4 TWh. This is somewhat more than the class 1-row in Table VI. We have added an extra year (2010 to 2011) in order to include latecomers that will exist due to e.g. barriers such as acquiring a license and financing, and capacity limitations regarding engineering and construction services. By 2016 we assume that 80% of the potential in classes 1 and 2 (see Table VI) will be built. The remaining 20% may not be built at all due e.g. to the mentioned barriers. Projects in class 3 will hardly be realized.
To sum up, with a low ambition level of 31 TWh/yr for the electricity certificate arrangement, Norway can contribute with roughly 9.4 TWh/yr within 2016 from wind power and small hydro.
5.2 High ambition level
The development of wind power is assumed to follow the same path as for the low ambition level until 2010. Certificate prices are higher in this scenario, making more projects profitable, even taking into account the uncertainty and the alternative of waiting to develop. With 80% of wind class 1 being developed, 12 TWh/yr will come online. Wind classes 2 and 3 have projects with too low profitability to be developed.
Hydropower projects are even more profitable in the high ambition level scenario. We assume the same path of expansion for hydropower class 1 as for the low ambition level until 2011. Regarding class 2, we assume that investors will delay construction longer due to the real option value. The rate of development will thus be higher in the 2011-2016 period than in the 2005-2011 period. In total we assume that ca. 6.2 TWh/yr from the two best hydropower classes will be developed until 2016, and that none of the projects in class 3 will be profitable enough.
With a high ambition level of 41 TWh/yr for the electricity certificate arrangement, Norway can contribute with ca. 18.2 TWh/yr from wind power and small hydropower.
6.
SUMMARY AND CONCLUSIONBased on a number of qualified assumptions, e.g. regarding the growth of electricity certificate prices, we derive predictions regarding the amount of new renewable capacity coming online under a joint Swedish-Norwegian electricity certificate scheme. We use the information in electricity forward and futures contracts to take into account the uncertainty, and the value of waiting, in the profitability of new renew-able generation capacity. Thus we demonstrate the use of a real options framework to analyse aggregate effects of energy policy measures. With a low ambition level for the electricity certificate arrangement, we
expect that 3.2 TWh/yr wind power and 6.2 TWh/yr hydropower is built in Norway by 2016. With a high ambition level we expect 12 TWh/yr wind power and 6.2 TWh/yr hydropower. Wind power has particularly high (option) value of waiting, making much wind capacity come online towards the end of the considered horizon.
7.
A
CKNOWLEDGMENTSThe authors gratefully acknowledge ENOVA SF, Norwegian Meteorological Institute, SWECO Grøner, Norwegian Water Resources and Energy Directorate, and professor Å. Killingtveit for providing data. We thank the anonymous reviewers. Fleten acknowledges support from the Research Council of Norway through project 178374/S30, and through the ELDEV project at Sør-Trøndelag University College.
8.
R
EFERENCESL. M. Abadie and J. M. Chamorro (2008), “Valuing flexibility: The case of an Integrated Gasification Combined Cycle power plant”, Energy Economics 30(4), 1850-1881
A. Botterud and M. Korpås (2007), “A stochastic dynamic model for optimal timing of investments in new generation capacity in restructured power systems“, International Journal of Electrical Power & Energy Systems 29(2), 163-174
T. Bøckman, S.-E. Fleten, E. Juliussen, H. J. Langhammer and I. Revdal (2008), ”Investment timing and optimal capacity choice for small hydropower projects”, European Journal of Operational Research 190, 255–267
P.F. Correia, P.M.S. Carvalho, L.A.F.M. Ferreira, J. Guedes and J. Sousa, (2008) “Power plant multistage investment under market uncertainty”, IET Generation, Transmission & Distribution, 2(1), 149-157 G. Cortazar and E. S. Schwartz (2003), “Implementing a stochastic model for oil futures prices”, Energy
Economics 25, 215-238
S.-J. Deng, B. Johnson and A. Sogomonian (2001), “Exotic electricity options and the valuation of electricity generation and transmission assets”, Decision Support Systems 30(3), 383-392
A. Dixit and R. Pindyck (1994), “Investment Under Uncertainty”, Princeton University Press
ECON (2004), “Konsekvenser av sertifikatmarked i Norge” (Consequences of a Certificate Market in Norway, in Norwegian), Report 2004-108, ECON Pöyry, Oslo
S.-E. Fleten, K. M. Maribu and I. Wangensteen (2007), ”Optimal investment strategies in renewable distributed generation under price uncertainty”, Energy 32 (5), 803–815
S.-E. Fleten and E. Näsäkkälä (2003), “Gas-fired power plants: investment timing, operating flexibility and CO2 capture”, Working paper 04-03, Department of Industrial Economics and Technology
Management, Norwegian University of Science and Technology
S. Fuss, J. Szolgayova, M. Obersteiner and M. Gusti (2008), “Investment under market and climate policy uncertainty”, Applied Energy 85(8), 708-721
K. Hofstad (2002) ”Kostnader ved produksjon av kraft og varme i 2002” (Costs of Generating Heat and Power in 2002, in Norwegian), Norwegian Water Resources and Energy Directorate Handbook T. Jensen (2004), “Beregning av potensial for små kraftverk i Norge” (Estimation of the Potential for
Small Power Plants in Norway, in Norwegian), Norwegian Water Resources and Energy Directorate Report 19, 2004
S. G. Jensen and K. Skytte (2002), ”Interactions between the power and green certificate markets,” Energy Policy 30(5), 425-435.
J. Keppo and H. Lu (2003), “Real options and a large producer: the case of electricity markets”, Energy Economics 25(5), 459-472
F. Kjærland (2007), “A real option analysis of investments in hydropower—The case of Norway”, Energy Policy 35(11), 5901-5908
H. Laurikka and T. Koljonen (2006), “Emissions trading and investment decisions in the power sector—a case study in Finland”, Energy Policy 34(9), 1063-1074
J. L. Lucia and E. S. Schwartz (2002), "Electricity Prices and Power Derivatives, Evidence from the Nordic Power Exchange”, Review of Derivatives Research 5 (1), 5-50.
K. M. Maribu, R. M. Firestone, C. Marnay and A. S. Siddiqui (2007), “Distributed energy resources market diffusion model”, Energy Policy 35(9), 4471-4484
R. McDonald and D. Siegel (1986), “The value of waiting to invest”, The Quarterly Journal of Economics 101(4), 707–728
Norwegian Water Resources and Energy Directorate (2003), ”Veileder i planlegging, bygging og drift av små kraftverk” (Guide to Planning, Building and Operating Small Power Stations, in Norwegian), Report 2, 2003.
E. Näsäkkälä and S.-E. Fleten (2005), “Flexibility and technology choice in gas fired power plant investments”, Review of Financial Economics 14(3-4), 371-393
H. Rhys, J. Song and I. Jindrichovska (2002), “The timing of real options exercise: Some recent developments”, The Engineering Economist, 47 (4), 436-450
A. Siddiqui and C. Marnay (2008), “Distributed generation investment by a microgrid under uncertainty”, Energy 33(12), 1729-1732
Statens energimyndighet (2005), ”Konsekvenserna av en utvidad elcertifikatmarknad” (Consequences of an Expanded Electricity Certificate Market, in Swedish), Energimyndighetens förlag, ER 2005:07.