REPUBLIC OF KENYA MINISTRY OF HEALTH
STRENGTHENING
RESOURCE TRACKING
AND MONITORING
HEALTH EXPENDITURE
REPUBLIC OF KENYA MINISTRY OF HEALTH
ACKNOWLEDGMENTS
This final report was prepared jointly by David Morgan and Yuki Murakami from the OECD Health Division, together with Nirmala Ravishankar, consultant, and David Njuguna of the Kenyan Ministry of Health.
The work was made possible due to the generous financial support of the Government of Japan, and the cooperation of the Ministry of Health, Kenya.
TABLE OF CONTENTS
.. 3
... ACKNOWLEDGMENTS ... 4
1. INTRODUCTION ... 7
Background and aims ... 7
Health resource tracking ... 7
Outline of study and report ... 9
2. THE TWO WORLDS OF TRACKING RESOURCES FOR HEALTH ... 11
Global development assistance tracking ... 11
National Health Resource Tracking Methods ... 15
Accounting Foreign Aid under the System of Health Accounts ... 16
3. BRIDGING THE GAP ... 20
4. THE KENYAN CONTEXT ... 28
Health Resource Tracking in Kenya ... 28
Inventory of Kenya-based Donor Tracking Systems ... 30
Shadow Budget ... 30
GOK’s External Resource Database (ERD) ... 31
Creditor Reporting System ... 32
Comparing CRS with Country Data Sources ... 32
Channel of delivery ... 34
5. CONCLUSIONS ... 36
BIBLIOGRAPHY ... 38
Tables Table 1. External resources as a share of health spending ... 7
Table 2. Possible health purpose codes in the Creditor Reporting System (CRS)... 13
Table 3. Classification of revenues of financing schemes (FS) in SHA 2011 ... 18
Table 4. Type of finance in DAC statistics and Revenues of financing schemes (FS) in SHA 2011 ... 22
Table 5. Correspondence between SHA 2011 and Type of aid in DAC statistics ... 23
Table 6. Comparing disbursements to GoK from the CRS and the ERD for FY 2009/10 ... 35
Figures Figure 1. A graphical representation of foreign flows and institutional units in the health system ... 17
Figure 2. Default mapping on CRS purpose codes for health to the SHA 2011 HC functional
classification ... 25
Figure 3. Theoretical correspondence between International aid statistics and the SHA 2011 framework26 Figure 4. Comparison of CRS and NHA estimates for Kenya ... 27
Figure 5: Sources of financing for health expenditure in Kenya ... 28
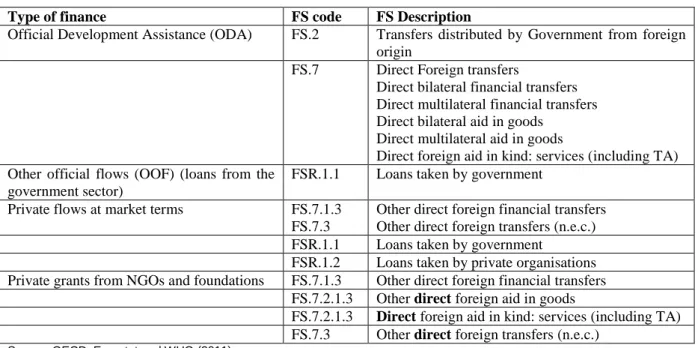
Figure 6. Financing agents responsible for implementing donor-financed programs in FY 2009/10 ... 29
Figure 7. Planned and actual spending by donors in FY 2010/11 as reported in the Shadow Budget... 30
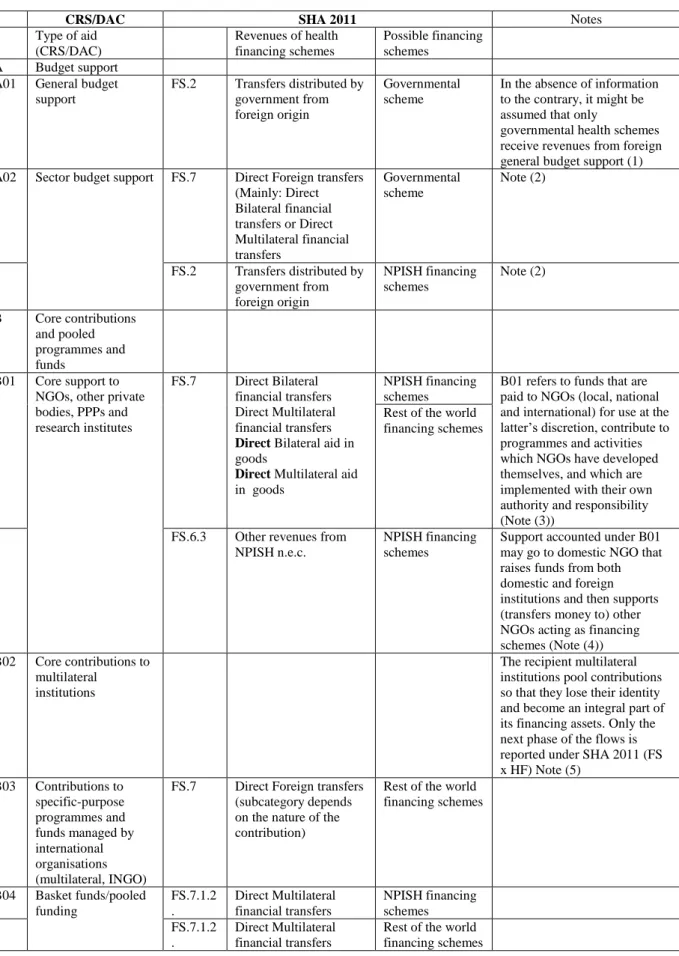
Figure 8. Donor disbursements to GoK as measured by the National Treasury ... 31
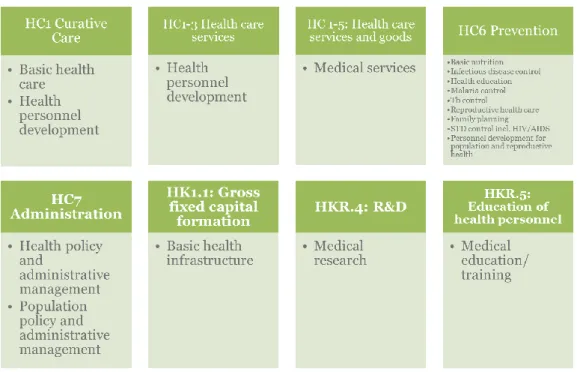
Figure 9. Disbursements to GoK by donor as reported by the National Treasury ... 31
Figure 10. Trends in donor disbursements to Kenya as reported by donors to the CRS ... 32
Figure 11. Comparing disbursements from CRS with expenditure reported in the Shadow Budget, 2010/11 ... 34
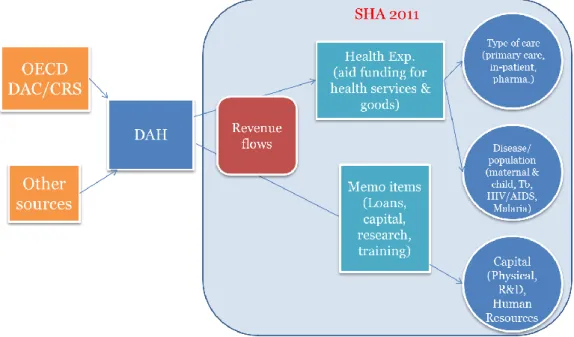
Boxes Box 1. OECD Data on Aid Flows ... 11
1. INTRODUCTION
Background and aims
1. Demand for clear and consistent tracking of funds through the health system - both foreign and domestic - is growing among governments, external partners, and the public alike. Furthermore, external aid for health is increasingly comes from private foundations, in addition to the traditional bilateral and multilateral sources. The effective tracking of such resources is therefore an important policy issue for all relevant stakeholders. Thus, the goal of this study is to better understand and analyse how developing countries assess how financial resources for health are mobilised, managed and ultimately used.
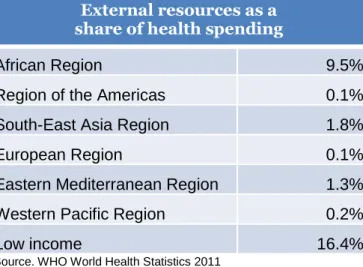
2. Foreign assistance and other foreign resource flows can play an important role in financing health care in many lower income countries (Table 1). For tracking, both national health expenditure accounts and international aid statistics produce estimates of the flows of external resources into a country's health system. However, to answer policy questions around financial sustainability and fungibility, it is vital to understand and explain the linkages and differences between these various sets of statistics, and to demonstrate how they can most effectively complement each other.
Table 1. External resources as a share of health spending
External resources as a share of health spending
African Region 9.5%
Region of the Americas 0.1%
South-East Asia Region 1.8%
European Region 0.1%
Eastern Mediterranean Region 1.3%
Western Pacific Region 0.2%
Low income 16.4%
Source. WHO World Health Statistics 2011
Health resource tracking
3. Health resource tracking refers to the various frameworks, methods, and data systems for measuring and analysing the flow of resources into the health sector (Center for Global Development, 2007). Existing health resource tracking activities can generally be categorized into two groups: international development assistance tracking and national health expenditure tracking (Powell-Jackson and Mills, 2007). An understanding of the links between the two would provide a better picture of the flow of financial assistance by country.
4. International development assistance tracking focuses on measuring donor assistance for health at the global level, typically in terms of aid commitments and disbursements1. Among the most authoritative sources, the OECD Development Assistance Committee (DAC) tracks bilateral and multilateral donors’ aid and other resource flows to developing countries, both at the aggregate level and also at the level of particular aid programmes via its Creditor Reporting System (CRS) database.
5. The second group of health resource tracking activities focuses on analysing health expenditure patterns at the country level. The systematic measurement of health expenditures using Health Accounts is the foremost methodology for national health expenditure tracking. It has been used by over 130 countries world-wide to measure and analyse national health spending (World Bank, 2010).
6. OECD has been at the forefront of efforts to develop comparable health expenditure and financing data through the application of a standard national health accounting framework. As an international framework to produce health accounts, the System of Health Accounts 2011 (SHA) provides a systematic description of the financial flows, showing where the money comes from, how it is organised, and how it is ultimately used. It enables low- and middle-income countries (LMICs) to provide a more transparent picture of foreign assistance, with a particular focus on assessing trends in aid volatility and financial sustainability, and also assists bilateral and multilateral donors in the effective management of aid funding and resource tracking. The use of health accounts is thus a powerful tool in resource-tracking activities. Other country-level resource-tracking activities may have a narrower focus such as analysing public sector spending for health, the flow of resources from the national level to service providers through various levels of government, spending for specific priority diseases (HIV/Aids, Malaria, Tb), etc.
7. Understanding and accounting for external flows into a country’s health system is a key component of national health expenditure tracking activities in LMICs. Indeed, distinguishing between domestic and international sources of revenue for health expenditure at the country level and disease/population level is a critical aspect of their health accounts. To this end, countries have either used ad hoc surveys of donors or set up local databases to collect information on donor assistance in the country. 8. To date, very little effort has been invested in linking these country-based tracking activities to the international development assistance statistics, such as CRS. Few have compared information reported by donors to the CRS with information that is captured at the country level by national systems for development assistance tracking. Undertaking such a comparison is therefore important for two reasons. First, it directly leads to greater transparency and accountability in donor financing, which is a core principle of the Paris Declaration on Aid Effectiveness2, and to the reliability of the information donors are reporting about their aid programmes. Second, as countries seek to make resource-tracking frameworks, such as SHA, into routine exercises, separate and costly data collection exercises may be avoided if the CRS can provide a consistent, exhaustive and reliable base of information on donor flows needed by countries to undertake health accounts estimations.
9. With this in mind, this project first examines the conceptual and definitional differences between the two statistical systems and attempts to make linkages. Then, using a specific country, the project looks in detail at the various national and international data sources used in the construction of the health accounts and how this may explain any divergence from international aid statistics.
1
See Section 3 for a discussion of the differences between commitments, disbursements and expenditures.
2 At the Second High Level Forum on Aid Effectiveness (2005) it was recognised that aid could - and should
- be producing better impacts. The Paris Declaration was endorsed in order to base development efforts on first-hand experience of what works and does not work with aid. It is formulated around five central pillars: Ownership, Alignment, Harmonisation, Managing for Results and Mutual Accountability. http://www.oecd.org/dac/effectiveness/parisdeclarationandaccraagendaforaction.htm
10. Kenya is used as the case study to take a closer look at and compare all available data sources for information on development assistance for health in the country. Kenya has undertaken multiple rounds of health accounts in the past and is about to start health account production for the 2012-2013 fiscal year (FY). The authors of the case study3 are both part of the health accounts team at the Ministry of Health (MOH). As part of the data collection planning process, the team started taking stock of all available secondary data sources for information on health expenditure in Kenya. Using existing routine data systems for tracking donor assistance is preferable to administering a separate survey to collect this information. The case study explores the following two research questions: First, what are the different data sources for tracking development assistance for health in Kenya and how comparable are they? Second, can the CRS yield reliable information that can be used on a routine basis for health accounts estimations, thereby eliminating the need for separate, stand-alone surveys of donors and implementing partners?
11. The result of this study should enable a clearer and more consistent tracking of funds through the health system, responding to the information needs of government, external partners and the public alike. This requires the involvement and commitment of donors, international agencies and the countries themselves.
Outline of study and report
12. The report begins with an examination of the various concepts and definitions of both donor disbursement statistical systems and the health expenditure and financing framework, examining potential links between the different systems, and investigating observed differences in the estimations of external resources for health. Then, using country-level data, the study demonstrates how the reported donor resources (and domestic funding) can be tracked through the Health Accounts. In detail the two phases of the project are:
1. A study of the CRS (donor disbursement statistics) and SHA (health expenditure and financing) frameworks to develop the theoretical linkages and mapping between the two systems to track foreign aid and assistance through the health system. This covers the various definitions, concepts and boundaries of the health sector as a whole and at the disease or population (i.e. maternal and child) programme level. Particular issues regarding the accounting of specified and general budget support, technical assistance, administration costs, etc. are examined.
2. Kenya is developing detailed health accounts to demonstrate how the reported donor resources (and domestic funding) can be tracked through the health system, e.g. in the area of maternal and child health, using the methodologies outlined in the SHA 2011. Work consists of carrying out a detailed review of different data sources on donor funding including the CRS, Kenya’s own national budget for on-budget support and its shadow budget for off-budget aid, the Electronic Project Monitoring Information System developed by Ministry of Finance and Treasury, and other development partners’ data. The case study examines how well these sources complement each other to give a complete data trail from commitment to disbursement to final expenditure of funds.
13. Recommendations are made regarding how to reduce disparities between the reporting systems, which could be applied to other countries' data systems as well as international data collection efforts. An assessment can be made regarding how to replicate the model across other developing countries with a strong need for improved monitoring of health spending and further development of standardised accounting using the SHA framework.
14. The remainder of this report is organised in the following way. Section 2 below discusses the two systems of resource tracking in greater detail. Section 3 discusses the potential for linking the CRS with country-level health expenditure analysis activities.
15. The case study for Kenya is then discussed in detail in Section 4 showing the various data sources and compilation issues. Finally, Section 5 offers some concluding remarks and recommendations for improving the understanding and compilation of statistics on external resources.
2. THE TWO WORLDS OF TRACKING RESOURCES FOR HEALTH
Global development assistance tracking
16. At the global level, health resource tracking has focused on tracking how much health-related aid is flowing from various donors to low- and middle-income countries (LMICs) and analysing its composition. Data on aid flows compiled by OECD has historically served as the backbone for global development assistance tracking activities. Specifically, OECD’s CRS database (see Box 1), which captures activity-level information on development assistance from member countries, several multilateral agencies and some large private foundations, has been the single most important source of information for most international health resource tracking efforts (Powell-Jackson and Mills, 2007).
Box 1. OECD Data on Aid Flows
The OECD DAC (Development Assistance Committee4) databases distinguish between:
Commitments: refers to the funds set aside to cover the costs of projects, which can span several years;
Disbursements: refers to the placement of resources at the disposal of the recipient. Disbursements record the actual international transfer of financial resources, or of goods or services valued at the cost to the donor.
DAC statistics are categorised by Type of finance; Sector/purpose; and Type of aid. The DAC sector classification contains health (health general and basic health); and aid to health is sub-divided in 2 sectors and 17 sub-sectors (OECD-DAC, 2009)
The categories of the type of finance in DAC statistics are:
Official Development Assistance (ODA): Grants or loans from public funds to promote the economic development and welfare of developing countries. To qualify as ODA, loans must have a grant element of 25% or more;
Other official flows (OOF), comprising (i) loans from the government sector which are for development and welfare but not sufficiently concessional to qualify as ODA; and (ii) grants and loans from the government sector not specifically directed to development or welfare purposes (e.g. official export credits);
Private flows at market terms (e.g. foreign direct investment, bank loans); and Private grants from NGOs and foundations.
DAC statistics also make a distinction between:
Outflows of resources from donor countries to recipient countries and multilateral agencies5; and
Receipts of developing countries. These comprise donors’ bilateral transactions with the recipients (ODA, OOF6 and private) and outflows from multilateral agencies (concessional and non-concessional).
4 The DAC currently comprises 29 members, including the European Union. 5
The DAC-CRS statistics, in addition to the DAC members, comprises multilateral agencies, 2 non-DAC countries (Kuwait and UAE) and one private donor: Bill and Melinda Gates Foundation.
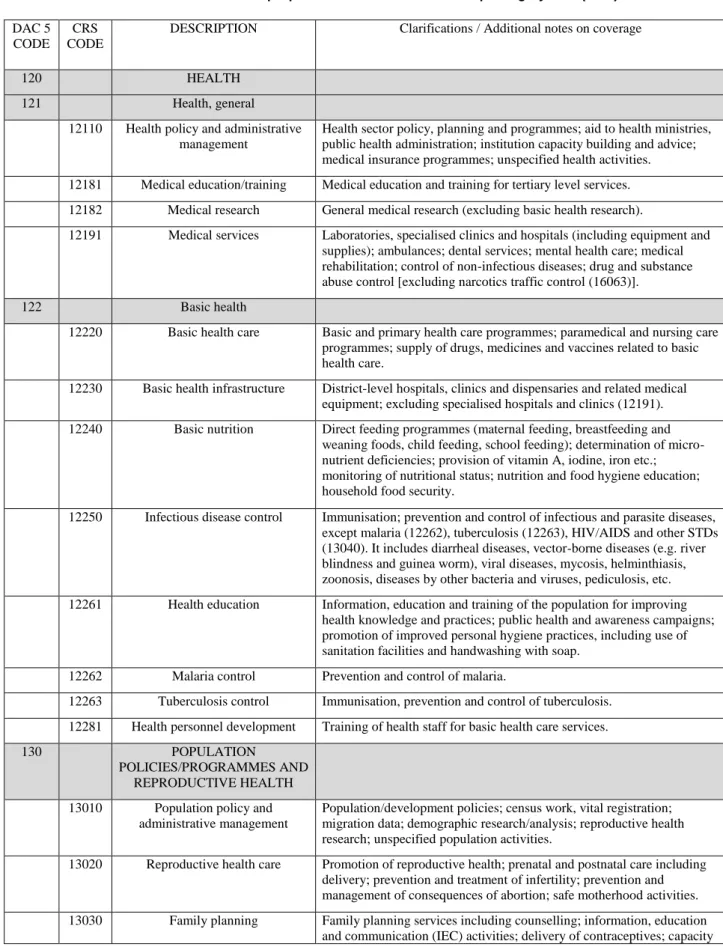
17. The CRS tracks official development assistance, which includes both grants and loans given on concessional terms7. For each activity – which could be a project or a programme – the database tracks both the amount of funding committed by the donor at the start of the activity and actual funds disbursed each year, along with a variety of descriptive information including the recipient country, type of aid (grant, loan etc.), and purpose of the project. The purpose codes that have a link to health activities as well as more general purpose funding are listed in Table 2 below. Aid flows are measured on a calendar year basis; in December of each calendar year, the CRS releases detailed activity-level data for the previous calendar year8.
18. Using data from the CRS, a number of studies have measured the total envelope of development assistance for health (Ravishankar et al, 2009; Sridhar and Batniji, 2008), the relative contributions of different donors (Kindornay and Besada, 2011), aid going to different diseases (e.g. maternal and child health, neglected diseases, etc.) (Powell-Jackson et al, 2006), as well as financing flowing to specific regions or types of countries (e.g. aid for fragile states) (Patel et al, 2009). Recent initiatives have attempted to expand the remit of development assistance tracking by supplementing information from the CRS with data on aid from non-DAC donors like China and Brazil, as well as contributions from other private philanthropic institutions.
19. Other databases compiling aid statistics include the Institute of Health Metrics Evaluation (IHME) disbursements data, based largely on OECD DAC data but complemented with data from multilateral agencies, United States foundations and large non-governmental organisations in the United States. The OECD DAC data is adjusted using the IHME’s own calculations (Ravishankar et al, 2009). This source does not include flows from emerging donors.
20. The AidData initiative complements the OECD’s data on commitments with aid flows from emerging donors and multilaterals – data from private donors are not yet included – and with a more detailed breakdown on how funds are spent. However, it has only limited series on disbursements9.
7 The loan must convey a grant element of at least 25%.
8
http://www.oecd.org/dac/stats/50462138.pdf
Table 2. Possible health purpose codes in the Creditor Reporting System (CRS)
DAC 5 CODE
CRS CODE
DESCRIPTION Clarifications / Additional notes on coverage
120 HEALTH
121 Health, general 12110 Health policy and administrative
management
Health sector policy, planning and programmes; aid to health ministries, public health administration; institution capacity building and advice; medical insurance programmes; unspecified health activities. 12181 Medical education/training Medical education and training for tertiary level services. 12182 Medical research General medical research (excluding basic health research).
12191 Medical services Laboratories, specialised clinics and hospitals (including equipment and supplies); ambulances; dental services; mental health care; medical rehabilitation; control of non-infectious diseases; drug and substance abuse control [excluding narcotics traffic control (16063)].
122 Basic health
12220 Basic health care Basic and primary health care programmes; paramedical and nursing care programmes; supply of drugs, medicines and vaccines related to basic health care.
12230 Basic health infrastructure District-level hospitals, clinics and dispensaries and related medical equipment; excluding specialised hospitals and clinics (12191). 12240 Basic nutrition Direct feeding programmes (maternal feeding, breastfeeding and
weaning foods, child feeding, school feeding); determination of micro-nutrient deficiencies; provision of vitamin A, iodine, iron etc.; monitoring of nutritional status; nutrition and food hygiene education; household food security.
12250 Infectious disease control Immunisation; prevention and control of infectious and parasite diseases, except malaria (12262), tuberculosis (12263), HIV/AIDS and other STDs (13040). It includes diarrheal diseases, vector-borne diseases (e.g. river blindness and guinea worm), viral diseases, mycosis, helminthiasis, zoonosis, diseases by other bacteria and viruses, pediculosis, etc. 12261 Health education Information, education and training of the population for improving
health knowledge and practices; public health and awareness campaigns; promotion of improved personal hygiene practices, including use of sanitation facilities and handwashing with soap.
12262 Malaria control Prevention and control of malaria.
12263 Tuberculosis control Immunisation, prevention and control of tuberculosis. 12281 Health personnel development Training of health staff for basic health care services. 130 POPULATION
POLICIES/PROGRAMMES AND REPRODUCTIVE HEALTH
13010 Population policy and administrative management
Population/development policies; census work, vital registration; migration data; demographic research/analysis; reproductive health research; unspecified population activities.
13020 Reproductive health care Promotion of reproductive health; prenatal and postnatal care including delivery; prevention and treatment of infertility; prevention and management of consequences of abortion; safe motherhood activities. 13030 Family planning Family planning services including counselling; information, education
DAC 5 CODE
CRS CODE
DESCRIPTION Clarifications / Additional notes on coverage
building and training.
13040 STD control including HIV/AIDS All activities related to sexually transmitted diseases and HIV/AIDS control e.g. information, education and communication; testing; prevention; treatment, care.
13081 Personnel development for population and reproductive health
Education and training of health staff for population and reproductive health care services.
500 COMMODITY AID AND GENERAL PROGRAMME
ASSISTANCE
Note: Sector specific programme assistance is to be included in the respective sectors, using the sector programme flag if appropriate.
510 General budget support Budget support in the form of sector-wide approaches (SWAps) should be included in the respective sectors.
51010 General budget support Unearmarked contributions to the government budget; support for the implementation of macroeconomic reforms (structural adjustment programmes, poverty reduction strategies); general programme assistance (when not allocable by sector).
600 ACTION RELATING TO DEBT
60010 Action relating to debt Actions falling outside the code headings below. 60020 Debt forgiveness
60030 Relief of multilateral debt Grants or credits to cover debt owed to multilateral financial institutions; including contributions to Heavily Indebted Poor Countries (HIPC) Trust Fund.
60040 Rescheduling and refinancing
60061 Debt for development swap Allocation of debt claims to use for development (e.g., debt for education, debt for environment).
60062 Other debt swap Where the debt swap benefits an external agent i.e. is not specifically for development purposes.
60063 Debt buy-back Purchase of debt for the purpose of cancellation.
700 HUMANITARIAN AID Within the overall definition of ODA, humanitarian aid is assistance designed to save lives, alleviate suffering and maintain and protect human dignity during and in the aftermath of emergencies. To be classified as humanitarian, aid should be consistent with the humanitarian principles of humanity, impartiality, neutrality and independence.
720 Emergency Response An emergency is a situation which results from man made crises and/or natural disasters.
72010 Material relief assistance and services
Shelter, water, sanitation and health services, supply of medicines and other non-food relief items; assistance to refugees and internally displaced people in developing countries other than for food (72040) or protection (72050).
730 Reconstruction relief and rehabilitation
This relates to activities during and in the aftermath of an emergency situation. Longer-term activities to improve the level of infrastructure or social services should be reported under the relevant economic and social sector codes. See also guideline on distinguishing humanitarian from sector-allocable aid.
73010 Reconstruction relief and rehabilitation
Short-term reconstruction work after emergency or conflict limited to restoring pre-existing infrastructure (e.g. repair or construction of roads, bridges and ports, restoration of essential facilities, such as water and sanitation, shelter, health care services); social and economic
DAC 5 CODE
CRS CODE
DESCRIPTION Clarifications / Additional notes on coverage
rehabilitation in the aftermath of emergencies to facilitate transition and enable populations to return to their previous livelihood or develop a new livelihood in the wake of an emergency situation (e.g. trauma counselling and treatment, employment programmes).
740 Disaster prevention and preparedness
See codes 41050 and 15220 for prevention of floods and conflicts.
74010 Disaster prevention and preparedness
Disaster risk reduction activities (e.g. developing knowledge, natural risks cartography, legal norms for construction); early warning systems; emergency contingency stocks and contingency planning including preparations for forced displacement.
Source: http://www.oecd.org/dac/stats/dacandcrscodelists.htm
National Health Resource Tracking Methods
21. The second category of health resource tracking includes the various frameworks, methods, and data systems focused on measuring and analysing health spending within individual countries. Initiatives to analyse country health spending date as far back as the 1920s, but these were typically one-off studies that were not standardised across countries (OECD, 2000). By the 1970s, OECD member countries had started measuring health spending from both public and private sources on a more regular basis. Efforts to standardize the methodology used by countries to conduct National Health Accounts (NHA) estimations started in the 1990s, when OECD began the first major initiative to develop uniform guidelines and codes for measuring and categorising different types of health spending. This culminated in the publication of A System of Health Accounts (SHA 1.0) in 2000 (OECD, 2000). This internationally-standardized framework for health accounting was used by countries around the world to measure and classify health spending. In 2006, OECD, Eurostat and WHO began a process of updating the accounting framework based on the experience of countries, which led to the release of a revised System of Health Accounts (SHA 2011) (OECD and WHO, 2011).
22. Several other national-level resource tracking frameworks and systems have evolved alongside the health accounting. The National AIDS Spending Assessment (NASA) is a framework for measuring and categorizing national spending on HIV/AIDS (UNAIDS, 2009). Public Expenditure Reviews (PER) are assessments of government spending on social sectors including health (Pradhan, 1996). Public Expenditure Tracking Surveys (PETS) track how public resources for health flow from national treasuries through different levels of government to individual health facilities and other implementers of health programmes (Gauthier and Ahmed, 2012).
23. While some of these tracking exercises are focused exclusively on government spending, many like the NHA and NASA also analyse external resources. They have often relied on one-off surveys of donors in the country, or drawn upon country-based data systems for tracking the flow of resources within the health sector. Countries have put in place a variety of data systems for tracking development assistance. For example, over 35 countries world-wide have put in place Development Assistance Databases to track aid received for all sectors (synisys.com). Kenya’s Shadow Budget process (discussed in more detail in Section 4) was designed to collect budget and expenditure data from all partners. Some country systems are specific to the health sector. Rwanda’s Health Resource Tracker collects budget and expenditure information from all development partners and government agencies active in the health sector on an annual basis (Ministry of Health, Rwanda, 2013).
Accounting Foreign Aid under the System of Health Accounts
24. Health accounts are expected to provide a transparent picture of foreign flows into a country’s health system, as well as the institutions involved. The accurate tracking of foreign resource flows is of great importance from the perspective of both the recipient country and the donor organisations.
25. The System of Health Accounts (SHA 1.0) published by the OECD in 2000 was developed initially for OECD countries that receive little to no external resources, and as such the explanation and treatment of the tracking of foreign aid into the health system was limited. The item ‘Rest of the world’ under the classification of health care financing referred simply to 'institutional units that are resident abroad.' This is further qualified by a note explaining that 'the relevant financing flows for health accountants between the domestic economy and the rest of the world comprise mainly transfers related to current international co-operation (e.g., foreign aid) and private insurance premiums/claims.’
26. The subsequent development of the 'Guide to producing health accounts with special applications for low-income and middle-income countries' (Producers’ Guide) (WHO, World Bank and USAID, 2003) provided a further clarification of the concepts around extra-national financing. While closely based on SHA concepts and definitions, the Producers' Guide introduced an additional classification of financing sources to make a distinction between the various sources of funds used to purchase health care goods and services and the paying or purchasing function of the re-named classification of ‘financing agents’. By applying this framework, the inclusion of Rest of the world funds makes the distinction from the external financing (paying/purchasing) function by specifically referring to 'funds that come from outside the country for use in the current year. External resources such as bilateral and multilateral international grants as well as funds contributed by institutions and individuals outside the country are included to the extent that they are used in the current period.'
27. The publication of SHA 2011 as a global standard bringing together the original SHA manual and the Producers’ Guide in a framework applicable to all countries provides an even more detailed treatment of external resources. The further distinction between the financing scheme or arrangement (HF), the financing agent (FA) or institution managing the funds and the classification of revenues (FS) provides an exhaustive framework for the categorisation and tracking of financing flows.
28. Furthermore, SHA 2011 recognises that there are a number of paths through which foreign aid can be managed: through the central government budget, provided directly to financing schemes (financing agents) other than governmental schemes, or provided directly to health care providers.
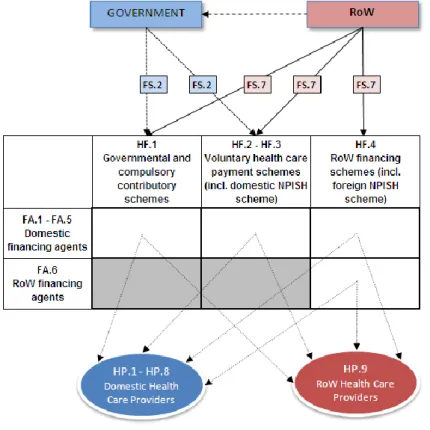
29. The foreign involvement in the health financing of a country can be better understood if the starting point is a comprehensive view of the domestic-foreign mix in health care financing and provision. Figure 1 shows an example of the flows of foreign resources in the health system and the institutional units involved.
Figure 1. A graphical representation of foreign flows and institutional units in the health system
Source: OECD, Eurostat and WHO (2011)
30. The upper part of Figure 1 shows how financing schemes raise their revenues. The table illustrates the possible main types of financing schemes, and their management by either domestic or external financing agents. The bottom part shows how domestic and foreign providers deliver health care services to the population.
31. Financing schemes can raise their revenues directly from the primary owners of income (i.e. households, corporations or the rest of the world) or as a result of the allocation of the general revenues of the government or specific non-governmental organisations (NGOs). In the latter case, the government (or the NGO) first raises general revenues for their overall activities from the primary owners of income. It then allocates the revenues among its different spending areas, including health financing schemes. These cases require clear, transparent accounting.
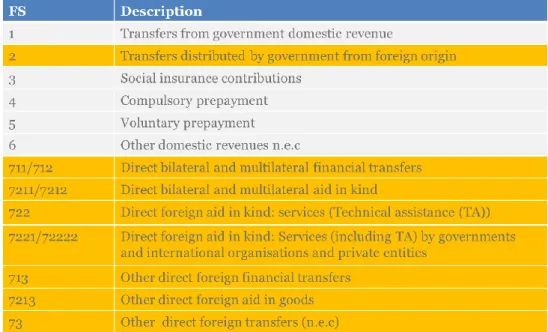
32. Table 3 shows how these flows are captured in the classification of the external revenues under the SHA 2011 framework with the distinction between those transfers of foreign origin being distributed through government and the direct transfers. For policy purposes it is usually of greater importance to know the total foreign resource flows rather than the breakdown. To understand the total foreign resource flows, it is therefore necessary to aggregate the Transfers distributed by government from foreign origin (FS.2) and Direct foreign transfers (FS.7).10
10
This aggregate is suggested as a Reporting Item to the FS classification, namely FS.RI.2 Total foreign revenues.
Table 3. Classification of revenues of financing schemes (FS) in SHA 2011
Source: OECD, Eurostat and WHO (2011)
33. In summary, the SHA 2011 accounting framework for financing allows:
the tracking, to the extent possible, of the route of total foreign resource flows11 in the domestic health care system;
the inclusion of not only health-specific aid, but also an estimation (imputation) of the part of general budget aid that can be considered as used for health purposes and other health-specific flows (without aid purposes);
the development of a correspondence table to DAC statistics;
the distinction between the following different types of foreign involvement (types of flows and types of institutional units, types of providers): foreign institutions providing resources, foreign revenues of financing schemes (direct and indirect), foreign institutions providing resources, acting as financing schemes (Rest of the World – RoW – financing schemes), and managing RoW financing schemes and foreign providers providing care.
34. Two main, but not exhaustive, types of data sources exist for identifying foreign aid revenues of financing schemes in the health accounts:
executed data from the recipient country’s budget12
international databases on donors’ disbursements data (OECD DAC statistics; IHME database; AidData project, etc.)
11
The discussion here is restricted to foreign aid, rather than all funds received from abroad, e.g. payments under foreign insurance or from foreign households.
35. However, for comprehensive tracking of aid-funded expenditure, government, private NGO and donor agencies in the country should be consulted. Government data are accessible from the Ministry of Finance and the Ministry of Health (office of budget or planning). Countries are increasingly requesting that resident donor agencies report their expenses and disbursements, down to the actual expenditure. Several tools are available and used in counties, generically labelled Aid Information Management System (AIMS). When this is not the case, countries will need to survey the relevant agencies.
36. It is important to consider all sources (bilateral, multilateral, foundations, NGOs) and all types of flows (earmarked and budget support), and to favour data on aid-funded expenditures rather than donors’ aid disbursements (see Section 3).
3. BRIDGING THE GAP
37. As discussed, the OECD Creditor Reporting System (CRS) has been the cornerstone for international development assistance tracking for several decades. Studies examining any aspect of donor financing at the global level, be it to compare health investments for specific diseases and conditions, types of funding modalities favoured by different donors, or the distribution of global health dollars across different countries, have tended to rely on the CRS database. And yet, the CRS is not widely used at the country level to track what development assistance is flowing into the health system. National resource tracking efforts for the compilation of health accounts have relied instead on either one-off surveys or country-level systems for tracking donor financing.
38. There has been little effort made to compare data on donor assistance tracked by the CRS with information captured by country-based systems tracking donor assistance. The disconnect between donor assistance tracking at the global- and country-levels results in the problem that, at present, the international donor community cannot provide a complete account of development assistance from original source to final use of funds. Moreover, from the perspective of donor accountability, there is currently no link between information reported by donors to the CRS at the global level and what they report to systems at the country-level. Are donors reporting comparable statistics at both levels? If the numbers differ, what explains the difference?
39. A further reason for strengthening the linkages between international and country resource tracking efforts relates to the institutionalization of health resource tracking at the country-level. As countries seek to make resource tracking exercises, such as health accounts, routine exercises, minimizing the costs of data collection efforts has emerged as a key priority. If the CRS can provide a basis for consistent information on donor flows needed by countries to undertake estimations in the compilation of health accounts, then additional data collection exercises can be avoided, thereby making health accounts exercises cheaper to conduct and reducing the reporting burden on all health sector stakeholders.
40. In the first instance, there should be an understanding of the observed differences between the estimates. As mentioned, there is a need to clarify what is meant by commitments, disbursements and expenditures such that this might help to explain some of the variations (see Box 2).
Box 2. Commitments, disbursements and expenditures
Commitments are financially-backed written documents in which donors undertake to provide financial assistance to recipient countries directly or through multilateral organizations. Most of the time, commitments are pledged for multiple years.
Disbursements are the amount of aid transferred from donors, in cash, in kind (valued at the cost to the donor) or in services. Funds are considered spent from the point of view of the donor, regardless of whether the recipient has spent them in the year in which they are disbursed. Disbursements in any given year usually represent only part of an earlier commitment depending on the donor’s planning cycle (which can be up to 10 years).
Donors also began reporting country programmable aid (CPA) in 2004 to capture how much of each reported disbursement was available for spending within a recipient country, rather than on global activities or activities linked to health aid in the donor country – e.g. health research, health of asylum seekers. Data are not available for all donors, particularly the private foundations and some of the non-traditional donors that are not members of the Organisation for Economic Co-operation and Development (OECD).
The last category is health expenditure in recipient countries that has its origin in external sources, which in the health accounts refers to the actual money spent on health care by the financing (purchasing) scheme in the country. The information source of this expenditure can be executed budget reports from government departments, agencies and NGOs. The concept of revenues of financing schemes under the System of Health Accounts corresponds more closely to the concept of disbursement received by the developing country in the given year under DAC statistics.
41. A further issue to consider is the linkage between the types of finance categories in the DAC classification and the source of revenues classification (FS) in the System of Health Accounts. In terms of making a distinction between grants and loans, the health accounts only take grants into consideration in accounting for external funding. By definition, loans are changes in financial assets or liabilities (and as such, loans are not included in revenues). Loans are generally taken to cover, for example, the state budget expenditure that is not balanced by domestic revenues. In addition, there may be health sector specific loans, usually for investments in the health sector. For some lower-income countries, however, it may be important to show the role of foreign loans in the financing the health system. Therefore, in the health accounts, loans (whether by government or private entities) are recommended to be shown as a memorandum item13.
42. Within the DAC statistics (see Box 1 in Section 2) both government and private loans are reported under the different types of finance. The correspondence between the types of finance and the various categories in SHA is shown in Table 4.
Table 4. Type of finance in DAC statistics and Revenues of financing schemes (FS) in SHA 2011
Type of finance FS code FS Description
Official Development Assistance (ODA) FS.2 Transfers distributed by Government from foreign origin
FS.7 Direct Foreign transfers
Direct bilateral financial transfers Direct multilateral financial transfers Direct bilateral aid in goods
Direct multilateral aid in goods
Direct foreign aid in kind: services (including TA) Other official flows (OOF) (loans from the
government sector)
FSR.1.1 Loans taken by government
Private flows at market terms FS.7.1.3
FS.7.3
Other direct foreign financial transfers Other direct foreign transfers (n.e.c.) FSR.1.1 Loans taken by government
FSR.1.2 Loans taken by private organisations Private grants from NGOs and foundations FS.7.1.3 Other direct foreign financial transfers
FS.7.2.1.3 Other direct foreign aid in goods
FS.7.2.1.3 Direct foreign aid in kind: services (including TA) FS.7.3 Other direct foreign transfers (n.e.c.)
Source: OECD, Eurostat and WHO (2011)
43. Another important difference between the scope and boundary of OECD DAC statistics and SHA 2011 should be emphasised. Aid to health in DAC statistics includes only aid earmarked to health purposes, while SHA 2011 considers not only aid dedicated to health, but also recommends imputing a share of foreign general budget support that is used for health.
44. Table 5 shows the relationships between DAC statistics and SHA 2011 in more detail. The correspondence between the Type of aid categories of DAC and the FS categories of SHA 2011 is shown in the first four columns. The fifth column shows the financing schemes that may receive the given financing aid. The last column provides or refers to some explanations.
Table 5. Correspondence between SHA 2011 and Type of aid in DAC statistics
CRS/DAC SHA 2011 Notes
Type of aid (CRS/DAC) Revenues of health financing schemes Possible financing schemes A Budget support A01 General budget
support FS.2 Transfers distributed by government from foreign origin Governmental scheme
In the absence of information to the contrary, it might be assumed that only
governmental health schemes receive revenues from foreign general budget support (1) A02 Sector budget support FS.7 Direct Foreign transfers
(Mainly: Direct Bilateral financial transfers or Direct Multilateral financial transfers Governmental scheme Note (2) FS.2 Transfers distributed by government from foreign origin NPISH financing schemes Note (2) B Core contributions and pooled programmes and funds B01 Core support to NGOs, other private bodies, PPPs and research institutes FS.7 Direct Bilateral financial transfers Direct Multilateral financial transfers
Direct Bilateral aid in goods
Direct Multilateral aid in goods
NPISH financing schemes
B01 refers to funds that are paid to NGOs (local, national and international) for use at the latter’s discretion, contribute to programmes and activities which NGOs have developed themselves, and which are implemented with their own authority and responsibility (Note (3))
Rest of the world financing schemes
FS.6.3 Other revenues from NPISH n.e.c.
NPISH financing schemes
Support accounted under B01 may go to domestic NGO that raises funds from both domestic and foreign institutions and then supports (transfers money to) other NGOs acting as financing schemes (Note (4)) B02 Core contributions to
multilateral institutions
The recipient multilateral institutions pool contributions so that they lose their identity and become an integral part of its financing assets. Only the next phase of the flows is reported under SHA 2011 (FS x HF) Note (5) B03 Contributions to specific-purpose programmes and funds managed by international organisations (multilateral, INGO)
FS.7 Direct Foreign transfers (subcategory depends on the nature of the contribution)
Rest of the world financing schemes B04 Basket funds/pooled funding FS.7.1.2 . Direct Multilateral financial transfers NPISH financing schemes FS.7.1.2 . Direct Multilateral financial transfers
Rest of the world financing schemes
CRS/DAC SHA 2011 Notes Type of aid (CRS/DAC) Revenues of health financing schemes Possible financing schemes C Project-type interventions C01 Project-type interventions FS.7 Direct Bilateral financial transfers Direct Multilateral financial transfers Direct Foreign aid in goods
Governmental financing schemes NPISH financing schemes Rest of the world financing schemes D Experts and other
technical assistance
FS.7.2.2 .
Direct Foreign aid in kind: services (including TA) E Scholarships and
student costs in donor countries
FS.7.3 Other Direct foreign transfers (n.e.c.)
F Debt relief FS.2 Transfers distributed
by Government from foreign origin Governmental financing schemes Note(6) FS.7.1.1 FS.7.1.2
Direct Foreign transfers Governmental financing schemes
If the loan concerned is health-specific
G Administrative costs n.i.e.
Not accounted under SHA 2011
Notes
(1) For simplicity, it is assumed that only governmental health financing schemes receive revenues from foreign general budget support. Transfers provided by government to other financing schemes come from domestic sources or foreign support earmarked to health. (2) Sector budget support received by the government may be used in two ways: for the purposes of government-operated health
programmes and health facilities (accounted under SHA 2011 as Direct Foreign transfers: a revenue of governmental financing schemes), or for the purpose of supporting from this fund health programmes of NPISHs (accounted under SHA 2011 as FS.2 Transfers distributed by government from foreign origin.
(3) Core support is provided to foreign NGO (A), which uses part of these funds to support foreign NGO (B) (not resident in the country) in implementing a vaccination programme in the recipient country. It is accounted as direct bilateral/multilateral financial transfer (FS.7.11 /FS.7.1.2) to rest of the world financing schemes (HF.4.2. Voluntary RoW schemes).
(4) Foreign support going to domestic NGO that raises funds both from domestic and foreign institutions and then supports (transfers money to) other NGOs acting as financing schemes. The NPISHs financing scheme receives its revenues from domestic NGO and it is likely that the origin of this revenues cannot be distinguished between foreign and domestic. In this case, the revenue is accounted as FS.6.3.
(5) ODA statistics report commitments made by donor countries to international organisations (that may not be used in the given accounting period). Such data are not included in SHA, as the main issue of SHA – from the point of view of foreign aid– is to report the revenue-raising by financing schemes.
(6) Debt relief is treated as a specific kind of budget support
Source: OECD and WHO (2014)
45. At a more detailed level, the CRS project sector codes (Table 2) related to health can be default mapped at an aggregate level to the SHA 2011 HC functional classification (Figure 2). The link to the functional classification is important to determine the different boundaries of what may be included under development assistance for health (according to CRS) and what is considered healthcare expenditure under SHA-based health accounts. Thus, while aid for both Medical Research and Education and Training are included under the CRS category Health (general), they are both considered outside the boundary of health expenditure of the SHA, and are reported as separate categories.
46. In some cases, such as for basic healthcare/curative care there may appear to be a close correspondence. For other categories there is less of a straight one-to-one linkage. While a lot of the disease specific categories and population health clearly have a high prevention component, it does not
exclude expenditure on programmes directed towards treatment or diagnosis. For example, aid for Malaria Control will cover expenditure on programmes for the distribution of long-lasting insecticidal nets (LLINs), and indoor residual spraying of insecticide (IRS), as well as on anti-malarial treatment drugs such as Artemisinin-based combination therapies (ACTs). In theory, commitments on these sub-components should be allocated separately to the curative and prevention categories of the health accounts.
47. The result of this is that while many of the sector codes can be correctly attributed to health, the allocation into more specific types of care - treatment or prevention - can be more problematic. However, there may be more possibility of a more accurate linkage at the disease level; that is, between some of the sector codes - Tb control, Malaria Control - and the disease sub-accounts, which are constructed out of the overall health accounts (Figure 3).
Figure 2. Default mapping on CRS purpose codes for health to the SHA 2011 HC functional classification
48. In summary, a theoretical picture can be drawn up of the linkages between the development assistance tracking systems and the national health expenditure tracking represented by the health accounts. Figure 3 shows how an exhaustive coverage of donors and external funding is required – possibly linking various sources – to link to the external revenue sources reported under the health accounts framework. The categorization by type of finance, type of aid and purpose code allows a closer alignment to the measure of health expenditure and additional reporting items defined under the health accounts boundaries. Finally, purpose codes and programme level information can facilitate the correspondence with the breakdown of the type of care (functions) and the disease/population sub-accounts (e.g. Malaria, Tb, HIV/AIDS and Maternal and Child Health). However, it must be reiterated again that the reporting of disbursements and actual expenditures represent different concepts when aligning data from the two systems.
Figure 3. Theoretical correspondence between International aid statistics and the SHA 2011 framework
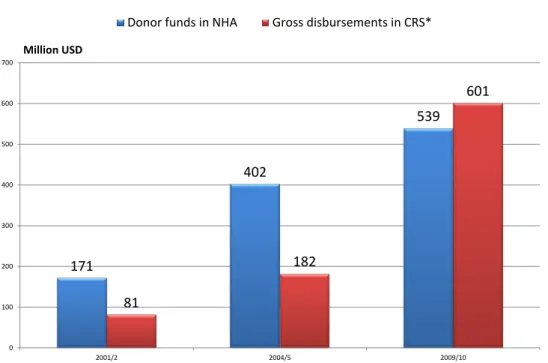
49. Figure 4 extends this theoretical framework to actual statistics by showing an example for Kenya and comparing the gross disbursements reported in the CRS database with the total of external resources (donor) published in the last three rounds of the Kenyan NHAs - 2001/2, 2005/6 and 2009/10.
50. While a significant underestimate appears for the first two financial years - the calculated official development assistance for health from CRS is less than half the level of reported donor funding in the NHA - it would appear that this discrepancy is significantly reduced in the most recent exercise (2009/10) with the level of ODA above that of external funding sources in the health accounts. This may point perhaps towards an increasing degree of coverage with improved country and multilateral reporting in the aggregate donor figures. However, many factors should be considered. In addition to the already discussed difference between commitments and expenditure, there are also issues around different data sources and methodologies, adjustments of the CRS data from calendar year to financial year, timing of reporting, different exchange rates used, among many others. This may mean that the observed convergence cannot necessarily be taken at face value!
51. To understand better the aggregate statistics, the following section looks into more detail of the practical landscape of health resource tracking in Kenya by focusing on some of these data issues to highlight where discrepancies and problems can appear at a more detailed donor country level.
Figure 4. Comparison of CRS and NHA estimates for Kenya
Notes:
(1) CRS data refers to gross disbursements for Sectors 120 (Health) and 130 (Population policies//Programmes and Reproductive health). (2) The Financial Year for Kenyan NHA runs from July1 to June 30. The corresponding figures for CRS are an average of the two calendar years
apart from 2001/2 which refers only to CRS data for 2002.
Source: OECD CRS database (Sept 2014) and Kenya NHA (MoH).
171 402 539 81 182 601 0 100 200 300 400 500 600 700 2001/2 2004/5 2009/10 Million USD
4. THE KENYAN CONTEXT14
Health Resource Tracking in Kenya
52. Since the mid-1990s, Kenya has undertaken National Health Account (NHA) exercises every 3-5 years to measure and analyse health spending in the country from public, private and external sources. Specifically, the Kenyan Ministry of Health (MOH) has released NHA estimates of health spending for the following Government of Kenya (GOK) Financial Year (FY): 1994-95, 2001-02, 2005-06 and 2009-1015. All of these NHA exercises were based on the methodology and coding enshrined in SHA 1.0. In late 2013, an MOH-led team started planning the next round of NHA to measure health spending in FY 2012-13. This estimation uses the revised SHA 2011 methodology.
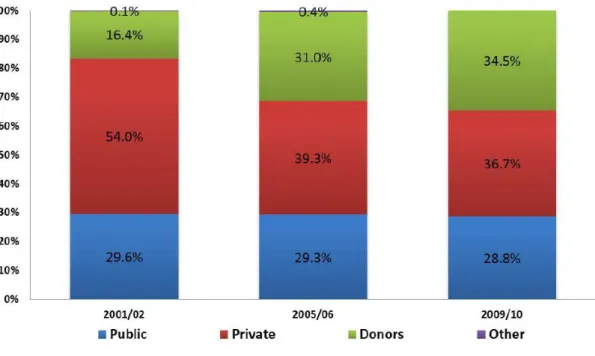
53. As seen in Figure 5, external financing for the health sector has accounted for a large and growing share of total health spending in Kenya (Kenya Ministry of Health, 2011). Hence, measuring and analysing development assistance for health has been a key component of all of Kenya’s NHA estimation exercises to date. To collect information on donor financing in the health sector, the NHA team has used a range of sources: donor surveys, the Shadow Budget tool, and government documents that contain information about on-budget support.
Figure 5: Sources of financing for health expenditure in Kenya
Source: Kenyan NHA 2009/10 (Kenya MoH, 2011)
14
The Kenyan case study was conducted by Nirmala Ravishankar, consultant, and David Njuguna, Kenyan Ministry of Health.
Figure 6. Financing agents responsible for implementing donor-financed programs in FY 2009/10
Source: Kenya NHA 2009/10 (MoH, 2011)
54. For the first three rounds of NHA, the Kenya team administered a survey sent to all donors active in the health sector. In the most recent round of NHA for FY 2009/10, the team switched their approach to use a standardised data reporting tool developed for the Shadow Budget, a process designed by MOH with support from development partners in 2007 (more details about this are included in the next section) to track budget information from all development partners. In 2010, it was modified to also track expenditure data. This information was supplemented with information from government budget documents that provide details about on-budget support to the health sector.
55. The NHA team also administered a survey to non-governmental organisations (NGOs) receiving funds from donors to implement programmes in Kenya. Figure 6 shows that in FY 2009/10, nearly 81% of donor-financed health expenditure was managed by NGOs (both international and local). In contrast, GOK, which includes the Ministry of Health, the Office of the President (where the National AIDS Control Council is housed) and local governments, were responsible for only 14% of donor-financed health spending. While some donors were able to provide financial information about how much was disbursed to these NGOs, detailed information about how the funds were spent, which is needed for the NHA, could only be captured by surveying the implementing partners. This was the case, for example, with programmes funded by the US Government, which is the single largest donor in the health sector in Kenya (see Figure 7 below). In this case, the information reported by the donor was used simply to validate the information gathered from NGOs.
56. The country team has faced several challenges when tracking donor resource flows. First, getting donors to respond to the survey has been difficult. Given that they already provide information to other development assistance tracking systems (including the CRS), the survey is viewed as an additional and unnecessary data request. The response to the NGO survey has overall been better, though it too suffers from its share of challenges. Many projects and programmes have a single implementing partner as the primary recipient, who then passes funds to sub-recipients. The primary recipient is often unable to provide detailed programme information of the kind needed by the NHA (typically related to the purpose or function of different activities, and providers of care) for activities implemented by their sub-recipients. Surveying both primary and sub- recipients can be time-consuming and costly, and analysing such data requires the team to be exceedingly careful to avoid double-counting.
Government 14% NGOs 81% Rest of the world 5%
57. Given the challenges faced in the past, the MOH-based NHA team has been keen to find an efficient and cost-effective way to gather information on donor flows. To this end, the authors of the case study undertook a review of all available data sources for donor funding – specifically, the Shadow Budget, GOK’s donor assistance tracking system, and the CRS -- and compared the information they capture. The three sources are discussed below.
Figure 7. Planned and actual spending by donors in FY 2010/11 as reported in the Shadow Budget
Source: GoK
Inventory of Kenya-based Donor Tracking Systems Shadow Budget
58. Development partners and the Ministry of Health came together in 2007 to design and implement the Shadow Budget process for collecting budget data from all partners active in the health sector on an annual basis. The purpose of this information is to guide the planning process at MOH. Information from the Shadow Budget feeds into MOH’s annual operational plan and multi-year strategic plans. In 2010, as part of its NHA institutionalisation effort, MOH used the Standardised Data Reporting Tool designed for the Shadow Budget process to collect information about expenditures in FY 2009-10 (MOH, 2011). The Development Partners in Health Kenya donor coordination body assisted MOH to undertake this data collection. The exercise for collecting expenditure data was repeated in 2011 for expenditure in FY 2010/11. While the Shadow Budget process has continued, the focus has been on collecting budget information only and the collection of expenditure data was stopped after 2010. Figure 7 shows planned
and actual expenditures in the health sector as reported by 10 bilateral donors and international agencies for FY 2010/11. In a majority of cases, actual spending was equal to or less than planned spending, while in only one case actual spending exceeded planned spending.
GOK’s External Resource Database (ERD)
59. The Ministry of Finance in Kenya has a department that tracks external resources received by the GOK. The unit maintains an External Resources Database (ERD), which provides information about the amount of funds disbursed by donors for government projects and programmes. In other words, it only captures on-budget funding. Figures 8 and 9 below show the total amount of on-budget donor disbursements in recent years, as well as trends in on-budget support from individual donors.
Figure 8. Donor disbursements to GoK as measured by the National Treasury
Source: ERD, Ministry of Finance, GOK
Figure 9. Disbursements to GoK by donor as reported by the National Treasury
Source: ERD, Ministry of Finance, GOK
102 141 243 249 50 100 150 200 250 300 M ill io n s o f US D 20 40 60 80 2009/2010 2010/2011 2011/2012 2012/2013 M ill io n s o f US D
ADB/ADF BADEA BCM/USA BELGIUM CHINA
DANIDA DENMARK GAVI GF GTZ-GERMANY
IDA ITALY JAPAN KFW-GERMANY KUWAIT
NETHERLANDS OPEC SAUDI ARABIA UNFPA UNICEF
Creditor Reporting System
60. The CRS provides information about both donor commitments and disbursements to Kenya. This covers the total funds, both given on-budget to the government as well as off-budget support to NGOs. Figure 10, which charts aid disbursements for the health sector16 by different donors to Kenya, shows that development assistance for health from the United States has grown dramatically since 2005 and far outpaces aid from other donors. In 2012, the most recent year for which we have disbursement information, development assistance for health from the United States accounted for over 62% of total aid for the health sector in Kenya.
Figure 10. Trends in donor disbursements to Kenya as reported by donors to the CRS
Source: OECD CRS Database (2014)
Comparing CRS with Country Data Sources
61. In this section, a comparison of the data from the three sources described above was undertaken. The CRS tracks commitments and disbursements. The ERD also tracks disbursements. The Shadow Budget contains information about planned and actual spending. These four quantities – commitments, disbursements, planned expenditure, and actual expenditure – have to be carefully considered before starting comparing the data from these sources.
62. Recall from the previous chapter that a commitment is a promise, made by a donor, of funding spanning multiple years. The full amount of the commitment is recorded in the year in which the commitment is made, irrespective of the number of years over which the funds may flow. A disbursement
16
For the purposes of this study, we counted as health all activities coded as Health General (121); Basic Health (122); or Population Policies/Programs and Reproductive Health (130).
is the funds released by the donor to the recipient in a given year against an existing commitment. Planned expenditure refers to the amount of funds an entity intends to spend in a year. Actual expenditure is what expenditure - as the name suggests - is the amount an entity plans to spend during the year. While disbursements, planned expenditure, and actual expenditure are accounted per reference period (i.e. the financial year), commitments are related to spending over multiple years even though the full amount is recorded in the year in which the commitment was made. Hence, commitments are not comparable on an annual basis with any of the other three quantities.
63. Next, we turn to disbursements. Both the CRS and the ERD track disbursements. The former is based on information from donors, while the latter is based on Ministry of Finance records. These, in principle, should be comparable with some adjustment for reference year given that the CRS follows the calendar year while the ERD follows the GOK FY that runs from July to June.
64. Can annual disbursements reported by a donor to the CRS be compared with either the donor’s planned expenditure or their actual expenditure in that year as tracked by the Shadow Budget? One can answer this question conceptually – do we have reasons to expect these numbers to be the same – and empirically – what do the data show? First, let us consider the question on conceptual grounds. Donor agencies make grants to implementing partners and also implement some programmes themselves. A donor’s disbursements in a year as reported to the CRS should reflect both of these. We might expect the planned spending reported by donors to the Shadow Budget to be the donor’s budget for the year in question, that is, including both the funds they will transfer to grantees and their own programme and operational budgets. Actual spending in the period may differ from the amount disbursed as well as planned spending for reasons such as slow execution of programmes. In other words, it seems reasonable to expect disbursements to be comparable to planned spending, but both disbursements and planned spending may differ from actual spending.
65. Figure 11 below, which compares disbursements estimates from the CRS against planned and actual expenditures from the Shadow Budget for FY 2010-11, shows a very mixed landscape. Since the CRS data is by calendar year, disbursements in calendar years 2010 and 2011 were averaged to arrive at an estimate that is comparable to the expenditure figures from the Shadow Budget, which is organized according to the GOK FY. That said, of the 10 donors profiled, in 4 cases disbursements were lower than both the planned and actual spending. In 5 cases, disbursements exceeded both the planned and actual spending. In one case, the three were equal.
66. In summary, disbursement amounts from the CRS are inconsistent with figures from the Shadow Budget concerning planned or actual spending. There are a number of possible reasons for this. First, the CRS data is organized by calendar year while the country-level data is reported according to the government FY. This may have a significant effect on the comparisons since there can be large volatility from year to year regarding specific programmes. For example, disbursements from Japan for Basic health (CRS code 122) amounted to 14.4 million USD in 2010 but dropped to 3 million USD in 2011. Second, our expectation that disbursements are comparable to planned spending might be erroneous. It is based on the assumption that donors report both grants made to others as well as funds set aside for their own activities to the CRS; in reality, perhaps they only report the former. Moreover, a donor’s planned spending in a given year at the country-level might exceed the new funds disbursed that year, if the donor has unallocated or unused funds from the previous year.
67. Even as we conclude that the disbursement amounts reported in the CRS may not be easily comparable to information in country systems about planned and actual expenditures, information from the two can be compared based on the particular projects reported at the two levels. Even if the amounts cannot be easily compared, the work being funded by the donors as reported by them at the global level and the country level ought to be aligned.