The Determinants of Net Interest Margin among Microfinance
Institutions in Ghana
Bismark Addai1* Adjei Gyamfi Gyimah2 Stephen Lartey2
1. School of Management and Economics, University of Electronic Science and Technology of China, Chengdu, 610054, People’s Republic of China
2. Department of Finance, Career Spring Institute, Kumasi, Ghana Abstract
The original mandate of Microfinance Institutions (MFIs) is to address the financing needs of the poor at a lower cost. However, majority of these MFIs rather unfortunately charge very high interest rates on loans and reward suppliers of deposits with low interest rates resulting in high net interest margins (NIM). Consequently, this study investigates into the factors that cause such high NIM among MFIs in Ghana in order to offer policy recommendations on how to curb this menace. STATA and Microsoft Excel statistical tools were employed in analyzing a 10-year panel data from 20 MFIs. The independent variables were categorized into two: MFI-specific and macro-MFI-specific variables. Glaring in this study is a statistically significant negative effect of inflation, non-interest earning assets, operating expenses, number of female borrowers on NIM and a significant positive impact of size, years of operation and ownership structure on NIM among MFIs in Ghana. This study concludes that high interest margins observed within the Ghanaian microfinance industry are mainly due to a combination of macroeconomic and firm specific factors which need to be given much attention in dealing with high NIM among MFIs in Ghana. Apparently, policy recommendations have been given in this study to specifically deal with the sources of high NIM among MFIs in Ghana.
Keywords: Microfinance schism, macro-economic, policy rate, inflation 1. Introduction
Recognized as a huge success, the microfinance model pioneered by Dr. Yunus has been replicated and implemented in dozens of countries around the world (Esty, 2011). Presently, there are approximately 7000 microfinance institutions serving over 54 million clients worldwide, who have received US$18 billion in loans and have accumulated US$13 billion in savings (Weber and Ahmad, 2014). Microfinance has become a diverse sector with numerous players of all sizes, methodologies, organization, performance and legal status. However, the Microfinance industry in Ghana is experiencing an overwhelming rate of proliferation. It is a worrying statistic that only 600 out of about 1800 existing MFIs are registered members of the Ghana Association of Microfinance companies (GAMC) whiles the Bank of Ghana (BoG), regulators of the industry, had as at November, 2013, registered only 216 microfinance companies. This implies that though there could be as many as 1800 of such existing MFIs, only 216 of them were registered and officially known by the BoG. Fearing that such proliferation could result into something unpleasant, the BoG, then decided to put a cap on the number of MFIs in the country. Mira (2009) ascribes the high rate of proliferation to the exorbitant lending rates, very low deposit rates, and subsequently high margins that are charged by most operators of MFIs to their borrowers since the social mission of poverty alleviation is gradually giving way to profiteering.
The original mandate of MFIs is to address the financing needs of the poor at a lower cost as intended by the originator of the microfinance concept, Mohammed Yunus of the Grameen Bank of Bangladesh. This implies that MFIs are expected to operate with lower margins relative to what pertains within the formal banking sector. However, majority of these MFIs rather unfortunately charge very high interest rates on loans and reward suppliers of deposits with low interest rates resulting in high net interest margins. Several research works including the works of: Richard (2002); CGAP, (2002); Dehejia et al. (2012) have justified such high margins whiles other researchers including: Rosenberg et al. (2013); Fernández et al. (2012); Mitra (2005); Mitra (2009) have also criticized it. High interest rates charged by MFIs results in a mission drift as poor borrowers are made to pay hugely and unfairly, in what is commonly referred to as poverty penalty (Prahalad & Hammond, 2002).
Previous studies on interest spreads and margins in Ghana have mostly concentrated on commercial banks and not so much on microfinance institutions (Bawumia et al, 2005; Aboagye et al., 2008; Mensah and Abor, 2013). Bawumia et al. (2005) investigated the determinants of bank interest spreads in Ghana while Aboagye et al. (2008) gave further insight into the issue with much emphasis on banks specific variables. This leaves much room for a study on Net Interest Rate Margin of MFIs to be conducted since the modus operandi as well as the motive for commercial banking and microfinance are quite different, creating a huge gap in literature. In the light of the above argument, it is very imperative to probe into the various factors that determine net interest margins in MFIs since knowledge of these determinants would inform how to work at reducing the margins.
et al, 2012), and redirect MFIs to focus on the core mandate of poverty alleviation. It then becomes very imperative to pose the question: What determines the net interest margin of MFIs in Ghana?
Consequently, this research employs secondary data from 20 MFIs in Ghana to model the determinants of Net Interest Margin and what informs these rates in order to offer useful suggestions on how to reduce the margins.
2. Literature Review
2.1 The Microfinance Schism
Originally, the concept of microfinance was to help in generally alleviating poverty and improve the financial status of most households, particularly through women. Unfortunately, the concept in many jurisdictions, has taken a turn to profiteering directions, and Ghana is no exception. This is what is explained in much literature as the win-win proposition (Morduch, 2000). While supporters of the win-win proposition are more of financial sustainability minded, a growing majority of the microfinance movement still make economic and social impact their chief goal. Thus, over time, the microfinance schism now lies between rhetoric and action and between financially-minded donors and socially-minded programmes (Morduch, 2000).
Amongst the several supporting arguments advanced by the proponents of the win-win ideology, the most important is the position that households require access to credit, and not just cheap credit. This position is backed by the following eight claims as outlined by Morduch (2000) that: raising the cost of financial services does not diminish demand; due to their scale, financially sustainable programmes can make the greatest dent in poverty; financial sustainability will give programmes access to commercial financial markets; since they come at no cost to donors, financially sustainable programmes are superior weapons for fighting poverty; subsidized programmes are inefficient and thus bound to fail; subsidized credit most often ends up in the hands of the non-poor; successful microfinance programmes must be non-government programmes; subsidizing credit undermines savings mobilization. It is fair to ask however that should such propositions as above be given a place in microfinance at all? Are such propositions not deviations from the original ideology of the microfinance concept?
2.2 Net Interest Margin (NIM)
Net Interest Margin (NIM) is a measure of the difference between the interest income generated by banks or other financial institutions and the amount of interest paid out to their lenders (for example, depositors), relative to the amount of their (interest-earning) assets Brock and Rojas-Suarez (2000). NIM is a performance metric that examines how successful a firm's investment decisions are compared to its debt situations. It is usually expressed as a percentage of what the financial institution earns on loans in a time period and other assets minus the interest paid on borrowed funds divided by the total amount of the assets on which it earned income in that time period (the total earning assets). Net interest margin is similar in concept to net interest spread, but the net interest spread is the nominal average difference between the borrowing and the lending rates, without compensating for the fact that the earning assets and the borrowed funds may be different instruments and differ in volume.
A positive NIM for an MFI means its investment strategy pays more interest than it costs. An overly wide positive margin could also imply that an MFI is charging exorbitantly on its lending rates vis-à-vis its deposit rates. Conversely, if NIM is negative, then it means the MFI’s investment strategy costs more than it makes which also implies that the firm probably did not make an optimal decision, because interest expenses were greater than the amount of returns generated by investments. Various ways of estimating NIM have been acknowledged in literature (Brock and Rojas-Suarez, 2000) However, the most widely used method adopted in this study is as flows:
NIM = (1)
As suggested by Brock and Rojas-Suarez (2000), this method is commonly applied. Despite the flaws of this method of ignoring fees and commissions that may increase the cost of loans to borrowers and reduce interest received by depositors (Brock and Rojas-Suarez, 2000), Aboagye et al. (2008) is of the view that its wide usage is due to the ease with which it can be estimated from banks’ income statements and balance sheets.
2.3 Determinants of Net Interest Margins in MFIs
The concept of microfinance and the issue of its interest rates and margins have attracted a lot of debates recently. These recent debates are incited by negative occurrences in the microfinance industry lately, such as the 2010 suicide cases in Andhra Pradesh and the sacking of Muhammad Yunus, after he had been labeled as “a blood sucker of the poor” by the Bangladeshi Prime Minister. Three major determinants of NIM have been established in literature: Microfinance specific variables, industry specific variables and macroeconomic variables (Maudos and Guevara 2004; Saunders and Schumacher 2000). However, this study does not utilize industry specific variables since there exist lack of objectivity in estimation of industry specific variables such as market share and
concentration as more and more MFIs spring up very often usually in the form of Savings and Loans companies (Sarpong et al., 2013). Again researchers have also established that among the three categories bank specific variables and macroeconomic variables are the most predominant variables with significant impacts on NIM (Saunders and Schumacher 2000). As a result, much emphasis is placed on Microfinance specific variables and macro variables in modeling the determinants of NIM among microfinance institutions in Ghana. Making a synthesis of similar studies conducted on commercial banks as well, this work analyses the determinants of net interest margin (NIM) of microfinance institutions (MFIs) under two categories: microfinance specific variables and macro-economic variables.
2.3.1 Microfinance Specific Variables
Size and Age: The total value of MFI’s assets and its number of years in operation defines the size and age of the
MFI respectively. The underlying reason for the inclusion of size as a variable is for the related economies and diseconomies of scale. All things being equal, as banks increase in size, it is expected that their cost of operations will also increase accordingly. MFIs are expected to follow this trend and so it could be logically hypothesized that the NIM of MFI is a positive function of its size. Other authors have confirmed that “an increase in bank size is likely to increase the net interest margin more than any other variable” (Ugur and Erkus, 2010; Aboagye et al., 2008). This however contradicts the assertion of Fernández et al. (2012) as they believe that large and mature MFIs are expected to have low margins. They contend that size and maturity breed efficiency which is also associated with lower margins.
Operating expenses: Literature on determinants of NIM establishes a direct correlation between
operating cost and NIM of financial institutions (Carbo and Rodriguez, 2007; Ahmet and Hakan, 2010). Financial institutions usually pass on their operating expenses to depositors and lenders; consequently, variation in operating expenses is reflected in interest margin as financial institutions with higher average operating expenses may resort to charging higher margins to balance higher operating costs. This study therefore hypothesizes a positive relationship between operating expenses and NIM of MFIs in Ghana.
Deposits: In Ghana, the tier-approach to regulating financial institutions places some institutions under
deposit taking and others under non-deposit taking (Bawumia et al., 2005). Prior studies have established that banks which take more deposits are more likely to have lower margins (Fernández et al., 2012; Aboagye et al., 2008). It is expected that MFIs who take deposits will be managed efficiently which will translate into a lower margin. Thus, a negative relationship between margin and deposits is expected.
Percentage of Women Borrowers: Many MFIs target mostly women. This is grounded on the common
belief that women are rather more passionate about the welfare of their family or households than men (Pitt & Khandker, 1998). Thus, it is easier to drive the goal of poverty alleviation by rather extending microcredit to women than men. Another assertion holds that women have proved to be more reliable borrowers and are more likely to repay promptly than men. Pitt & Khandker (1998) concluded that women use borrowed funds better than men in microfinance programmes. Based on such a conclusion, it should not be unusual to find many MFIs rather charging lower interest rates on microcredit extended to women. On the contrary, Alesina et al. (2008) find that women pay a higher interest rate, although they are nor riskier than men. A positive relationship is therefore expected between margin and the percentage of women that forms the clientele of an MFI.
Average Loan Size: The average loan size which gives an indication of the MFI’s outreach is measured
as the MFI’s gross loan portfolio over the number of active borrowers (i.e. Gross Loan Portfolio/Total number of active borrowers). This variable is commonly used as a social performance indicator to measure MFI mission drift (Fernández et al., 2012). Generally, smaller size loans are accompanied by lower administrative costs. Thus, it is expected that average loan size (ALS) will have a positive relationship with margin.
2.3.2 Macro-Specific Variables
Sarpong et al. (2013) observed from their study of various literatures that the various macroeconomic variables which have been empirically tested and established as factors which increase interest rate spreads include interest rate uncertainty, exchange rate volatility, high and variable inflation and real interest rate, broad money growth, increased fiscal deposits and high share of commercial banks public sector loans.
Inflation and Interest Rates: Inflation reflects a reduction in the purchasing power per unit of money- a loss of
real value in the medium of exchange and unit of account within the economy. Interest rates and inflation move simultaneously since a movement in the former is usually influenced by a similar movement in the latter. Most banks offer interest rates on their savings accounts but not current accounts. The interest rates offered on deposits have been historically far below those charged on loans and are also far below the rate of inflation (Mensah & Abor, 2013). Thus, lending rates are generally more sensitive to inflation than deposit rates. The implication here is that investors will not be able to receive positive real returns on their investments. A positive relationship is expected between inflation, interest rates and net interest margin. This is based on explanations given by Beck and Hesse (2009) as they posit that higher inflation is associated with higher spreads and margins in Uganda. A positive relation has been repeatedly found between inflation and NIMs suggesting that improvements in the macro economy in terms of lower inflation rates translate to lower NIMs (Mensah and Abor,
2013; Aboagye et al., 2005; Bawumia et al, 2005).
Policy Rate: The policy rate is the rate set by the Monetary Policy Committee (MPC) of the Bank of Ghana
(BoG) and represents the rate at which the BoG will lend to the commercial banks (Mensah and Abor, 2013). The BoG conducts its monetary policy with this rate. To reduce the money supply, the BoG embarks on a contractionary policy by increasing the policy rate and it is decreased if the central bank wants to signal an expansionary stance.
3. Research Method
For this study, the population consists of 216 registered MFIs as reported by the BoG as at October, 2013. A purposive non-probability sampling was used in a 20 sample-size selection of MFIs which have been in existence for more than ten years, focusing on data between the years 2004 and 2013. This translates into about 200 firm observations which is fairly representative for such a panel study.
The econometric model employed in this study follows the one set out by Athanasoglou et al. (2005). The model is stated as follows:
∏it= + Ԑit (2)
Ԑit = µit + λt
Where ∏it = Net Interest Margin (NIM) of MFIi at time t, with i = 1…., N, t = 1….., T, s are K explanatory variables and Ԑit is the disturbance term with µit as the idiosyncratic error and λt, the time specific effect. In this model, the explanatory variables are grouped into bank-specific, industry-specific and macroeconomic variables. Hence, the general specification of equation (2) is as stated below:
= + + + Ԑit (3)
Where: Xit with superscripts j, l and m denotes MFI-specific variables, industry-specific variables and macroeconomic factors respectively. The individual components of these variables are explained in the next paragraph.
Thus; NIMit = β0 + β1Mprt + β2Inflt + β3Ownit + β4NEAit + β5Operexpit + β6femborrit + β 7depositsit + β8ALSit +
β9Ageit + β10Sizeit + Ԑit (4)
With i= 1,……. 20 and t = 1,……, 10 for all equations
Where is the net interest margin of MFI
i
in timet
; and t are themacro-specific variables and they represent the annual monetary policy rate and the annual inflationary rate of the economy in time
t
respectively. The MFI-specific variables are explained as follows: Ownit refers to the ownership structure of MFI i in time t. NEAit and Operexpit are the non-interest earning assets and operating expense respectively of MFI i in time t. femborrit is the percentage of female borrowers of MFI i in timet, is the total amount of deposits for MFI i in time t. ALSit also refers to the average loan size of MFI
i
in timet
whiles Ageit and Sizeit represents the number of years in existence and the size in terms of total assets of MFIi
in timet
respectively ande
it is the error term.3.1 Variables used in the study
The dependent variable used here is the net interest margin (NIM) expressed as net interest income scaled by total assets. The independent variables used in this study were grouped into two: MFI specific variables and macroeconomic variables. MFI-Specific Variables include capital, MFI size and age, subsidies, percentage of women borrowers and overhead costs. MFI capital was computed as total stakeholders fund scaled by the total assets (i.e. equity/total assets). MFI size, which was taken as the total assets of the MFI, is included in the model to test the existence of economies of scale in the Ghanaian microfinance industry. Macro-specific variables, apart from the MFI-specific and industry-specific variables, also deserve much consideration. Clearly, an unstable macroeconomic and policy environment is perceived as more risky and banks may compensate for it by requiring wider margins (Aboagye et al., 2005). The major macroeconomic variables therefore employed in this study are inflation and the BoG’s policy rate. Inflation here is measured using the actual annualized values of inflation and the policy rate is proxied by BoG’s lending rate to the commercial banks. Table 1 summarizes the variables included in this study, how they were measured and their expected impact on the dependent variable.
Table 1: Variables used in the study
Category Variables Measurement Expected Impact
MFI-specific Variable 1. MFI Size
2. Operating Expenses 3. Non-Interest Earning Assets 4. Deposits 5. Average Loan Size 6. Percentage of women borrowers 7. Age 8. Ownership
Log of total assets Op. cost/Total Loans NEA/TA
Deposits/Total loans
Gross Loan Portfolio/ Number of active borrowers
No. of females/Total No. of active borrowers
No. of years in existence Dummy (1 = foreign, 0= local) + + - - - + +
Macro-Specific Variables 1. Inflation
2. BoG’s policy rate
Actual Values BoG’s lending rate
+ + Note: ‘+’ means positive and ‘ ‘means negative
3.2 Data Sources
This work employed only secondary data for analysis and in the estimation of the empirical model. Specifically, reliable data from the Ghana Microfinance Institutions Network (GHAMFIN) and some credible institutions that run consultancy services for some MFIs in the country were collected for the period 2002-2013. An unbalanced panel emerged, since some of the MFIs in the sample have not continually been in existence for the entire of the period. Data on macroeconomic variables were collected from the Bank of Ghana. The initial computation of the collected data for the various variables and the subsequent estimation of the model were done with STATA and Microsoft Excel statistical tools.
4. Data Analysis and Discussion of Results
The following interpretations and discussions were based on the analysis and findings of the study. Table 2: Regression Model Summary
F (10, 69) Prob > F R square Adjusted R Square Root MSE
11.56 0 0.6263 0.5722 0.23259
From the estimated regression model summary in Table 2, the coefficient of determination (R2) of 0.6263 shows that approximately 63% of the variability in the dependent variable (NIM) can be explained by changes in the values of the independent variables (MFI specific and macro-economic variables) of the estimated model. At α=0.05, F (10, 69) and P < F = 0.000 indicate statistically significant predictors (Variables in the study) for the dependent variable (NIM). Additionally, P < F = 0.000 suggests a good fit data for the regression model and as such the independent variables can reliably be used in estimating the determinants of NIM among MFIs in Ghana. Apparently, further analysis on how each independent factor affects NIM is presented in Table 3.
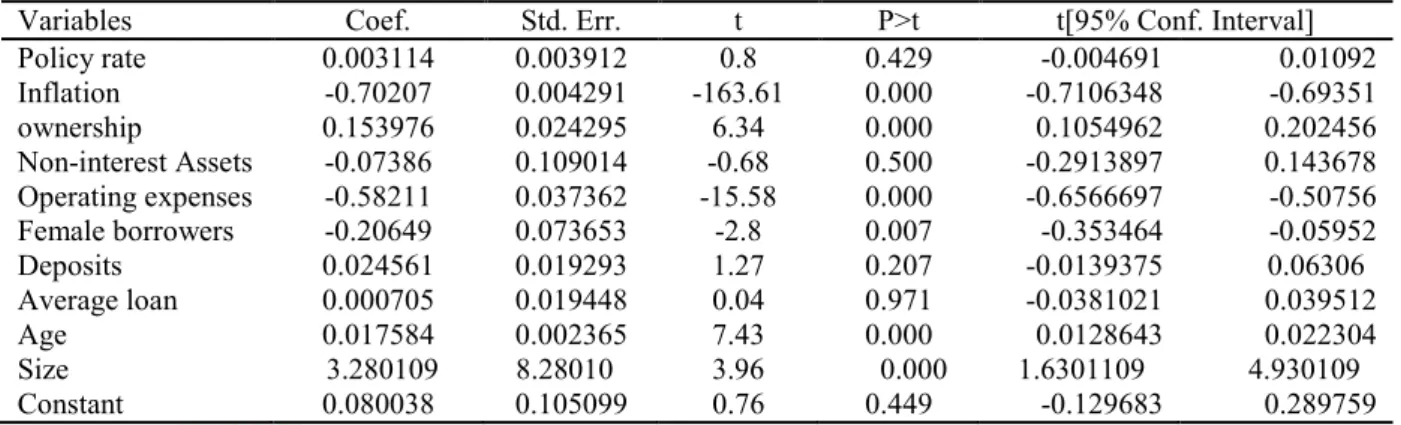
Table 3: Regression results for testing the determinants of Net Interest Margin
Variables Coef. Std. Err. t P>t t[95% Conf. Interval]
Policy rate 0.003114 0.003912 0.8 0.429 -0.004691 0.01092 Inflation -0.70207 0.004291 -163.61 0.000 -0.7106348 -0.69351 ownership 0.153976 0.024295 6.34 0.000 0.1054962 0.202456 Non-interest Assets -0.07386 0.109014 -0.68 0.500 -0.2913897 0.143678 Operating expenses -0.58211 0.037362 -15.58 0.000 -0.6566697 -0.50756 Female borrowers -0.20649 0.073653 -2.8 0.007 -0.353464 -0.05952 Deposits 0.024561 0.019293 1.27 0.207 -0.0139375 0.06306 Average loan 0.000705 0.019448 0.04 0.971 -0.0381021 0.039512 Age 0.017584 0.002365 7.43 0.000 0.0128643 0.022304 Size 3.280109 8.28010 3.96 0.000 1.6301109 4.930109 Constant 0.080038 0.105099 0.76 0.449 -0.129683 0.289759
Where nim= , mpr =monetary policy rate, infl= annual inflation rate, nea= non-earning assets/Total
Asset, operexp= operating cost/Total Loans, femborr= No. of females/Total No. of active borrowers, deposit= deposit/Loans, ALS= Gross Loan Portfolio/Total No. of active borrowers, size= log(total assets)
At α=0.05, the p-values of Infl, Ownership, Operexp, femborr, Age and Size are less than 0.5. Therefore, the independent variables; Infl, Ownership, Operexp, femborr, Age and Size are statistically significant. From the
regression result obtained, the p-value of the explanatory variables (Infl, Ownership, Operexp, femborr, Age and
Size) were less than 0.05, thus indicating that these explanatory variables (Infl, Ownership, Operexp, femborr,
Age and Size) of the estimated model had significant impact on the dependent variable (NIM). The high probability value of the explanatory variables mpr, NEA, deposits and ALS suggests that their individual impacts on the dependent variable (NIM) are respectively statistically insignificant at α=0.05.
Again, the absolute t-statistic values for infl, ownership, operexp, femborr, age and size are greater than the critical value (C) at 95% confidence level, for infl |t| = 163.61 > 1.96 = C, ownership |t| = 6.34 > 1.96 = C, operexp |t| = 15.58 > 1.96 = C, femborr |t| = 2.8 > 1.96 = C, age |t| = 7.43 > 1.96 = C and assets |t| = 3.96 > 1.96 =
C. This implies that at 95% confidence the values of β2, β3, β5, β6, β9 and β10 are different from zero indicating a valid regression model between the dependent variable, NIM and independent variables, Infl, Ownership,
Operexp, femborr, Age and Size.
However, the absolute t-statistic values for mpr, NEA, deposits and ALS are less than C at the 95% confidence level, for mpr |t| = 0.8 < 1.96 = C, NEA |t| = 0.68 < 1.96 = C, deposits |t| = 1.27 < 1.96 = C, ALS |t| = 0.04 < 1.96 = C. This implies mpr, NEA, deposits and ALS are not statistically significant. Hence, we cannot be 95% confident that the values of β1, β4, β7 and β8 are different from zero indicating an invalid regression model between the dependent variable NIM and independent variables, mpr, NEA, deposits and ALS.
Table 3 also illustrates the beta coefficients (β0, β1, β2, β3, β4, β5, β6, β7, β8, β9 andβ10). From the table, β0
0.08, β1 0.0031, β2 –0.7021, β3 0.1540, β44 –0.0739, β5 –0.5821, β6 –0.2065, β7 0.0246, β8 0.0007,
β9 0.0176andβ10 3.280. The estimated regression equation based on the above analysis becomes:
NIMit = 0.0800 + 0.0031mpr – 0.7021infl + 0.1540own – 0.0739nea – 0.5821operexp – 0.2065femborr
+ 0.0246deposits + 0.0007als + 0.0176age + 3.2801size + Ԑit (5) From the regression equation a positive correlation between NIM and policy rate, inflation, deposits, average loan size, age, size is glaring with size, age and ownership structure having significant positive impact (P on NIM whiles a significant negative impact of inflation, non interest earning assets, number of female borrowers and operating expenses on NIM is also evident.
From Table 3, age and size of the MFIs have a significant positive relationship with the net interest margin, implying that the larger the microfinance institution the higher its net interest margin. This could be due to the fact that many MFIs will go to every extent to impose higher interest rates so as to compensate for the inefficiencies that are associated with size. This finding corroborates the work of Aboagye et al. (2008) though it departs from a number of studies such as Naceur and Goaied (2008) and Fernández et al., 2012.
The coefficient for operexp is negative, also denoting a negative relationship with significant effect on NIM. Of all the explanatory variables that present a negaitive relationship with NIM, operating expense recorded the second biggest effect on NIM with a coefficient of -0.58. This however contradicts the results of related studies by Fernández et al., 2012 and Chung, 2013. It also contradicts related studies conducted on Ghanaian banks by Kyereboah-Coleman (2007) and Bawumia et al. (2005). Clearly, this suggests that interest margin of Ghanaian MFIs do not respond to operating expense in the same way as it does within the banking industry. Though very surprising, this result rather implies that NIM increases as operating expense declines and vice versa. Operating costs result in a wedge between the interest rate borrowers pay and the return lenders receive. Reduced operating costs increases lenders' returns and the quantity of loans supplied. On the demand side, reduced operating costs will lead to a fall in the interest rate that borrowers pay and an increase in the quantity of borrowing (Fernando, 2006). Fernando (2006) further documents that a decline in interest rate brought about in this manner is a "win-win-win" proposition: it is beneficial for both lenders and borrowers, will reinforce rather than undermine the development of microcredit services, and will help policy makers achieve their objective of ensuring access to credit for the poor at affordable prices.
In a related study on banks, Demirguç-Kunt and Huizinga (1999) found a positive relationship between ownership and bank interest margins. They argued that the positive relationship shows that foreign banks operating mostly in the developing countries with their superior technology are better able to manage their assets well to earn higher returns than their domestic counterparts. Mensah and Abor (2013) also documents that Martinez et al (2004)find evidence studying Latin American countries that, foreign banks exhibit lower interest margins compared to domestic banks. In the current study, this variable presents a positive regression coefficient with a p-value less than 0.1, confirming a similar effect on interest margins in the Ghanaian microfinance industry. Thus, the more the composition of a MFI is foreign, the less the interest margins and spreads expected. Finally, the regression result also reveals a negative and significant relationship between the percentage of women borrowers and the dependent variable NIM, meaning that a higher percentage of women borrowers are associated with a lower interest margin. This finding supports the theory that women are the ‘change’ agents of the family since they spend a greater percentage of their income on the welfare of their households than do men; hence, the need for microcredit to target women micro entrepreneurs than men. It also confirms the general assertion that women have proved to be more reliable borrowers and are more likely to repay promptly than men. In a similar study by Fernández et al., 2012, a positive and significant relationship only existed in the case of
pure MFIs (i.e. MFIs whose average loan size (ALS) < $300.00).
Two macroeconomic variables were included in the study; inflation and monetary policy rate. From table 3, we observe that contrary to what was expected in most research outcomes with Ghanaian banks (Bawumia et al, 2005; Aboagye et al., 2008; Mensah and Abor, 2013; Sarpong et al. 2013), our findings for inflation have a negative significant impact on net interest margin of MFIs, implying a fall in interest margins with increasing inflation.
5. Conclusion and Policy Recommendations
The original mandate of MFIs is to address the financing needs of the poor at a lower cost. However, majority of these MFIs rather unfortunately charge very high interest rates on their loans and reward suppliers of their deposits with low interest rates resulting in high net interest margins. Previous studies on interest spreads and margins in Ghana have mostly concentrated on commercial banks and not so much on microfinance institutions. As a result this study was conducted to investigate into the factors which determine the net interest margins of microfinance institutions in Ghana. The study covered 20 MFIs over the period 2004 – 2013. For microfinance specific variables, MFI size was found to be positively and significantly related to interest margins. The result, however, revealed that a higher percentage of women borrowers is associated with a lower interest margin due to the variable’s negative and significant effect on NIM. Operating expense was found to have a negative relationship with NIM and it was significant in determining interest margins. In this study, it was found to be the next biggest determiner of interest margins, next to inflation. We also observed that the ownership variable has a positive significant relationship with net interest margins, signaling the important role the variable plays in determining net interest margin of microfinance institutions in Ghana. In the case of macroeconomic variables, the study found a negative significant relationship between interest margins and inflation. This however deviates from theory, which suggests that MFIs risk making loses during inflationary periods. It also suggests failure on the part of MFIs management to anticipate inflation and duly factor it into the pricing of their lending and deposit rates. This study concludes that the high interest margins observed within the Ghanaian microfinance industry are mainly due to a combination of macroeconomic policies and firm specific factors. Therefore, this study provides the following recommendations: (1) The Bank of Ghana must devise concrete and effective measures to check proliferation and regulation within the microfinance industry. This will put a check on MFIs that are established with the hidden motive of exploiting the unsuspecting poor. (2) MFIs should not be allowed to grow too big in size as this study has confirmed that the NIM of MFI is truly a positive function of its size. (3) MFIs management should follow the subject of inflation with keen interest. This will help them to correctly anticipate it and factor it into the pricing of their rates accordingly. (4) It will also be very much helpful if the government together with the BoG pursues a vigorous campaign with the view to reducing its monetary policy rate and inflation to sustainable levels. Future research could also be engineered to decompose the operating expense variable into various components to determine which makes the most significant impact on NIM as this variable was identified to have significant positive effect on NIM. A more balanced data with increased number of years could also be the focus for further research.
References
Ahmet, U., & Hakan, E. (2010). Determinants of the Net Interest Margins of Banks in Turkey, Journal of
Economic and Social Research, 12 (2), p. 101-118.
Aboagye, A. Q., Akoena, S. K., Antwiϋasare, T. O., and Gockel, A. F. (2008). Explaining Interest Rate Spreads in Ghana. African Development Review, 20(3), 378-399.
Abor, J. (2011). Micro-Enterprise Finance. Africagrowth Institute, South Africa.
Athanasoglou, P., Brissimis S. N., and Delis M. D. (2005).Bank-Specific, Industry-Specific and Macroeconomic Determinants of Bank Profitability. (25). Bank of Greece Working Paper.
Bawumia, M., Belnye, F., and ofori, M. E. (2005). The determinants of bank interest spreads in Ghana: an empirical analysis of panel data. Working paper, Bank of Ghana.
Beck, T., and Hesse, H. (2009). Why are interest spreads so high in Uganda?. Journal of Development
Economics, 88(2), 192-204.
Brock, P. L., and Rojas Suarez, L. (2000). Understanding the behavior of bank spreads in Latin America.
Journal of development Economics, 63(1), 113-134.
Dehejia, R., Montgomery, H., and Morduch, J. (2012). Do interest rates matter? Credit demand in the Dhaka slums. Journal of Development Economics, 97(2), 437-449.
Carbo V.S., & Rodriguez, F.F. (2007). The Determinants of Bank Margins in European Banking, Journal of
Banking and Finance, 31(7), p. 2043-2063.
Demirguc-Kunt, A., and Huizinga, H. (1999). Determinants of commercial bank interest margins and profitability: some international evidence. The World Bank Economic Review, 13 (2), 379-408. Esty, K. (2011). Lessons from Muhammad Yunus and the Grameen Bank. Organisational Developments
Practice. 43, 24–28
Fernández, B. C., Fuertes-Callén, Y., Serrano-Cinca, C., and Gutiérrez-Nieto, B. (2012). Determinants of margin in microfinance institutions, 12 (30). ULB--Universite Libre de Bruxelles.
Fernando, N. A. (2006). Understanding and dealing with high interest rates on microcredit. Asian Development
Bank.
Kyereboah-Coleman, A. (2007). The determinants of capital structure of microfinance institutions in Ghana.
South African Journal of Economic and Management Sciences= Suid-Afrikaanse Tydskrif vir
Ekonomiese en Bestuurswetenskappe, 10(2), 270-279.
Maudos, J., and J.F. Guevara (2004). Factors Explaining the Interest Margin in the Banking Sectors of the European Union. Journal of Banking and Finance 28, no. 9: 2259–2281.
Mensah, S. and Abor, J. (2013). Agency conflict and bank interest spreads in Ghana. International Growth Centre.
Mitra, S. K. (2005). Asking Price of Microfinance Loan to Poor Borrowers. Institute of rural management Anand (IRMA).
Mitra, S. K. (2009). Exploitative microfinance interest rates. Asian Social Science, 5(5), P87.
Morduch, J. (1999). The role of subsidies in microfinance: evidence from the Grameen Bank. Journal of development economics, 60(1), 229-248.
Morduch, J. (2000). The microfinance schism. World development, 28(4), 617-629.
Pitt, M. M., and Khandker, S. R. (1998). The impact of group-based credit programs on poor households in Bangladesh: Does the gender of participants matter? Journal of political economy, 106(5), 958-996. Prahalad, C. K., and Hammond, A. (2002). Serving the world's poor, profitably. Harvard business review, 80(9),
48-59.
Richard, R. (2002). Micro credit Interest rates. CGAP, Occasional Paper, (1).
Rosenberg, R., Gaul, S., Ford, W., and Tomilova, O. (2013). Microcredit Interest Rates and Their Determinants: 2004–2011. In Microfinance 3.0 (pp. 69-104). Springer Berlin Heidelberg.
Sarpong JR, D., Winful, E. C., and Ntiamoah, J. (2013). Determinants of wide interest margins in Ghana: panel EGLS analysis. African Journal of Business Management, 7(35), 3535-3544.
Saunders, A., and Schumacher, L. (2000). The determinants of bank interest rate margins: an international study.
Journal of international Money and Finance, 19(6), 813-832.
Saunders, M. N., Saunders, M., Lewis, P., and Thornhill, A. (2011). Research methods for business students, 5/e. Pearson Education India.
Ugur, A., and Erkus, H. (2010). Determinants of the Net Interest Margins of Banks in Turkey. Journal of Economic and Social Research, 12(2), 101-118.
Weber, O. & Ahmad, A. (2014). Empowerment through microfinance: The relation between loan cycle and level of empowerment. World Development. 62, 75–87