http://researchcommons.waikato.ac.nz/
Research Commons at the University of Waikato
Copyright Statement:
The digital copy of this thesis is protected by the Copyright Act 1994 (New Zealand). The thesis may be consulted by you, provided you comply with the provisions of the Act and the following conditions of use:
Any use you make of these documents or images must be for research or private study purposes only, and you may not make them available to any other person. Authors control the copyright of their thesis. You will recognise the author’s right
to be identified as the author of the thesis, and due acknowledgement will be made to the author where appropriate.
You will obtain the author’s permission before publishing any material from the thesis.
User-centric Visualization of Data Provenance
A thesis
Submitted in fulfilment of the requirements for the degree
of
Master of Cyber Security at
The University of Waikato by
JEFFERY GARAE
Cyber Security Researchers Of Waikato (CROW) Department of Computer Science
Hamilton, New Zealand February 20, 2015 ©2015 Jeffery Garae
A
BSTRACT
The need to understand and track files (and inherently, data) in cloud computing systems is in high demand. Over the past years, the use of logs and data representation using graphs have become the main method for tracking and relating information to the cloud users. While it is still in use, tracking and relating information with ‘Data Provenance’ (i.e. series of chronicles and the derivation history of data on meta-data) is the new trend for cloud users. However, there is still much room for improving representation of data activities in cloud systems for end-users.
In this thesis, we propose “UVisP (User-centric Visualization of Data Provenance with Gestalt)”, a novel user-centric visualization technique for data provenance. This technique aims to facilitate the missing link between data movements in cloud computing environments and the end-users’ uncertain queries over their files’ security and life cycle within cloud systems.
The proof of concept for the UVisP technique integrates D3 (an open-source visualization API) with Gestalts’ theory of perception to provide a range of user-centric visualizations. UVisP allows users to transform and visualize provenance (logs) with implicit prior knowledge of ‘Gestalts’ theory of perception.’ We presented the initial development of the UVisP technique and our results show that the integration of Gestalt and the existence of ‘perceptual key(s)’ in provenance
visualization allows end-users to enhance their visualizing capabilities, extract useful knowledge and understand the visualizations better. This technique also enables end-users to develop certain methods and preferences when sighting different visualizations. For example, having the prior knowledge of Gestalt’s theory of perception and integrated with the types of visualizations offers the user-centric experience when using different visualizations. We also present significant future work that will help profile new user-centric visualizations for cloud users.
iv
Being part of the first and new Cyber Security Lab (CROW) at the University of Waikato, is an honour, and working towards achieving and becoming the first ever ‘Master of Cyber Security’ student could not have been done so effectively and
enjoyably without the help and encouragement of many individuals.
Firstly, I would like to extend my special thanks to my supervisor, Dr. Ryan Ko, for inspiring me with all those knowledgeable research methods, and guiding me during the course of this thesis. His research expertise have allowed me to enhance my knowledge and skills in the field of Cyber Security.
I am also grateful to everyone that has assisted me during the course of this thesis – especially, Alan Tan, Mark Will, Baden Delamore, Mohammad B Taha and the CROW team for the continuous discussions and help. All those hints, point-of-views, guides and weekly updates have helped me through the year of study. I would also like to thank and acknowledge the D3.org team, for responding well to our D3 queries, especially M.Bostock for his contribution towards D3.js and allowing us to reuse his codes.
Finally, I would like to thank my wife - Camillia, my son - Caleb Garae Liu and family for their continuous support, patience and help throughout the course of this thesis.
Table of Contents
Abstract ... iii
Acknowledgements ... iv
List of Tables... xi
List of Figures ... xiii
List of Acronyms ... xv Chapter 1 Introduction ... 17 1.1 Motivation ... 17 1.2 Thesis Objectives ... 18 1.3 Scope ... 18 1.4 Key Contributions ... 19 1.5 Thesis Outline ... 19
Chapter 2 Background and Related Work ... 21
2.1 The Visualization Discovery Process ... 21
2.2 Definitions of Research Terms... 23
2.3 Evaluation of Related Work ... 25
2.3.1 Visualization in General ... 25
2.3.1.1 Tag Cloud Visualization ... 26
2.3.1.2 TreeMaps... 27
2.3.1.3 Circular Pattern Visualization ... 28
2.3.2 Data Provenance... 31
2.3.3 Visualization of Provenance ... 32
2.3.4 User-Centricity ... 33
2.3.5 Gestalt Principle and User-centricity ... 34
2.3.5.1 Proximity ... 35
2.3.5.2 Pragnanz (Good Figure or Closure) ... 36
vi
2.3.6 Progger Dataset ... 40
Chapter 3 Analysing Different Database Storage ... 45
3.1 Comparing and Understanding Different Databases ... 45
3.2 Processing Large Datasets ... 47
3.2.1 Setup1 - MySQL Database and Storage ... 47
3.3 Setup 2 - Apache Hadoop - Database and Storage ... 49
3.3.1 Hortonworks Sandbox 2.1 ... 49
3.3.2 Why Hadoop and Hive/HBase? ... 49
3.4 Components of Hadoop used for Processing Large Datasets ... 50
3.4.1 Ambari ... 51
3.4.2 Hive ... 51
3.4.3 HBase ... 51
3.4.4 Pig ... 51
3.5 Hadoop – Hive Database Design ... 52
Chapter 4 D3 and Gestalt Integration Design ... 55
4.1 D3.js ... 55
Why D3.js? ... 55
4.2 UVisP’s User-Centric Technique ... 56
4.3 D3 visualization and Gestalt Integration Design ... 57
4.3.1 Types of Visualizations ... 58
4.3.2 Common Grounds in Visualization Type and Gestalt Laws. ... 59
4.3.3 The use of the Perceptual Key in Visualizations ... 60
4.3.4 User Queries /Survey ... 61
Chapter 5 UVisP Design and Methodology ... 65
5.1 UVisP Skeleton View ... 65
5.2 UVisP Flowchart ... 66
5.2.2 Hadoop Storage Infrastructure ... 67
5.2.3 UVisP Web Interface ... 68
5.2.4 D3.js ... 68
5.2.6 Progger Logs ... 68
Chapter 6 UVisP Implementation ... 71
6.1 Data Collection Process ... 71
6.1.1 Progger Data... 71
6.1.2 Data Collected from User Study (questionnaire) ... 72
6.2 Loading Data into Database ... 72
6.3 Converting Raw Progger Data to .json and .csv Format ... 73
6.3.1 .json File Format Sample Output ... 75
6.3.2 .csv File Format Sample Output ... 76
6.4 Building Visualization using D3.js ... 77
6.5 UVisP Visualization Samples ... 77
6.5.1 UVisP Data Statistical (Similarity & Grouping) Visualization ... 78
6.5.2 UVisP Data Identification (Proximity) Visualization ... 79
6.5.3 UVisP Data Tracking (Similarity & Pragnanz) Visualization ... 80
6.5.4 UVisP Data Tracking and Journey (Continuity) Visualization... 82
Chapter 7 Evaluation ... 85
7.1 Novel Technique for Visualizing Provenance ... 85
7.2 The D3 – Gestalt Model of Association ... 85
7.3 Research Challenges ... 86
7.4 Advantages of Proof Of Concept ... 94
7.5 Visualization Analysis ... 94
7.5.1 The Gestalt Proximity Visualization ... 94
7.5.2 The Gestalt Simi-&-Pragnanz Visualization ... 95
7.5.3 The Gestalt Continuity Visualization ... 97
viii
7.6.1.1 UVisP User Test Phases ... 99
7.6.1.2 Visualization vs Information Level / Understanding ... 100
7.6.1.3 Visualizations vs Prior Knowledge Gestalt’s Theory of Perception 100 7.6.1.4 Visualization vs Time ... 101
7.6.1.5 User Study Analysis of Findings ... 101
7.6.1.4 User Study Analysis on Feedback ... 101
Chapter 8 Conclusion ... 103
8.1 UVisP – A Novel Visualization Technique ... 103
8.2 Future Work ... 105
References ... 107
Appendix A ... 113
A.1 Ethical Application Approval Letter. ... 113
Appendix B ... 114
B.1 User Study Questionnaire 1 - part 1 ... 114
B.2User Study Questionnaire 1 - part 2 ... 115
B.3 User Study Questionnaire 2 ... 116
B.4 User Study findings ... 117
B.5 UVisP – User Visualization Questionnaire and Feedback ... 120
B.6 UVisP – User Visualization Questionnaire and Feedback Sample ... 121
B.6.1 User ID: 1 Test Results ... 121
B.6.2 User ID: 2 Test Results ... 122
Appendix C ... 123
C.1 Index.html ... 123
C.3 indexCBV.html ... 125
B.4 indexCBVv4.html ... 126
C.5 Hadoop-hive-thrift-client connection (connection.php) ... 127
D.1 Vis_Type_1 ... 128 D.2 Vis_Type_2 ... 129 D.3 Vis_Type_3 ... 130 D.4 Vis_Type_4 ... 131 D.5 Vis_Type_5 ... 132 D.6 Vis_Type_6 ... 133 Appendix E ... 134
E.1 Progger Log Format ... 134
E.2 Progger System Calls Lists ... 135
E.3 A Progger Raw Data Sample From a ‘scp’ Scenario. ... 136
Appendix F ... 137
F.1 MySQL Database Implementation – Steps ... 137
L
IST OF
T
ABLES
Table 3.1. A comparison between the database systems . ... 46 Table 4.1. Types of Visualizations. ... 58 Table 4.2. A D3 – Gestalt Model of association. ... 62 Table 7.1. A subsection of Table 4.1, showing the relationship between the Gestalt approach and the types of visualization. ... 86 Table 7.2. User Visualization test findings and summary. ... 99
L
IST OF
F
IGURES
Figure 2.1. Views on Visualization. ... 21
Figure 2.2. The visualization discovery process. ... 22
Figure 2.3. An example of a bar graph to illustrate an online survey bias – Traffic Sources. ... 26
Figure 2.4. An example of a tag cloud visualization of Data visualization subgroups. ... 27
Figure 2.5. An example of a Dynamic Squarified Treemap. ... 28
Figure 2.6. An example of some patterns and possible correlation between rainfall intensity and traffic speed identified from the AnalyticaR representation. ... 29
Figure 2.7. A ‘Circle Segments’ Technique for 8-dimensional Data. Users can control the arrangement of the dimensions especially when visualizing large datasets using multiple dimensions. ... 30
Figure 2.8. An example of visualizing 7-dimensional Data with the ‘Circle Segments’ Technique. Data used for this visualization is based on a stock market dataset. ... 30
Figure 2.9. An example of an exploratory Visualization. ... 32
Figure 2.10. An example of Visualizing Provenance to show the history of relationships between daily products . ... 33
Figure 2.11. An example of the Gestalt Law of Proximity (Gestalt theory) . ... 36
Figure 2.12. An illustration of the Law of Pragnanz – Good Figure, Closure (Gestalt Theory) . ... 37
Figure 2.13. An illustration of the Law of Common Fate (Gestalt Theory) . ... 38
Figure 2.14. An illustration of the Law of Similarity (Gestalt Theory) . ... 39
Figure 2.15. A captured snapshot of parts of the Progger log format. ... 40
Figure 2.16. A captured snapshot of Progger log syscalls. ... 41
Figure 2.17. A Progger raw data sample generated and displayed in a log file format. ... 42
Figure 3.1. A snapshot of phpmyAdmin database system. ... 49
Figure 3.2. A Hadoop structure with its core components . ... 50
Figure 3.3. The Hadoop – Hive database design. ... 52
xiv
Figure 4.3. A D3 – Gestalt Visualization Model of the user perceptual experience. ... 60 Figure 4.4. A perceptual key (s) illustrated in the Pragnanz visualization of the dog. . ... 61 Figure 5.1. A skeleton view of the Visualization Design. ... 65 Figure 5.2. A Flowchart diagram of UVisP. ... 66 Figure 6.1. A snapshot of Hadoop – Hive Database / table with uploaded data. .. 73 Figure 6.2. D3 source code to convert flat data into a tree. ... 74 Figure 6.3. A snapshot of a .json file format from D3. ... 75 Figure 6.4. A snapshot of a .csv file format from D3. ... 76 Figure 6.5. An example of the UVisP Visualization showing ‘File Action Statistics’ and applying the Gestalt law of Similarity, Good Figure and Simplicity. ... 78 Figure 6.6. An example of the UVisP Visualization showing ‘file tracking’ and applying the Gestalt law of Similarity and Simplicity. ... 80 Figure 6.7. UVisP Visualization sample showing file action relationships and applying the Gestalt Law of Similarity, Continuity and Good Figure. ... 81 Figure 6.8. An example of a ‘file-tracking’ Visualization from UVisP. It shows how the ‘Fileopen.txt’ is created. ... 83 Figure 7.1. An example of an UVisP visualization during the development process. ... 89 Figure 7.2. An example of an UVisP Pragnanz visualization during the development process. ... 90 Figure 7.3. An example of an UVisP Common Fate visualization during the development process... 91 Figure 7.4. An example of the tracking the data of selected choice. ... 95 Figure 7.5. Visualization with Similarity and Pragnanz. ... 96 Figure 7.6. This visualization shows the movement of files. Tracking of files are indicated in this visualization which makes the visualization. ... 97 Figure 7.7. A Gestalt Continuity Visualization for the “File-Create” Scenario. ... 98
L
IST OF
A
CRONYMS
API Application Program Interface
CSS Cascading Style Sheets
CSV Comma-separated values
D3 Data-Driven Documents
DB Database
GUI Graphical User Interface
G.S-V Gestalt - Similarity
G.P-V Gestalt – Proximity
G.Pr-V Gestalt - Pragnanz
G.CF-V Gestalt – Common Fate
HDP Hortonworks Data Platform
HDFS Hadoop Distribution File System
HTML HyperText Markup Language
IT Information Technology
JSON JavaScript Object Notation
RSYSLOG Rocket-fast System for Log Processing
SCP Secure copy
SVG Scalable Vector Graphics
PHP A server-side scripting Language designed for web
development but also used as a general purpose programming language
PM Physical Machine
xvi
UVisP User-Centric Visualization of Data Provenance with Gestalt
C
HAPTER
1
I
NTRODUCTION
1.1
M
OTIVATIONThe complex changes on networks raises the question of how to secure them. Before securing these networks and systems, one needs to “know” or “see” what is going on in these systems. A proposed solution to this is visualization. With the state-of-the-art ‘data visualization’ techniques are the means of providing a visible solution to knowing what is going on in these systems. It also helps users to actively identify useful patterns and gens within the data when picturing different visualizations [11]. In the area of security, data provenance is a burgeoning field for data security particularly for knowing what goes on with the data. Data provenance enables the ability of keeping track of file movements over the network and on the Internet. However in the area of provenance, visualization is not a well-studied topic. Most visualizations in this area of study are for exploratory purposes. Therefore the need to bring visualization into provenance at the end-users perspective is a high demand. Such visualizations depict the history of their data when needed.
The main objective of this research is to explore potential methods and techniques of visualizing provenance to benefit the end-users of the cloud network. Based on this research objective, evaluations on past and existing works on data and user-centric visualization will be carried out. This thesis presents a user-user-centric visualization technique (UVisP) centred on visualizing provenance. It incorporates the concepts of Gestalt theory of perception [29] to provide a user-centric approach. The aim of UVisP is to transforms data into visualization for end-users to identify useful patterns, gens, trends, and relationships by observing activities of interested files over the network in a given time. Such observations leads to new insights which will be discussed in Chapters 6, 7 and 8 of this thesis.
18
1.2
T
HESISO
BJECTIVESBased on the main research objective, a set of sub objectives are identified. These are:
To understand relevant user-centric theories and frameworks applied to
visualization.
To empower users to understand provenance elements and granularities of
systems (application, virtual machine (VM), physical machine (PM), and cloud) by applying visualization theories
To propose a novel technique to analyse existing visualization which
empowers users to interpret their data’s provenance elements and security throughout their data life cycle.
1.3
S
COPEThe focus of this thesis is on visualizing provenance at granularities. This enables end-users with an opportunity to view data over the local and cloud environment. Based on the time frame of this thesis, we will only look at visualizing provenance for the purpose of file tracking and movements:
Within a local machine
Across two VMs, and
From a physical machine to a VM.
In addition, this thesis emphasises on the application of ‘Gestalt Theory of perception.’ These inclusion of Gestalt theory will create that user-centric relationship between the end-users and the UVisP interface. It will also provide the background knowledge to the end-users of how UVisP intends to deliver its visualizations to the end-users. Visualization patterns and organisations are some of the background knowledge inserted into end-users prior to visualizing with UVisP.
All datasets will be generated and collected using Progger (Provenance Logger) [5]. This thesis will not address visualization for:
Tracking virtual-physical mapping, and vice versa.
Detecting data leakage threats
Overall, this thesis will focus on the user-centric aspect of visualizing provenance to benefit end-users.
1.4
K
EYC
ONTRIBUTIONSThe main contributions of this thesis are as follows:
We propose a novel user-centric visualization technique for visualizing
provenance. Our technique is based on an UVisP (User-centric Visualization of Data Provenance with Gestalt) technique for visualizing provenance at the users’ level of understanding and knowledge.
We implement our novel technique by integrating D3, an existing
visualization API with the Gestalt theory of perception. To the best of our knowledge, this is the first time, such user-centric technique is proposed.
We evaluate our methodology using random users of provenance
visualization and found positive impacts on how end-users extract useful knowledge and information from our visualizations.
We introduce and define “perceptual key.” A core aspect to identifying
useful patterns and information indicators in a user-centric provenance visualization.
1.5
T
HESISO
UTLINEThis thesis is organized as follows:
Chapter 2 covers the new terms, definitions and evaluates past and existing works in this area of study. For this it highlights existing visualization gaps and limitations to this field.
Chapter 3 describes the ‘user-centric visualization’ technique (proof of concept). It also provides the design, UVisP Flowchart, and components. And finally it provides the UVisP’s user-centric (U-C) technique that will be used to obtain the final visualizations.
20
Chapter 4 provides a detail description of the proposed technique and how it is implemented. For this it describes the UVisP implementation phases and their distinctive tasks. It also describes the user-testing steps of execution and how the testing will be carried out.
Chapter 5 discusses the user-centric visualization methods and technique. It also analyses the findings from the datasets provided using a given visualization. This chapter also describes relationship between Gestalt and the UVisP visualizations. Chapter 6 concludes the thesis. For this it summaries all the methodology and techniques used to achieving user-centric visualizations. Furthermore, it states the future works.
C
HAPTER
2
B
ACKGROUND AND
R
ELATED
W
ORK
This section begins by providing a background on visualization research and defining some commonly used terms in this thesis. It then evaluates past and existing works within the field of visualization, user centricity, data provenance and Gestalt theory of perception. Based on the evaluation, existing research gaps, limitations and findings are analysed and presented.
2.1
T
HEV
ISUALIZATIOND
ISCOVERYP
ROCESSVisualization is a common method for analysing, relating and understanding scientific datasets. Previous research show that visualization exists for several reasons: technology, art and for an empirical science [19]. Different visualizations target specific user groups for specific goals, needs, environment and time [12]. For example, most visualization gives the users the flexibility of customizing their displays and visual view in an understandable way [15] [10] [19]. Figure 2.1 states that visual views could be for the purposes of technological effectiveness and efficiency and it could also be for the purpose of artistically elegance and beauty. In a scientific point of view, generic laws are the users’ view.
Figure 2.1. Views on Visualization [19].
In order to acquire these user views, one must understand the visualization discovery process as presented in Figure 2.2.
22
Figure 2.2. The visualization discovery process [10].
(Data encompasses the range form a single bit, to time-varying 3D tensor fields, to multi-model data sources requiring alignment, registration, and fusion, and to non-spatial information sources integrating broad areas of human knowledge) [10].
The ‘visualization discovery process’ in Figure 2.2 shows a simplified process of how raw data is being inserted into a visualization system then transformed into knowledge [10] [36]. Users have the flexibility to adjust specifications of the visualization according to how they perceive the final visualization output. The output relies on human perception and sense [10] and therefore producing specific informative visualizations.
Informative visualizations are valuable. For instance, in the field of data provenance, visualization can be a means of parsing and understanding a range of datasets especially large datasets [43]. It facilities a methodical way of not only understanding large data sets, but allowing a coherent view for the users of the visualization.
2.2
D
EFINITIONS OFR
ESEARCHT
ERMSBefore we explore the landscape of user-centric visualization and related works, let us define a few terms commonly used in this thesis.
User-Centric
User-Centric (U-C) is defined in [6] as “contextual pieces of information as the user perceives them.” In the context of this research, user-centric is a term given to an end user driven environment whereby the users possess the centre of attention on products and services, i.e. requirements, preferences and access controls on products and services varies according to the user hierarchies. For example, age groups and genders.
Visualization
The Oxford English dictionary defines visualisation as “the power of forming a mental picture or vision of something not actually present to the sight; a picture thus formed [77].” Visualization in this research is defined as an effective technique of creating imagery, diagrams and animations to draw insights on abstract and concrete ideas from data.
Data Visualization
Data visualization is a process of mapping data to visuals, i.e. data in, visual representation out.
Data Provenance
Data Provenance is defined in [41] as “a meta-data describing the derivation history of data.” Data Provenance is defined in [77] as “a record of origin and evolution of data.” Data Provenance in the context of this research is defined as “series of chronicles and the derivation history of data on meta-data”.
End-User
End-user in [37] is defined as “a role that a software program hardware device is designed for.” The term is based on the idea that the end goal of the software or hardware product is to be useful to the users. For this research, end-user is a non-technical personal who interacts with the hardware or software directly after it has been fully developed, marketed and installed. While end-users can mean companies
24
and institutions, it is also the person who keeps calling the ‘IT Guys’ with queries to why the product or service is not working correctly. In this research end-users and users are the same person.
Touched
‘Touched’ in the context of this thesis refers to any actions caused on a file either in the physical or cloud environment. It can mean:
Viewing the file,
Accessing the file,
Moving the file from one location to another, and
Having authorized access or rights to the files.
Unauthorized
‘Unauthorized’ users refers to any users of the physical or cloud environment that
are not allowed to view or ‘touch’ (see above) certain files.
Dataset
Dataset in this research refers to the data being collected by Progger.
Perceptual Key
‘Perceptual key’ is defined as the act of recognizing the very first key-identifier, eye-catching, common and recurring pattern(s) in a given visualization.
2.3
E
VALUATION OFR
ELATEDW
ORKAs shown previously in Figure 2.2, users are the active component of the visualization discovery process. They process and transform raw data into knowledge from the visualizations.
A vast amount of work concentrating on visualization and security specifically targeting IT expects who wishes to analyse data and produce reports out from the findings. However, less work in the field of “visualizing data provenance” for security purposes to address the end-users needs. Visualizing data provenance can help on to understand the life cycle of his/her data and observe potential security breaches.
There are several types of related works: Firstly, related works regarding visualization in general and visualization of provenance. Secondly, related works regarding user-centric visualization. Thirdly, related works regarding the Gestalt theory of perception, and finally, related works regarding how Progger works and presents information to the users.
During the research we also explored the storage and processing of logs for visualization, and the relationship between Gestalt and the visualization APIs. These will be discussed in Chapters 3 and 4.
2.3.1 VISUALIZATION IN GENERAL
We will now review some contemporary exploratory visualization techniques. We begin with setting the foundation of visualization by addressing the general use of line/bar graphs, pie charts, donut charts and heat maps to explore and analyse data through visualization. It has been the preferable solution for most researchers in the past and up till today [51] [67] [69].
These types of visualization have paved a way forward to new and intractable visualizations which will be discussed later in this chapter. For example, Figure 2.3 shows a bar graph of traffic resources based on an online survey [68]. It measures all visits to the online survey bias in percentage form and delivers the results in a form of a bar graph for users to observe.
The use of bar graph, line graphs and other popular graphs has been around in the research fields for centuries, and centered towards research purposes. Their
26
existence came about as a better way to display data in a visual representation than using tables [27]. However, to date, the presence of visualization in the research fields has attracted researchers to adopt graphs, pie-charts, and other common graphs into the visualizations to address user interactions and a means of providing exploratory information.
Figure 2.3. An example of a bar graph to illustrate an online survey bias – Traffic Sources [68].
2.3.1.1 Tag Cloud Visualization
The use of a ‘tag cloud’ for visualization is another example which came around to replace the use of list. This type of visualization is simple and easy to understand however, it is not user-centric in a sense that it does not produce analytic outputs apart from identifying the ‘order of importance’ and/or ‘giving a count on the number of words appearing the most number of time.’ Moreover, this type of visualization is still inconclusive within the research fields since there is still no prove on how effective it is. [67] [75]. Figure 2.4 shows an example of a tag cloud visualization which shows a visualization of data visualization and its subgroups.
Figure 2.4. An example of a tag cloud visualization of Data visualization subgroups [51].
2.3.1.2 TreeMaps
‘Treemaps’ or ‘Dynamic Squarified Treemaps’ by Bhulai et al. [75], is another type
of visualization introduced to solve the representation issues tied to the lists and tag clouds. The size of the squares in the dynamic squarified treemaps represents the magnitude or importance of an item. One can argue that this is user-centric and that it provides a reasonable amount of information to the users. However, as data grows, scalability can become an issue with this type of visualization because of proliferation of tiny and large datasets requiring human-supervised analysis [67] [69]. For example, the ratio in size, of the largest square in the ‘dynamic squarified treemap’ to the smallest square can become small to a point where users of the visualization cannot read and analyse the treemap visualization. Figure 2.5 illustrates an example of a ‘Dynamic Squarified Treemap’ visualization based on company income. As shown in Figure 2.5, large datasets are visible. However take a new company, ‘X Company’ for example, has only $1 million for its income. To visualize ‘X Company’ along with all other existing company will be a user-centric issue, since the ratio of the largest company to the ‘X Company’ is so big that
28
visualizing it on the existing Dynamic Squarified Treemap’ will be difficult in terms of visibility.
Figure 2.5. An example of a Dynamic Squarified Treemap [74].
2.3.1.3 Circular Pattern Visualization
The ‘Circular Pattern’ representation visualization is another form that addresses large datasets. The so-called “AnalyticaR ([Unpublished work] -a visualization technique for data exploratory)” helps users to view data with a reasonable amount of space without much effort [5]. Similarly, in [18], visualization of large datasets are represented using circle segments for ‘data exploratory’ purposes. The basic idea behind representing large datasets using circle segments is to display all data dimensions as segments of the circle, i.e. data is viewed in a reasonable amount of space without much effort.
Other techniques aimed at visualizing very large amount of data is using ‘recursive patterns’ [62]. This technique is specifically for multidimensional data and it is built using generic recursive scheme. Due to its ability to build visualization using generic recursive schemes, it requires less resources, time, and provides better multidimensional data visualization. However, with tiny or small datasets, this technique is not a feasible user-centric solution for visualization.
However, with the existing examples of visualization stated in Figure 2.6 and Figure 2.8, the emphases are exploring and analysing data for better understanding. There is less focus on who the targeted audiences are. With different levels of visual evaluations by targeted audiences, end-users may struggle to understand such visualizations. Visualizations targeted for end-users should be user-friendly and the presentation of information has to be at their degree of understanding, i.e. the time taken for an end-user to see and process the visualization to obtain knowledge should be in seconds.
Figure 2.6. An example of some patterns and possible correlation between rainfall intensity and traffic speed identified from the AnalyticaR representation [5].
30
Figure 2.7. A ‘Circle Segments’ Technique for 8-dimensional Data. Users can control the arrangement of the dimensions especially when visualizing large datasets using multiple dimensions [62].
Figure 2.8. An example of visualizing 7-dimensional Data with the ‘Circle Segments’ Technique. Data used for this visualization is based on a stock market dataset [62].
Src:http://kops.uni-konstanz.de/bitstream/handle/123456789/5943/Circle_Segments.pdf?sequence=1
2.3.2 DATA PROVENANCE
In order to visualize provenance, we need to understand data provenance. Therefore
in this section, we will begin by understanding “what is provenance?” We will also
look at the ‘uses’ and the ‘issues’ of data provenance which are highlighted by previous researches.
The notion of “provenance” originates from “the art and archiving worlds, where
it refers to information about the creation, chain of custody, modifications or influences pertaining to an artefact” [59].
Data Provenance in the context of this thesis is defined as “series of chronicles and
the derivation history of data on meta-data”. Often scientific domains specifically use different forms of provenance for different purposes [13] [14]. Data provenance has gained an increase in interest recently due to its contribution in unique desiderata introduced by the distributed data in grids [13] [14].
Other facts which make provenance an interesting matter to consider and work with is the usefulness of provenance in certain domains and the fact that they are linked to the granularity at which it is collected [13] [14]. While provenance is proven to be interesting and important with graphing operations and its representations, the security of provenance can be an issue [23] [44] [64] [65] [66]. For example, copying and transforming data on and over the web or even in local machines has made it difficult to determine the origins of a piece of data [23].
Therefore the use visualization tools are a means of securing and tracking provenance when tracking file movements. On that note, existing visualization of provenance are for analysis and exploration purposes, which means the targeted audiences are technical people who seek methods to understand large datasets and provenance better. However the need to capitalize on data provenance towards the end-users advantage, is yet to be addressed. On that note, introducing “user-centric” visualizations to link data provenance and the end-users together is a prominent visualization technique that will result in understanding data provenance better. We will look into this after explaining about visualization of provenance in the next section.
32
2.3.3 VISUALIZATION OF PROVENANCE
As visualization in general is a popular means of data representation, visualizing provenance is still in its beginning years, whereby researchers are gradually changing from the current graphing (use of graphs) techniques, circular patterns and moving onto applying other existing visualization techniques. This is due to the rapid study and use of ‘data mining’ and analysis of large datasets.
Past and existing visualization of provenance are considered partial and contains a lot of information. For example, in the paper “Visualizing Large Scale Scientific Data Provenance [18]”, the visualization approach is based on large datasets for exploratory purposes. Although there are features of user-centric visualization within this visualization, there are still no visibility with the fonts used in the writings. This makes it not user-centric.
Figure 2.9. An example of an exploratory Visualization [1].
Another example of visualization of provenance is discussed in the paper
large provenance datasets for exploratory and explanatory purposes [78]. This is another example of user-centric provenance visualization showing the chain of history of datasets.
This visualization uses the “layout” technique to improve the researchers’ understanding of large datasets. The important components here in this the visualization are; ‘the nature of provenance data’ and the ‘user requirements’. For example, Chen et al, showed (Figure 2.10) the provenance visualization displaying the relationship between sea-ice data products [78]. Here we see that the nature of the provenance dictates the outcome of the visualization. However, the user’s requirement is an important input to producing this visualization as well. This provides the degree to how much user-centricity it is.
Figure 12.10. An example of Visualizing Provenance to show the history of relationships between daily products [78].
2.3.4 USER-CENTRICITY
As mentioned in the earlier sections, the connection between data provenance and end-users is a user-centric visualization technique. End-users contribute remarkably towards these techniques. However, users have remarkable perceptual capabilities that tend to be misjudged in current visualization designs and tools [71]. Occasionally, this is due to lack of analysing the users well in terms of [81]:
34
Who are the users?
What do the users want?
What tasks can be performed using these visualizations?
What are the users’ working environments?
The need to empower web applications and security tools to become user-centric plays a huge role in allowing users to easily collaborate with applications and security tools. Therefore the developer has to consider not only the surface level of user interfaces but also the complex structure of users, tasks and the different functions that the system is built for.
This thesis stresses while existing visualization researches and tools are built for analytic purposes, they are not built for end-users [42]. For a standard end-user to be able to use these visualization tools to obtain satisfactory solutions their queries requires time and further training.
2.3.5 GESTALT PRINCIPLE AND USER-CENTRICITY
Another part of our related works is to describe and evaluate the “Gestalt Theory of Perception” and investigate whether the application of Gestalt’s theory into visualizations would make visualization user-centric. We will begin with making a comparison between two entities or observations.
Munzner et al. stated that “to extend visualization’s utility, we must integrate visualization with other techniques and tools from other disciples” [52] and that
user perceptual and cognitive capacities are mostly permanent and not subject to Moore’s Law [52]. Therefore, based on humans’ own perceptual and cognitive capacities, user views, the approach and understanding towards visualization often remains the same.
While human perceptual and cognitive capacities contribute to interpreting existence, science and visualization are useful when relating datasets to users so they can understand and relay better to different visual representations. In the area of design, Gestalt theory has succeeded on playing an important role in making visualization or visual data representation becoming more user-centric. The Gestalt principles established by Max Wertheimer, Wolfgang Kölher and Kurt koffka [29]
[55] states the key ideas behind Gestalt theory and the principles of the Gestalt perception model [2] [7] [8] [25] [45] [53].
While Gestalt theory has its advantages, it does possess its challenges and limitations. These challenges are closely related to the perceptual grouping and figure-ground organization. For example, there is a need for further analysis on the factors that are common in both the grouping and figure organization. There is also a need to fully distinguish between perceptual grouping and figure-ground organization [2]. Such challenges and limitations can affect visualizations when trying to apply both the perceptual grouping and figure-ground organization into one visualization. In other words, how can a visualization express and display either theory into one visualization?
Apart from challenges and limitations, there are other people who opposed Gestalts Work. People like I.P.Pavlo, who strongly provide objections to the Gestalt psychology issues of causality, methodology and on the problem of mind and body [54]. However these objections have not weakened the influence of Gestalt psychology.
Nevertheless, the Gestalt theory of Perception still dominates the research field with its wide application and use to date. The Gestalt perception model [47] states that “the whole is other than the sum of the parts.” The original principles as listed in
the paper “Laws of Organization in Perceptual Forms” by Max Wertheimer in
1923 stated the following [47]:
Proximity
Good figure
Common Fate
Similarity
We will now elaborate on these principles.
2.3.5.1 Proximity
The Proximity Law states that [32]:
“Items or points placed near each other appear to be a group.”
36
According to the Law of “Proximity”, observers naturally and mentally consolidate nearby elements into groups to form a coherent object, because they assume that closely spaced elements are related or associated and those further apart are unrelated [31] [32][46][53].
The purpose of this is to allow observers to draw up conclusions from visual representations according to their own judgement by allowing Proximity elements to induce the mind to perceive a collective or totality. This technique can be applied into visualization to allow users of the visualization to perceive a collective or totality when confronting visualizations of such natures.
Figure 2.11. An example of the Gestalt Law of Proximity (Gestalt Theory) [46].
2.3.5.2 Pragnanz (Good Figure or Closure)
The Law of Pragnanz states that [45]:
“A stimulus will be organized into as good figure as possible.”
“Identifies an organizational tendency – a way in which the human brain decides that things go together”
Kohler Wolfgang
The key idea here is that good figure delivers a simple design or a symmetrical layout [32] [45] [53]. The Law of Pragnanz was developed by Kohler (Gestalt psychologists) [31] [32] [45]. Pragnanz is a term in German that mean ‘clarity’ or
‘good form’. This is why the Law of Pragnanz is often known as “Good Figure” or “Closure”. The Law of Good Figure uses the Law of “Similarity” for a complete organizational tendency [32].
Figure 2.12. An illustration of the Law of Pragnanz – Good Figure, Closure (Gestalt Theory) [45].
In Figure 2.12, the human mind has the ability to perceive and form that good figure of a dog sniffing the ground as shown in the red coloured circle. This mental and natural technique of forming images makes such visualization attractive to end-users therefore creating the whole experience a user-centric and subjective experience.
38
2.3.5.3 Common Fate
The Law of “Common Fate” states that [31]:
“Humans tend to perceive elements moving in the same direction as being more related than elements that are stationary or that move in the different direction”
This law applies to stationary and motion objects. However the objects moving, for example in “Figure 2.13” below, fishes swimming in the same circular direction are clearly related to each other, by forming one unit [53]. This is the perceptual law of “Common Fate.”
Figure 2.13. An illustration of the Law of Common Fate (Gestalt Theory) [53].
Applying the law of Common Fate to data visualization will allow users to perceive and draw out hidden information. This is particularly useful for applications into security event visualization. For example a group of moving data points, represented using bubbles, can alert end-users that these points represent the same file activity and could be related, whereas points stationary or scattered far apart illustrates that data points represent different and unrelated file activity.
2.3.5.4 Similarity
The Law of Similarity states that “similar objects are set to be counted together as
the same group.” The purpose of this is to attract the observers’ attention [31] [32] [53] [72].
The adoption of the Law of Similarity to data visualization contributes to a vast end-user understanding towards scientific and technical data analysis. At the time of writing, the Gestalt Law of Similarity has been used within visualizations but researches have not clearly identified it and have not acknowledge its existence. Therefore the need to apply the Gestalt Law of Similarity to visualizing data provenance is highly recommended.
Figure 22.14. An illustration of the Law of Similarity (Gestalt Theory) [72].
However in 1999, Stephan Palmer [47] [63] further added a variety of laws and principles onto the list of Gestalt principles. This is due to the fact that “Similarity” has all forms [19] [47] [76]. For example, Proximity can be Similarity in location; and Common Fate can also be Similarity in time; and others as well. The principle of “Continuation”, “Simplicity”, “Familiarity”, and “Connectedness” have been added to the list and now commonly used by researchers [2] [8] [31] [32] [46] [72] [76].
40
2.3.6 PROGGER DATASET
Having to understand the Gestalt theory of perception and its application, we now take a look at the datasets which will be used in this thesis. All datasets are generated from Progger (short for “Provenance Logger”) [58]. The datasets are the raw data for the visualization for this visualization technique. It is the provenance which we will later visualize to understand, track and observe data throughout this thesis.
This section also describes the current status of how Progger datasets are presented to the user and the components of Progger log. Moreover the correlation between the datasets and the application of Gestalt theory of perception are yet to be discussed.
Figure 2.15. A captured snapshot of parts of the Progger log format.
We begin this section by observing existing snapshots of the Progger log for a better visual understanding. Figures 2.15, 2.16 and 2.17 shows the format of the log, the Progger system call lists, and how Progger records and presents its data to users. Currently the Progger dataset is presented in a log format and has no visual
representation. It contains a lot of kernel based information collected from capturing system calls in the Linux kernel module. For example, kernel version, type of system-call, user, processor-id, filename, file-paths and other required details.
As observed in the Figure 2.15, we see that the Progger log format contains all the syscalls. Each syscall types contain attributes that correspond to the type of syscall. For example, a syscall for “open” is “LOG_OPEN.” The attributes associated with the syscall open, are; ‘type’. ‘user’, ‘pid’, ‘ppid’ all the way down to attribute ‘fd’. These attributes are assigned to store values related to the “LOG_OPEN” syscall. The second part to the LOG_OPEN call type, is a line “printk” function. This executes all prints to the corresponding attributes stated above. There are about 32 syscall types, and all have different attributes, types and values. Figure 2.16 defines the system calls and identifies them with an integer.
42
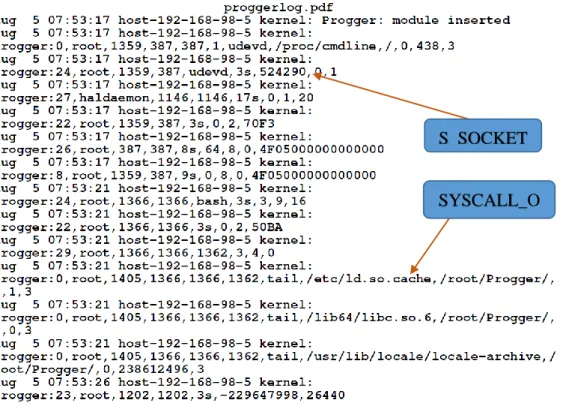
Figure 2.17. A Progger raw data sample generated and displayed in a log file format.
Observing Figure 2.17, we see a captured system call from Progger. As indicated in the Figure 2.17, a “Progger: 24, root, etc...” call was executed as shown in Figure 2.17. “Progger: 24, root, …,” is identified as “Syscall_S_SOCKET” call. “Progger: 0, root, …, is equivalent to a “Syscall_OPEN” call. This call is executed when a file, directory is opened.
At this stage, this thesis acknowledges the development of Progger being at its initial state and that it has no end-user visualization platform. However, its ability to track files and operations makes it interesting to use.
The current log representation (without visualization) can be regarded as ‘too much’ information for an end-user especially while trying to understand and carry out such user actions as ‘tracking’ his/her files. Therefore the need to build a visualization tool alongside Progger is in high demand. This is to provide the same output information as the current log but in a visual representation view that any end-user could go to when tracking files.
Overall, previous researches have produced user-centric visualization tools but the targeted audiences are directed towards the technical and research personals and such visualization are purely for exploratory and analytical purposes. End-users
S_SOCKET
SYSCALL_O PEN
have little access to web tools that are available for visualizing data provenance. Finally the need to apply Gestalt laws in a graphic design perspective alongside the scientific visual representation does have an effect on changing the current idea of using visualization for exploratory and analytical purposes to an end-user demand. This visualization application data provenance is a ‘missing link’ or factor between end-users and existing visual representations (Data Provenance Visualization).
C
HAPTER
3
A
NALYSING
D
IFFERENT
D
ATABASE
S
TORAGE
Progger logs provides the data as we have seen in the earlier sections of this thesis. Yet, all these data needs to be stored in a database and with data collected from Progger increasing as machines are added to the network, a suitable database is required for data recording and storage purposes. This fast data increase is due to how the kernel handles system calls.
3.1
C
OMPARING ANDU
NDERSTANDINGD
IFFERENTD
ATABASESFor this thesis we had analysed several database management systems, such as MySQL, CouchDB, MongoDB, and Hadoop (HBase and Hive). All types of database have advantages and disadvantages such as processing speed, data capacity, and compatibility with designated applications. However, choosing the right database system for this thesis is very important. The reason for this choose is based on several aspects of how valuable the data is. Such reasons are:
Scalability of data size
Availability of the data when needed
Accessibility of data when needed
Security of data storage and handling.
Importance of Data content
We will now provide an analysis for the five different database systems from both SQL and NoSQL schemes. Table 3.1 provides the details of these various database systems.
46
DATABASE STORAGE ANALYSIS
CouchDB MySQL MongoDB HBase Hive
Affordable √ √ √ √ √ Consistency √ √ √ √ √ Compression √ √ √ √ Fault-tolerance √ √ √ Normalize √ √ Map/Reduce √ √ √ √ Scalable √ √ √ √ Real-Time Read/Write Access √ √ √ √ √ High Performance √ √ √ √ Replication √ √ √ √ Open Source √ √ √ √ User-centric √ √ √ Database Model Document Store Relational DBMS Document Store Wide Column Stored Relational DBMS
Table 3.1. A comparison between the database systems [3] [50] [60] [61].
Table 3.1 shows the comparisons between MySQL and the NoSQL databases. We see that MySQL performs faster with small and medium sizes of datasets, and not big datasets. With small and medium sizes of data, there is reliability and good table, column, and row management which allows less duplication of records, conflicts and invalid transactions. However, with MySQL, data scalability, single server performance and strict schema design are the issue when the data size grows [3]. Comparing that to the NoSQL databases, we notice that, performance and scalability is not an issue. However, it is just other features that change. For example, CouchDB performs the best when it comes to “peer-to-peer” replication, either in a
local network or even over the cloud [3] [61]. MongoDB has weaker replication but offers full consistency, high performance and allows extensive uses of memory-mapped files, i.e. read/write – through memory caching [3] [60]. Finally, Hadoop – Hive and HBase offers all the above features mentioned for NoSQL databases but has a unique feature. It is user-friendly. It is pre-packaged in a virtual Image environment ready for use. It offers a web interface access, and it is in a “plug and play” state, with such features such as:
Ambari – Dashboard
Hive - Database System
HBase – Database system
Pig – Scripting language
With the above analysis, this thesis chooses to implement Hadoop-Hive over the other database systems.
3.2
P
ROCESSINGL
ARGED
ATASETSIn this section of the thesis, we will provide two database installation modules. These databases are MySQL and Hadoop – Hive databases. We begin by stating the required components of the two setups, and their functions in the database storage systems. Secondly, we will provide the proposed Hadoop – Apache Hive database system design. Since this section of the thesis covers the design of processing of large datasets, we will provide further analysis to the database storage setups, speed, and performance in Chapter 7 – Evaluation, of this thesis. We will begin with MySQL and later provide information for the Hadoop – Hive databases.
3.2.1 SETUP1 - MYSQL DATABASE AND STORAGE
MySQL database due to its popularity became a choice for the storage of Progger logs. The installation of MySQL is on a windows environment, and it has a windows web development tool that is installed to manage the overall process and operations. There are several options to install MySQL in a windows environment such as XAMP and WampServer. In this thesis, we have implemented WampServer (64BITS & PHP 5.5) 2.5 to manage MySQL and other related services like Apache.
48
3.2.1.1 WampServer
The WampServer is a windows web development environment for Apache, MySQL, and PHP [79]. It allows the user to create web applications with PHP, Apache and MySQL database on windows. In addition, it has another component called “PhpMyadmin” which gives access to the user to manage the databases. Overall, WampServer is a windows web development environment that has the functionalities of a server, and manages Apache, PHP and MySQL.
In order for Apache, PHP and MySQL to work, one has to download and install
WampServer 2.5 from the website: http://www.wampserver.com/en/ . Upon
completion of download, the installation process should begin on your windows Machine. The installation process consists of installing Apache, PHP and PhpMyAdmin.
3.2.1.2 PhpMyAdmin
PhpMyAdmin is a software tool that provides a web access/interface to MySQL and allows the user to manage to your database. All database are creating using phpMyAdmin web access. To access the phpMyAdmin page, the user has to
access it using the localhost address: http://localhost/phpmyadmin/ .
In order to start using this service and start storing data, the user has to create a new database, tables and load the data into the Database. Figure 3.1 shows the “phpMyAdmin” interface with a database created (proggerdb) and a list of tables which contains the Progger data. Because, the Progger data is big, “views” are
created in the database to handle faster performance. (Refer to Appendices F.1 to
further understand the configuration of phpMyAdmin.)
The main features of phpMyAdmin are creating the databases and tables to handle data. PhpMyAdmin also offers ‘view’ and ‘queries’ to handle data processing and performance purposes. Which processing of data can be done within
‘phpMyAdmin’ a connection is required to connect the phpMyAdmin database to the front-end API. This can be done using several methods, however for this thesis a ‘php script’ is written to facilitate the connection between the database and the front-end API.
Figure 3.1. A snapshot of phpmyAdmin database system.
3.3
S
ETUP2
-
A
PACHEH
ADOOP-
D
ATABASE ANDS
TORAGEThe other setup we have modelled is Hadoop – Hive/HBase framework. The advantage of implementing Hadoop over MySQL is, all features are wrapped into one virtual machine image.
3.3.1 Hortonworks Sandbox 2.1
The Hadoop environment uses the foundational platform of Hortonworks Sandbox 2.1, i.e. a single node implementation of the Hortonworks Data Platform (HDP). It is wrapped as a virtual machine to allow fast and easy experimentation with the Hortonworks Data Platform (HDP) [34]. It can be easily imported into a virtualization environment for quick implementation.
3.3.2 Why Hadoop and Hive/HBase?
The components of Hadoop are:
Hadoop Distribution File System (HDFS)
MapReduce
Progger Database
50
The advantages of implementing Hadoop over the other evaluated Databases is that
Hadoop is affordable, reliable and provides scalability. It also contains chain of tools intended to solve big data problems. It has the ability to
process big amount of data irrespective of the data structure and provides data motion to numerous applications. The Hadoop components acts as the basis of the Hadoop cluster and manages how datasets are stored in the Hadoop cluster. It allows a user to store, process, and analyse large volumes of data [34].
Figure 3.2. A Hadoop structure with its core components [33] [34].
Data storage is the important aspect and core function for any Database systems. The HDFS in Hadoop is responsible for storing data in chunks (by splitting into blocks of 64mb each). This allows Hadoop to have a better advantage over the other databases previously mentioned. We now look at the Hadoop modules that handle the data storage tasks and briefly describe their functions.
3.4
C
OMPONENTS OFH
ADOOP USED FORP
ROCESSINGL
ARGED
ATASETS3.4.1 Ambari
The Hadoop Ambari is web-based front-end that acts as the management and monitoring interface for the whole Hadoop framework [80]. It provides are dashboard to view and access the modules. It links up all the modules together such as Hive, Pig, HBase, HCatalog, Zookeeper, Oozie, and Sqooq. Another useful feature for Ambari is, it provides support for Hadoop HDFS and Hadoop MapReduce. For the case of this thesis, much of our concentration are on Hive, Hbase, Pig and Hcatalog.
3.4.2 Hive
Hive is a module of the Hortonworks Data Platform (HDP) which provides a SQL-like interface purposely to store data in Apache Hadoop [80]. It shares similar tasks to HBase, however has its own advantages. For example, Hive is considered user-friendly and familiar to users who are SQL-like for querying data.one can conclude that Hive is the user-centric option compared to the HBase.
3.4.3 HBase
HBase, like Ambari, is part of the Hadoop distributed database that maintains a structured data storage for large table. It is a module based on top of the HDFS. It is an open-source, distributed and column-oriented store modelled after Google’ Bigtable [3] [80].
3.4.4 Pig
Pig which works alongside HBase, is scripting language with the primary focus on dataflow. It runs on Hadoop and uses MapReduce and the HDFS. It is a high level data-flow language for parallel computation and it is design for executing long series of data operations [80]. Pig has the following features [10]:
Extensible
Easy to program
52
3.5
H
ADOOP–
H
IVED
ATABASED
ESIGNNow that we have understand all the Hadoop components and their functions, let’s look at the proposed Database design. Figure 3.3 shows the Hadoop- Hive database design.
Figure 3.3. The Hadoop – Hive database design.
With such main features (user-centric), Hadoop became the choice for this thesis in terms of database and storage. All database, tables, queries and scripts are created using Hadoop and managed by Hadoop via Hortonworks 2.2sandbox. All databases are created in Hive and are channelled using Pig and Php scripts to the front-end for processing and visualization. (Refer to Appendix F.2 for the related Hadoop installations files and snapshots)
While analysing and testing out the two database installation options (MySQL and Hadoop – Hive), we notice that Hadoop performs faster and better than MySQL in many ways. For example, the overall installation and setup of Hadoop is easier and faster than the MySQL installation process. Performance is the main pitfall of MySQL. For example, the time it retrieve data, write data, and outputs it for visualization is slower than Hadoop. The size of the data is another factor that affects the performance of MySQL, however it does not affect Hadoop since Hadoop is built purposely for large datasets. Finally Hadoop –Hive provides a user-centric approach that is easy for anyone with little knowledge on database systems to implement.
C
HAPTER
4
D3
AND
G
ESTALT
I
NTEGRATION
D
ESIGN
4.1
D3.
JSAs previously discussed, Hadoop - Hive is needed for data storage. However, visualizing the provenance of the data stored in Hive requires a Visualization API. In this thesis we chose to use D3.js for the visualizations development. We begin this section of the thesis by understanding D3.
D3 (short for Data-Driven Documents) is a JavaScript library for manipulating documents founded on data [21]. It helps developers to bind arbitrary data to a Document Object Model (DOM) and finally applying data-driven transformations and transitions to the document to acquire visualization [21]. To use D3.js for the ‘front-end’ of the web application, there are two options:
Figure 3 Figure 4.1. A note on how to get D3.js and links [21].
Why D3.js?
D3.js is selected due to its capabilities and features that allows developers to build any data visualization framework according to their design and wants. Below are the main powerful features of D3 [17]:
Easy mapping of data to HTML elements and vice versa
Flexibility of render elements, either HTML or SVG.
Simple API:
Configuring layouts
Configuring styling
The transition API supports animations.
download D3 (d3.zip) as a package and link to your ‘front-end’ web
application
directly link to the latest online release using the script below:
<script src="http://d3js.org/d3.v3.min.js" charset= "utf-8"></script>
56
Ability to build data trees according to how users visualize the output.
With such features, D3.js attracts developers to design and develop visualizations. It also allows developers to re-use codes and add specific functions to suit the content used. Overall, D3.js allows users to interact with the front-end application making it a user-centric application.
4.2
UV
ISP’
SU
SER-C
ENTRICT
ECHNIQUEWith the foundation knowledge of D3.js and how it works, we now take a look at an important key phases of the UVisP design. This thesis refers to the key phases as the ‘UVisP’s U-C methodology.’ The methodology consists of (in an orderly manner):
1. Prior-knowledge of the Gestalt theory of perception
2. Processing of the raw data (Progger log) Type, User, Filename, FD, etc.
3. Building data-input format (.json & .csv)
4. Visualization type & animation (D3 – Library)
5. Colour Theory
Which colour selection presents each visualization How many colours to use?
Applying the colour wheel/circle (a tool for combining colours)
6. Gestalt - & - D3 Association Visualization Approach
With this U-C methodology in place, users of the UVisP technique can adopt this visualization technique to help them extract useful information and knowledge from any given visualizations. However, in order to use this visualization technique well, the user must have a full understanding of the U-C methodology presented above. Therefore we will take further describe each step of the methodology in detail for better understanding.
Referring to ‘Step 1’ of the U-C methodology, we consider looking at the meaning of ‘prior-knowledge of the Gestalt theory of perception.’ In this step, a user of the
![Figure 2.2. The visualization discovery process [10].](https://thumb-us.123doks.com/thumbv2/123dok_us/9790004.2470763/23.892.137.709.106.356/figure-the-visualization-discovery-process.webp)
![Figure 2.3. An example of a bar graph to illustrate an online survey bias – Traffic Sources [68]](https://thumb-us.123doks.com/thumbv2/123dok_us/9790004.2470763/27.892.165.681.374.686/figure-example-graph-illustrate-online-survey-traffic-sources.webp)
![Figure 2.4. An example of a tag cloud visualization of Data visualization subgroups [51]](https://thumb-us.123doks.com/thumbv2/123dok_us/9790004.2470763/28.892.176.768.148.488/figure-example-tag-cloud-visualization-data-visualization-subgroups.webp)
![Figure 2.6. An example of some patterns and possible correlation between rainfall intensity and traffic speed identified from the AnalyticaR representation [5]](https://thumb-us.123doks.com/thumbv2/123dok_us/9790004.2470763/30.892.176.692.385.824/patterns-possible-correlation-rainfall-intensity-identified-analyticar-representation.webp)
![Figure 2.7. A ‘Circle Segments’ Technique for 8-dimensional Data. Users can control the arrangement of the dimensions especially when visualizing large datasets using multiple dimensions [62]](https://thumb-us.123doks.com/thumbv2/123dok_us/9790004.2470763/31.892.146.677.93.431/segments-technique-dimensional-arrangement-dimensions-especially-visualizing-dimensions.webp)
![Figure 12.10. An example of Visualizing Provenance to show the history of relationships between daily products [78]](https://thumb-us.123doks.com/thumbv2/123dok_us/9790004.2470763/34.892.235.645.475.861/figure-example-visualizing-provenance-history-relationships-daily-products.webp)
![Figure 2.12. An illustration of the Law of Pragnanz – Good Figure, Closure (Gestalt Theory) [45]](https://thumb-us.123doks.com/thumbv2/123dok_us/9790004.2470763/38.892.283.651.185.486/figure-illustration-pragnanz-good-figure-closure-gestalt-theory.webp)
![Figure 2.13. An illustration of the Law of Common Fate (Gestalt Theory) [53].](https://thumb-us.123doks.com/thumbv2/123dok_us/9790004.2470763/39.892.232.620.423.787/figure-illustration-law-common-fate-gestalt-theory.webp)