Anomaly Detection in the Cloud using Data Density
Syed Noorulhassan Shirazi, Steven Simpson, Antonios Gouglidis, Andreas Mauthe and David Hutchison InfoLab21, School of Computing and Communications
Lancaster University,UK
Email:{n.shirazi, s.simpson, a.gouglidis, a.mauthe, d.hutchison}@lancaster.ac.uk
Abstract—Cloud computing is now extremely popular be-cause of its use of elastic resources to provide optimized, cost-effective and on-demand services. However, clouds may be subject to challenges arising from cyber attacks including DoS and malware, as well as from sheer complexity problems that manifest themselves as anomalies. Anomaly detection tech-niques are used increasingly to improve the resilience of cloud environments and indirectly reduce the cost of recovery from outages. Most anomaly detection techniques are computation-ally expensive in a cloud context, and often require problem-specific parameters to be predefined in advance, impairing their use in real-time detection. Aiming to overcome these problems, we propose a technique for anomaly detection based on data density. The density is computed recursively, so the technique is memory-less and unsupervised, and therefore suitable for real-time cloud environments. We demonstrate the efficacy of the proposed technique using an emulated dataset from a testbed, under various attack types and intensities, and in the face of VM migration. The obtained results, which include precision, recall, accuracy, F-score and G-score, show that network level attacks are detectable with high accuracy.
Keywords-Cloud security, anomaly detection I. INTRODUCTION
Cloud environments are hugely popular because they offer a range of beneficial properties, such as on-demand self-service, resource pooling, rapid elasticity and measured service, using virtualization as an enabling base technol-ogy [1]. However, they are susceptible to traditional chal-lenges including DoS attacks, malware and misconfigura-tion. In addition, cloud properties can also exacerbate these challenges in both their detection and impact, hence these challenges increase the management costs, and lead to SLA violations [2] [3]. A recent study by security-as-a-service provider Alert Logic, says that application attacks aimed at cloud deployments grew 45% over the previous year (2014) [4]. Their research is based on an analysis of one billion events during the whole of 2014 across more than 3000 of its customers.
Motivated predominantly by cost reduction, cloud en-vironments are also being used by sectors operating crit-ical services, such as safety-critcrit-ical operations (e.g., Air Traffic Control networks), critical manufacturing services (e.g., utility networks and industrial control systems), and critical real-time services (e.g., transportation and surveil-lance systems) [5]. For these critical infrastructures, there are stringent security and resilience requirements, which
are arguably higher than traditional IT services because attacks on these high-assurance IT services that support critical infrastructures could have severe implications. Con-sequently, the detection of anomalies, which can signal attacks and challenges, is a vital element of operations in clouds. The dynamic nature of cloud environments and the diverse workload patterns of the applications they run impact the detection ability of anomaly detection techniques [6]. Therefore, a technique which allows the construction, ac-cumulation, and self-learning of a dynamically evolving information model of “normality”, and which can operate in real time, would be of great value.
In our previous work [7], we investigated how intra-cloud live VM migration affects state-of-the-art anomaly detection techniques, potentially making them unreliable for services running in cloud environments. In order to quantify the im-pact of VM migration on AD techniques, and to understand their computational complexity, we developed a toolchain which provides reference implementation for six detectors based on K-means1, PCA2, Wavelet3, GMM4, SVM5 and Na¨ıve Bayesian6 techniques. Our results suggested that in some configurations challenge anomalies are missed and some configuration anomalies are wrongly classified. More-over, we noticed that the computational complexity of these techniques is high because they require complex statistical computations, as well as the storage of the complete histor-ical metrics to detect anomalous patterns. Based on these results, we argue that there is a need for robust, preferably real-time, anomaly detection for cloud environments with high degree of accuracy where migration is recognized as normal.
There exist many techniques for anomaly detection in several disciplines, and they have exhibited sufficient de-tection accuracy in a variety of scenarios, as indicated in a comprehensive survey [8]. In the context of cloud computing, a few anomaly detection techniques have been adopted and redefined [9], [10], [11], [12]. However, these approaches use complex statistical measures, lack scalability,
1https://en.wikipedia.org/wiki/K-means clustering 2https://en.wikipedia.org/wiki/Principal component analysis 3http://www.pybytes.com/pywavelets/regression/wp.html 4http://scikit-learn.org/stable/modules/mixture.html 5http://scikit-learn.org/stable/modules/svm.html 6http://scikit-learn.org/stable/modules/naive bayes.html
and often require prior knowledge of the behaviour of rele-vant patterns, making them potentially unusable in a cloud-operational context. In contrast, we propose a technique that is lightweight and aims to address the scalability needs of cloud infrastructure. We employ a data density-based technique that can easily scale as metric volume grows because it does not require storing of metrics. In addition, there is no need for prior knowledge about anomalous behaviour, so it operates unsupervised. As a result, we can detect anomalies that are not well understood (i.e., there are no prior models) or have not been experienced previously. A. State-of-the-art of Anomaly Detection in Cloud Comput-ing
The importance of anomaly detection in cloud computing is due to anomalies in data translating to important action-able information. For example, an anomalous traffic pattern could indicate the request rate for VMs suddenly increas-ing, which could eventually decrease service availability to authorized users. In general, anomaly detection is applied at various levels of cloud computing, due to its native strength in identifying unknown attacks.
Wang et al. [13] proposed the EbAT system to allow the on-line analysis of multiple metrics obtained from system-level components (e.g., CPU utilization on rack servers, memory utilization, read/write counts of the OS, etc.). The system showed potential in detection accuracy and monitor-ing scalability, but it was not evaluated in the context of adequately pragmatic cloud scenarios. Guan et al. [14] and Garfinkel et al. [15] proposed multi-level anomaly detection techniques to detect intrusions at different levels of a cloud system. The techniques appear to be rather inflexible and the application of those techniques in an operational context requires better clarification. Lee et al. [16] proposed a multi-level approach, which provided fast detection of anomalies discovered in the system logs of each guest OS. One of its disadvantages is the apparent lack of scalability, since it required increasingly more resources under high system workload. Also, it is only specific to detection in logging data.
Similarly, Dastjerdi et al. [17] proposed an approach based on mobile agents for an intrusion detection system for cloud systems. However, scalability appears to be an issue due to the high number of virtual machines that are required to be attached to the agent.
The authors in [18] instrumented a real-time adaptive anomaly detection framework that was able to detect anoma-lies through the analysis of runtime metrics using the tradi-tional two-class Support Vector Machine (SVM) algorithm. However, the main issue raised by this study was that the formulation of the two-class SVM algorithm suffered from the data imbalance problem, which affected the training phase, and consequently led to several mis-classifications of newly tested anomalies.
PREPARE [19] and DAPA [20] are two recently proposed frameworks for performance evaluation based on anomaly detection for virtualized environments. Although, their main focus is to identify SLA violations. These frameworks only address application-related issues which are manifested into performance anomalies. However, none of these approaches focus on the impact of elasticity of the cloud such as VM live migration and high volume of data due to heterogeneity of the cloud. We make an attempt to propose a technique that can work under these challenges.
In summary, and compared to prior work on cloud anomaly detection, the main contributions of the paper are as follows:
1) We present a novel, memory-less technique for anomaly detection using density, which can be used in cloud environments where metrics are monitored in large volumes and in real time.
2) We evaluate the proposed technique using emulated data captured from a cloud testbed with respect to various attack types and intensities in the face of migration. Results show that the technique is effective in detection high and low intensity network level attacks with 98% accuracy.
The remainder of this paper is organized as follows: Section II details the proposed technique for detecting anomalies. Section III presents an evaluation of the proposed technique. Section IV describes the outcomes of our analysis and discusses the results we obtained while Section V summarizes our contributions..
II. PROPOSEDTECHNIQUE
The proposed technique is based on the concept of data density introduced in [21], which uses a non-parametric Cauchy function [22] that can be updated recursively. Due to being non-parametric, only a very small amount of data— only the mean of all data samplesµk and the scalar product quantity Σk calculated at the current moment in time k— needs to be stored in memory and updated [23]. This has significant implications in a cloud-operating context since it allows theoretically an infinite amount of data (infinitely large monitoring metrics) to be processed in near real time without having to store the historical data itself.
Let all measurable physical variables form the vectorx∈ Rn be divided into several clusters. Then, the local density dΛ of clusterΛ, based on Euclidean distance, is defined as:
dΛ= 1 1 + 1 NΛ NΛ X i=1 kxk−xfΛ ik 2 (1)
whereNΛ denotes the number of data samples associated with cluster Λ. fΛ
i transforms i (identifying a vector con-tributing to the cluster) into the domain of k (identifying a vector from the complete set). In the case of anomaly
detection, xk represents the feature vector with values for the instant k. It can be shown, that this formula can be derived as an exact quantity [24]:
Dk= 1
1 +kxk−µkk2+ Σk− kµkk2
(2) where both, the mean,µk and the scalar product,Σk can be updated recursively as follows:
µk= k−1 k µk−1+ 1 kxk, µ1=x1 (3) Σk = k−1 k Σk−1+ 1 kkxkk 2,Σ 1=kx1k2 (4) The data is collected continuously, in on-line mode during the detection process. Some of the new data reinforce and confirm the information contained in the previous data. Other data, however, bring new information, which could indicate a change in operating conditions, development of an anomaly or simply a more significant change in the dynamic of the system [25]. In order to detect anomalous behaviour, the variable∆Dk is, then, calculated as follows:
∆Dk=|Dk−Dk−1| (5) where Dk is the density calculated for the current data sample xk and Dk−1 is the density calculated for the immediately previous data sample xk−1. The mean of all densities so far Dk¯ can also be calculated, and compared to indicate whether the system is in an anomalous state (indicated when Dk < Dk¯ ) or a normal state. Dk¯ is calculated as follows: ¯ Dk= k s−1 ks µDk−1+ 1 ksDk (1−∆Dk)+Dk∆Dk (6) where k counts the number of data samples which are read, and ks counts the number of time steps in which the system remains in the same status (normal/anomalous). Since the computation ofDk <Dk¯ is based entirely on the concept of data density, it is highly suitable and applicable for real-time anomaly detection in cloud environments.
III. EVALUATION
The technique is evaluated using network traces obtained from a controlled testbed resembling a cloud environment, featuring VM migration as a normal cloud operation, plus network attacks that should be regarded as anomalies. The main reason for emulating network level attacks is be-cause usually in cloud there are more end users consuming resources and this therefore increases the attack surface, which can be more damaging. The cloud can offer more computational power in the form of virtual resources, to cope with additional work loads. This to some extent supports the
Algorithm 1 Proposed anomaly detection technique
1: Letx1 be the first feature vector;
2: LetS= 0; (normal state)
3: Letk= 1; 4: LetDk = 1.0; 5: LetDk¯ =Dk; 6: Letµk =xk; 7: LetΣk=kxkk2; 8: Letc= 0;
9: whilemore vectorsdo
10: Letk=k+ 1;
11: Letxk be the next feature vector;
12: µk=update by equation 3; 13: Σk=update by equation 4; 14: Dk =update by equation 2; 15: ∆Dk =|Dk−Dk−1|; 16: ifS= 0 then 17: Dk¯ =update by equation 6; 18: Letks=ks+ 1; 19: ifDk≤Dk¯ Th1 then 20: Letc=c+ 1; 21: ifc≥Ws1 then
22: LetS= 1; (anomalous state)
23: Letks= 0; 24: end if 25: else 26: Letc= 0; 27: end if 28: else 29: D¯k = ¯Dk−1 30: Letks=ks+ 1; 31: ifDk≥Dk¯ Th2 then 32: Letc=c+ 1; 33: ifc≥Ws2 then
34: LetS= 0; (normal state)
35: Letks= 0; 36: LetDk = 1.0; 37: LetDk¯ =Dk; 38: Letµk=xk; 39: LetΣk=kxkk2; 40: end if 41: else 42: Letc= 0; 43: end if 44: end if 45: end while
attackers by enabling them to perform a loss of availability on the intended service [26].
The testbed allows the traces to be labelled with ground truth, about both the expected anomalies and the presence of a migration. Comparison of the output of a detector with
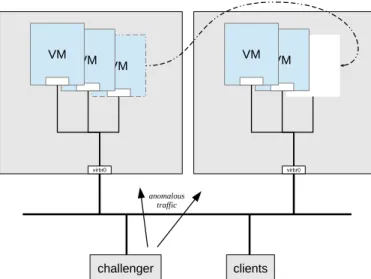
VM VM VM virbr0 VM VM virbr0 challenger clients anomalous traffic
Figure 1: Experimental setup / test-bed
ground truth allows us to determine the performance of the technique as a detector.
A. Testbed
The cloud testbed consists of two hosts which serve as compute nodes running multiple VMs, each VM running Apache HTTPd. The client host acts as a controller to initiate migrations, and also to generate background traffic. The ‘challenger’ host runs custom attack scripts to generate attack traffic directed towards the VMs’ address range for a selected attack type and intensity (i.e., the volume of traffic it generates). Tcpdump7 is used to simultaneously collect packet traces from the two virtual bridge interfaces, one in each physical node, and so these traces represent aggregated traffic to/from all VMs on a node. All are connected to a LAN, as shown in Fig. 1.
Each physical node runs KVM8 as virtualization infras-tructure, and QEMU9 provides hardware emulation. Migra-tion is achieved with libvirt10. All VMs on a node are connected to a virtual bridge interface virbr0, so their own interfaces appear to be part of the LAN.
This set-up allows experiments to be run in which the legitimate traffic of several web servers is continuously emulated, while anomalous traffic is emulated by inject-ing attack traffic into the legitimate traffic durinject-ing part of the experiment. Independently, one of the VMs running a webserver can be migrated live between the nodes during a period of either normal or anomalous traffic. Traces obtained at the virtual bridges are fed into the detector to observe its reactions to normal/anomalous traffic. Network traces are split into 1-second bins, and then a set of statistical
7Tcpdump: http://www.tcpdump.org/
8Kernel-based Virtual Machine: http://www.linux-kvm.org/ 9Quick EMUlator: http://www.qemu.org/
10The virtualization API: http://libvirt.org/libvirt2
properties (features) of the traffic in each bin is computed; each feature vector is submitted to the detector. The vector includes number of packets, number of bytes, number of active flows in each bin, entropy of source IP address distribution, entropy of destination IP address distribution, entropy of source port distribution, entropy of destination port distribution, entropy of packet size distribution. For evaluation, each vector is also labelled with ground truth about the presence of anomalies and migration. Packet traces are captured with libpcap11. Because we have control over when anomaly and migration occur, we can confidently label our obtained traces with ground truth about both conditions, and therefore assess the performance of proposed detection technique.
B. Evaluation Metrics
The single metric alone is not sufficient to make a firm conclusion about performance of underlying anomaly detection technique [27]. Therefore, we evaluated the effec-tiveness of the proposed technique using several metrics. Each input entry submitted to the detector describes the features of monitored network traffic during a given time period (bin), and the detector then computes deviation from normal traffic. Therefore, the performance can be assessed by determining the difference between the class it produces for a given input and the class it should have.
Correctly identified negatives are True Negatives (TN), incorrectly identified negatives are False Positives (FP), correctly identified positives are True Positives (TP) and incorrectly identified positives are False Negatives (FN). From this output it allows computation of thetrue-positive rate (TPR, sensitivity or recall; TP/(TP + FN)), the false-positive rate (FPR; FP/(FP + FN)), the preci-sion (TP/(TP +FP)), the accuracy (TP +TN/TP + TN + FP + FN), the F score (2× (Precision × Recall) / (Precision + Recall)), and the G mean (√Precision×Recall).
Accuracy is the degree to which the detector classifies data samples correctly; precision is a measure of how many of the positive classifications are correct, i.e. the probability that a detected anomaly has been correctly classified; and recall is a measure of the detector’s ability to correctly identify an anomaly, i.e. the probability that an anomalous sample will be correctly detected. The final two metrics are the harmonic mean (F score) and geometric mean (G mean), which provide a more rounded measure of the performance of a particular detector by accounting for all of the outcomes to some degree. The Precision and Recall are important for evaluation since there could be a possibility that some of the data instances are few in number relative to others. For example if theportscanattack represented 95% of total traffic in our captured traffic and the normal data instances
were 5%. If all the predicted instances were portscan then the overall accuracy will be 5% in spite of the lost predicted normal class of data.
C. Tuning the algorithm
The background traffic on the testbed consists of random client HTTP requests producing substantially oscillatory behaviour that could confound a detector. To overcome this, we first analyzed various experimental runs, and introduced tuning parameters with respect to the captured dataset de-tailed below:
1) In order to have more defined normality regions, the mean of density Dk¯ is recursively updated only for normal data.
2) Transition from one state to another is controlled by two tolerance thresholds Th1 and Th2 and two windowsWs1,Ws2, where;
• the detector output can only switch from normal to anomalous when Dk ≤ Dk¯ Th1 for Ws1 successive bins, and
• the detector output can only switch from anoma-lous to normal ifDk ≥D¯kTh2 for Ws2 succes-sive bins.
The windows Ws1 and Ws2 are intuitive enter/exit thresholds, which permit a good trade-off between response time and stability of the detector.
3) Once the system is back in a normal state the density of a current sample is reset back to one, i.e., Dk = 1, to mitigate the impact of current anomalous data den-sity onto subsequent data denden-sity computation. Cor-respondingly, other recorded values are reset, namely,
¯
Dk=Dk,µk=xk andΣk=kxkk2.
The coefficient (1−∆Dk) will leadDk¯ to near the actual mean of density when there is a smooth change in the data, and∆Dk will leadDk¯ to near the new value ofDk in the presence of an anomaly.
The detection technique with these modifications is shown in Algorithm 1.
IV. ANALYSIS OFRESULTS
To validate the tuning strategy, a collection of traces previously obtained from the testbed is analyzed. Each experimental run yields a pair of packet traces that are labelled with the ground truth regarding the presence of attack traffic and migration in the trace. In each 10-minute run, background traffic occurs continuously and hence ap-pears throughout the trace. After the first 5 minutes in the first run, an attack script starts, hence its traffic appears in each trace from the midpoint. At either 2.5 minutes or 7.5 minutes, a migration of one of the VMs is initiated. A run can therefore be characterised by the attack type (labelledDoSfor denial-of-service,NSfor netscan andPS for portscan) and intensity AH for high; AL for low, and
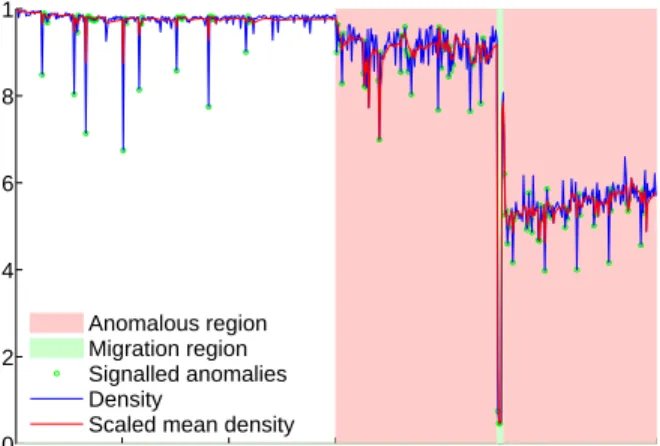
100 200 300 400 500 600 0 0.2 0.4 0.6 0.8 1 Bins Anomalous region Migration region Signalled anomalies Density
Scaled mean density
Figure 2: Before tuning
100 200 300 400 500 600 0 0.2 0.4 0.6 0.8 1 Bins Anomalous region Migration region Signalled anomalies Density
Scaled mean density
Figure 3: After tuning
whether the migration occurs during the attack (AM) or during the normal period (NM) (i.e., ‘migration overlap’). Each trace from a run can be further characterised by whether the node it was taken from experienced an outward (MDout) or inward (MDin) migration of the VM. A run is also characterised by whether the attack targets the VM that migrates (MT0) or a VM that does not (MT1). The fixed background traffic involves five VMs running identical HTTP servers. Three VMs on one physical host, and two on the other. A host external to the VM infrastructure runs HTTP clients repeatedly connecting to each VM, two per VM. We have observed an improvement in performance when detector is augmented with the additional parameters and behaviour. For example, for a high-intensity DoS attack with migration during the attack DoS-AH-AM-MT0, Fig-ure 2 shows the output of density-based detector that simply signals when normalized Dk¯ (red) drops below Dk (blue), which oscillates considerably even during the normal period.
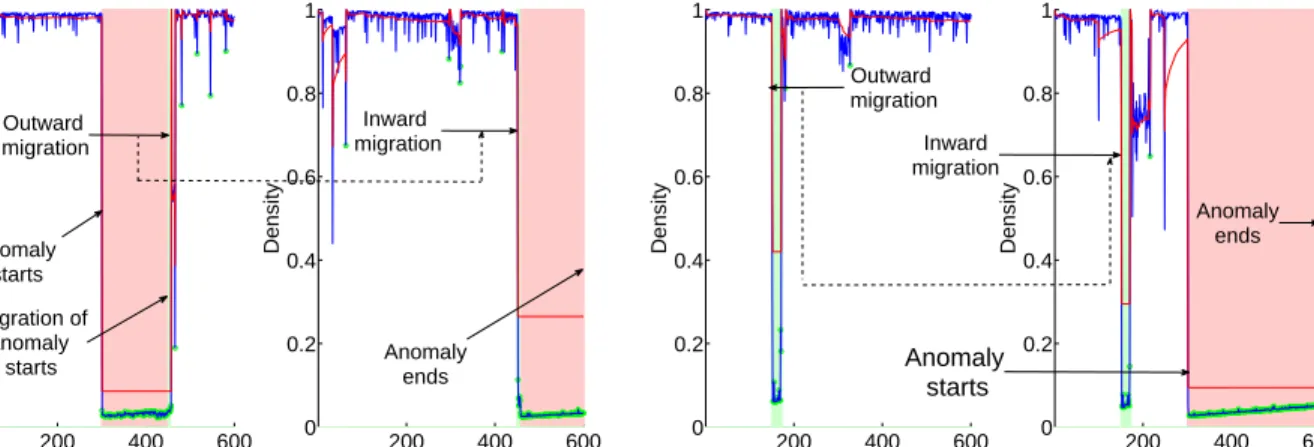
200 400 600 0 0.2 0.4 0.6 0.8 1 Bins Density DoS−AH−M1−AM−MT1−MDin 200 400 600 0 0.2 0.4 0.6 0.8 1 Bins Density DoS−AH−M1−AM−MT1−MDout Outward migration Anomaly starts Migration of anomaly starts Inward migration Anomaly ends
(a) Migration during anomalous period
200 400 600 0 0.2 0.4 0.6 0.8 1 Bins Density DoS−AH−M1−NM−MT1−MDin 200 400 600 0 0.2 0.4 0.6 0.8 1 Bins Density DoS−AH−M1−NM−MT1−MDout Inward migration Anomaly ends Outward migration Anomaly starts
(b) Migration during normal period
Figure 4: Detection results of high-intensity DoS attack
Table I: Detection results of DoS attack withMT0under high and low intensity
Scenario Recall Precision Accuracy F-score G-mean High-intensity(AH) BC0-DoS-AH-M1-AM-MT0-MDin 0.996667 0.993377 1.0000 0.996678 0.996683 BC0-DoS-AH-M1-AM-MT0-MDout 0.991653 0.993289 0.989967 0.991625 0.991626 BC0-DoS-AH-M1-NM-MT0-MDin 0.923333 0.869186 0.996667 0.928571 0.930746 BC0-DoS-AH-M1-NM-MT0-MDout 0.936561 0.887240 1.00 0.940252 0.941934 Low-intensity(AL) BC0-DoS-AL-M1-AM-MT0-MDin 0.978333 0.967427 0.990000 0.978583 0.978648 BC0-DoS-AL-M1-AM-MT0-MDout 0.988333 0.980328 0.996667 0.988430 0.988464 BC0-DoS-AL-M1-NM-MT0-MDin 0.8900 0.825000 0.990000 0.900000 0.903742 BC0-DoS-AL-M1-NM-MT0-MDout 0.948247 0.908537 0.996656 0.950558 0.951577
WithDk¯ relatively stable, many normal bins are reported as anomalies, as indicated by the green circles. In comparison, Figure 3 shows the same trace fed through the augmented density-based algorithm. The windowWs1has caused fewer normal bins to be signalled as anomalies, reducing the false-positive rate. Also, with D¯k not being updated once an anomaly has been signalled, fewer anomalous bins are signalled as normal, increasing the true-positive rate. A. Detection with Migration
Using a feature set that is capable of encapsulating changes to the volumetric properties of traffic on the network, we were able to detect Denial-of-Service (DoS) attacks on VMs using our detector with a high degree of accuracy during migration.
Figures 4a and 4b visually represent detection perfor-mance under high-intensity DoS attack with MT1 (i.e., the VM experiencing the attack is migrating) where mi-gration happens during anomalous and normal periods re-spectively. The results show that the anomalous region
precisely detected (marked by green circles) with very few false-positives13. The output of the detector was used to produce evaluation metrics according to the formulae in Section III-B.
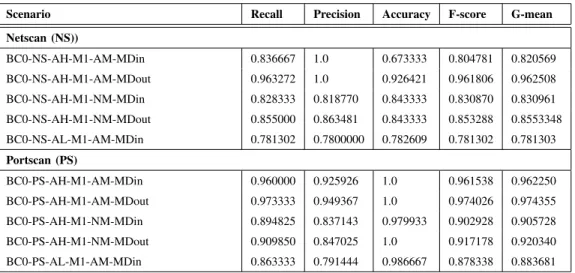
The results in Table I and Table II show that our choice of network features is appropriate and sufficient for detecting network based DoS attacks with high and low intensity. In order to aid the evaluation process, we also present detection results for netscan (NS) and portscan (PS) in Table III. The results of detection are promising, with excellent detection observed for network level attacks under various intensities. In addition, this featureset could be expanded to include statistics derived from other resources (such as vCPU usage). There is a trade-off since more computation resources will be required, but this could be beneficial in the detection of other types of anomaly.
13The overall results are the best measure of the performance of the detector and were calculated by combining the results of both components as if they had been produced by a single detector.
Table II: Detection results of DoS attack withMT1under high and low intensity
Scenario Recall Precision Accuracy F-score G-mean High-intensity(AH)
DoS-AH-M1-AM-MT1-MDin 0.991667 0967532 1.0 0.983498 0.983632
DoS-AH-M1-AM-MT1-MDout 0.978333 0.920245 1.0 0.958466 0.959294 DoS-AH-M1-NM-MT1-MDin 0.958333 0.933754 0.986667 0.959481 0.959846
DoS-AH-M1-NM-MT1-MDout 0.96500 0.0 NaN12 0.0 NaN
Low-intensity(AL)
DoS-AL-M1-AM-MT1-MDin 0.981667 0.937107 0.993333 0.964401 0.964811 DoS-AL-M1-AM-MT1-MDout 0.978297 0.925466 0.993333 0.958199 0.958799 DoS-AL-M1-NM-MT1-MDin 0.980000 0.973684 0.986667 0.980132 0.980154
DoS-AL-M1-NM-MT1-MDout 0.984975 0.0 NaN 0.0 NaN
Table III: Detection results of netscan and portscan attacks under high and low intensity
Scenario Recall Precision Accuracy F-score G-mean Netscan (NS)) BC0-NS-AH-M1-AM-MDin 0.836667 1.0 0.673333 0.804781 0.820569 BC0-NS-AH-M1-AM-MDout 0.963272 1.0 0.926421 0.961806 0.962508 BC0-NS-AH-M1-NM-MDin 0.828333 0.818770 0.843333 0.830870 0.830961 BC0-NS-AH-M1-NM-MDout 0.855000 0.863481 0.843333 0.853288 0.8553348 BC0-NS-AL-M1-AM-MDin 0.781302 0.7800000 0.782609 0.781302 0.781303 Portscan (PS) BC0-PS-AH-M1-AM-MDin 0.960000 0.925926 1.0 0.961538 0.962250 BC0-PS-AH-M1-AM-MDout 0.973333 0.949367 1.0 0.974026 0.974355 BC0-PS-AH-M1-NM-MDin 0.894825 0.837143 0.979933 0.902928 0.905728 BC0-PS-AH-M1-NM-MDout 0.909850 0.847025 1.0 0.917178 0.920340 BC0-PS-AL-M1-AM-MDin 0.863333 0.791444 0.986667 0.878338 0.883681 V. CONCLUSION
We have presented a modified anomaly detector based on the density of observed feature vectors. The modifications we made have achieved improved detection for dynami-cally evolving workload patterns without having pre-defined anomaly models. This encourages further work concerning monitoring scalablility in terms of efficiency and accuracy with cloud specific workloads.
The density computation is expressed recursively, i.e., based only on the signal at the previous step together with the latest vector. This makes the algorithm memoryless, i.e., it does not need to store historical data. The lightweight nature of this approach makes it particularly suitable for deployment in cloud environments. In particular, a detector associated with a specific VM is sufficiently lightweight to travel with the migrating VM. This is especially vaulable, as a detector that does not migrate with a VM may interpret the sudden departure or arrival of the VM as an anomaly. Cloud infrastructures will benefit from our approach because it is designed to be flexible and distributed as well as being able
to respond to new threats and challenges in real time. The cloud-specific dataset, labelled with the ground truth of migration and anomalies on which this work is based, is available on request. Our implementation of the density-based detector in Python is available online14.
ACKNOWLEDGEMENTS
This work is sponsored by the UK EPSRC via grant agreement no. EP/L026015/1: A Situation-Aware Informa-tion Infrastructure, and by the European Union via grant agreement no. 608090: Hybrid Risk Management for Utility Providers (HyRiM). We are grateful to Plamen Angelov for helping us with classification techniques and providing insightful comments and inputs.
REFERENCES
[1] P. Mell and T. Grance, “The NIST definition of cloud com-puting,” 2011.
14https://forge.comp.lancs.ac.uk/svn-repos/seccrit-internal/rde-detector/ tags/published-2015/
[2] T. Wood, E. Cecchet, K. K. Ramakrishnan, P. J. Shenoy, J. E. van der Merwe, and A. Venkataramani, “Disaster recovery as a cloud service: Economic benefits & deployment chal-lenges.”HotCloud, vol. 10, pp. 8–15, 2010.
[3] P. Bodik, M. Goldszmidt, A. Fox, D. B. Woodard, and H. Andersen, “Fingerprinting the datacenter: automated clas-sification of performance crises,” in Proceedings of the 5th European conference on Computer systems. ACM, 2010, pp. 111–124.
[4] A. Logic, “The changing state of cloud security,” Tech. Rep., 2015.
[5] S. Berman, L. Kesterson-Townes, A. Marshall, and R. Sri-vathsa, “The power of cloud. driving business model innova-tion,” IBM Institute for Business Value, Tech. Rep., 2012. [6] K. Adamova, D. Schatzmann, B. Plattner, and P. Smith,
“Network anomaly detection in the cloud: The challenges of virtual service migration,” in Communications (ICC), 2014 IEEE International Conference on. IEEE, 2014, pp. 3770– 3775.
[7] S. Shirazi, S. Simpson, A. Marnerides, M. Watson, A. Mau-the, and D. Hutchison, “Assessing the impact of intra-cloud live migration on anomaly detection,” inCloud Networking (CloudNet), 2014 IEEE 3rd International Conference on, Oct 2014, pp. 52–57.
[8] V. Chandola, A. Banerjee, and V. Kumar, “Anomaly detection: A survey,”ACM Computing Surveys (CSUR), vol. 41, no. 3, p. 15, 2009.
[9] C. Wang, K. Viswanathan, L. Choudur, V. Talwar, W. Sat-terfield, and K. Schwan, “Statistical techniques for online anomaly detection in data centers,” in Integrated Network Management (IM), 2011 IFIP/IEEE International Symposium on. IEEE, 2011, pp. 385–392.
[10] C. Wang, V. Talwar, K. Schwan, and P. Ranganathan, “Online detection of utility cloud anomalies using metric distribu-tions,” in Network Operations and Management Symposium (NOMS), 2010 IEEE. IEEE, 2010, pp. 96–103.
[11] Q. Guan and S. Fu, “Adaptive anomaly identification by ex-ploring metric subspace in cloud computing infrastructures,” in Reliable Distributed Systems (SRDS), 2013 IEEE 32nd International Symposium on. IEEE, 2013, pp. 205–214. [12] P. Bahl, R. Chandra, A. Greenberg, S. Kandula, D. A. Maltz,
and M. Zhang, “Towards highly reliable enterprise network services via inference of multi-level dependencies,” inACM SIGCOMM Computer Communication Review, vol. 37, no. 4. ACM, 2007, pp. 13–24.
[13] C. Wang, “Ebat: online methods for detecting utility cloud anomalies,” inProceedings of the 6th Middleware Doctoral Symposium. ACM, 2009, p. 4.
[14] Y. Guan and J. Bao, “A cp intrusion detection strategy on cloud computing,” in International Symposium on Web Information Systems and Applications (WISA), 2009, pp. 84– 87.
[15] T. Garfinkel, M. Rosenblumet al., “A virtual machine intro-spection based architecture for intrusion detection.” inNDSS, vol. 3, 2003, pp. 191–206.
[16] J.-H. Lee, M.-W. Park, J.-H. Eom, and T.-M. Chung, “Multi-level intrusion detection system and log management in cloud computing,” in Advanced Communication Technology (ICACT), 2011 13th International Conference on. IEEE, 2011, pp. 552–555.
[17] A. V. Dastjerdi, K. A. Bakar, and S. G. H. Tabatabaei, “Dis-tributed intrusion detection in clouds using mobile agents,” in
Advanced Engineering Computing and Applications in Sci-ences, 2009. ADVCOMP’09. Third International Conference on. IEEE, 2009, pp. 175–180.
[18] H. S. Pannu, J. Liu, and S. Fu, “Aad: Adaptive anomaly detec-tion system for cloud computing infrastructures,” inReliable Distributed Systems (SRDS), 2012 IEEE 31st Symposium on. IEEE, 2012, pp. 396–397.
[19] Y. Tan, H. Nguyen, Z. Shen, X. Gu, C. Venkatramani, and D. Rajan, “Prepare: Predictive performance anomaly preven-tion for virtualized cloud systems,” inDistributed Computing Systems (ICDCS), 2012 IEEE 32nd International Conference on. IEEE, 2012, pp. 285–294.
[20] H. Kang, X. Zhu, and J. L. Wong, “Dapa: diagnosing applica-tion performance anomalies for virtualized infrastructures,” in
Presented as part of the 2nd USENIX Workshop on Hot Topics in Management of Internet, Cloud, and Enterprise Networks and Services, 2012.
[21] P. Angelov and R. Yager, “Simplified fuzzy rule-based sys-tems using non-parametric antecedents and relative data den-sity,” in Evolving and Adaptive Intelligent Systems (EAIS), 2011 IEEE Workshop on. IEEE, 2011, pp. 62–69. [22] N. Luo and F. Qian, “Estimation of distribution algorithm
sampling under gaussian and cauchy distribution in continu-ous domain,” in Control and Automation (ICCA), 2010 8th IEEE International Conference on, June 2010, pp. 1716– 1720.
[23] P. Angelov, “An approach for fuzzy rule-base adaptation us-ing on-line clusterus-ing,”International Journal of Approximate Reasoning, vol. 35, no. 3, pp. 275–289, 2004.
[24] ——, Autonomous Learning Systems: From Data to Knowl-edge in Real Time. John Willey and Sons, 2012, vol. 1. [25] ——,Evolving rule-based models: a tool for design of flexible
adaptive systems. Springer, 2002, vol. 92.
[26] M. H. Sqalli, F. Al-Haidari, and K. Salah, “Edos-shield-a two-steps mitigation technique against edos attacks in cloud computing,” in Utility and Cloud Computing (UCC), 2011 Fourth IEEE International Conference on. IEEE, 2011, pp. 49–56.
[27] A. Lazarevic, L. Ert¨oz, V. Kumar, A. Ozgur, and J. Srivas-tava, “A comparative study of anomaly detection schemes in network intrusion detection.” inSDM. SIAM, 2003, pp. 25– 36.