The role of highly conserved non-coding DNA sequences in vertebrate
development and evolution
Parker, Hugo
The copyright of this thesis rests with the author and no quotation from it or information derived from it may be published without the prior written consent of the author
For additional information about this publication click this link. http://qmro.qmul.ac.uk/jspui/handle/123456789/1267
Information about this research object was correct at the time of download; we occasionally make corrections to records, please therefore check the published record when citing. For more information contact [email protected]
i
The role of highly conserved non-coding DNA sequences in
vertebrate development and evolution
Hugo Parker
School of Biological and Chemical Sciences Queen Mary, University of London
September 2010
A dissertation submitted for the degree of Doctor of Philosophy
ii Declaration
This dissertation is submitted for the degree of Doctor of Philosophy at the University of London.
This dissertation is the result of my own work and includes nothing which is the outcome of work done in collaboration except where specifically indicated.
No part of this dissertation is being submitted for any other qualification or at any other university.
Hugo Parker September 2010
iii Acknowledgements
Thanks to my supervisor Greg Elgar for support and guidance. Thanks to members of the Elgar and Bronner-Fraser labs for friendship and advice. Thanks to Paul for the bio-informatics help and to Stefan, Debs, Emma and Heather for molecular biology and embryology advice. Thanks to Heather for maintaining the fishes. Thanks to Tatjana, Marianne, Natalya, Marcos, Benji, Jeremiah and Melinda for lamprey expertise. Thanks to QMUL SBCS for funding this thesis. Thanks to my friends. Special thanks to my parents for love and support.
iv Abbreviations
2R two rounds of whole genome duplication A-P anterior-posterior
BBR Boehringers blocking reagent bHLH basic helix-loop-helix
bp base pairs
CNE conserved non-coding element CNS central nervous system
CRM cis-regulatory module
dCNE duplicated conserved non-coding element DDW double distilled water
DEPC diethylpyrocharbonate
EB Enhancer Browser
EM embryo medium
EM-PTU embryo medium with PTU F0 parental generation
F1 first filial generation GFP green fluorescent protein GRN gene regulatory network
HD homeo-domain
hpf hours post fertilisation kb kilo base pairs
MABT maleic acid buffer with tween MMR Marc‟s modified Ringer‟s solution MYA million years ago
PBS phosphate buffered saline PFM position frequency matrix PG paralogy group (hox genes) PTU phenolthiourea
PTW phosphate buffered saline with tween PWM position weight matrix
r rhombomere
RA retinoic acid
v
RT room temperature
TF transcription factor
TFBS transcription factor binding site UCE ultra-conserved element
vi Summary
Comparisons between vertebrate genome sequences, from mammals to fishes, have revealed thousands of conserved non-coding elements (CNEs) that are associated with developmental genes. Interestingly, the vast majority of these CNEs cannot be found in invertebrate genomes by sequence homology. As many CNEs have been demonstrated to act as enhancers in-vivo, it has been postulated that CNEs represent gene regulatory elements with crucial roles in aspects of development that are shared between vertebrates.
To trace the evolution of CNE sequences in vertebrates, a preliminary search for CNEs in the lamprey genome was conducted using the draft lamprey genome sequence. This thesis documents how the CNEs identified in lamprey have been used as a guide to ask questions about the function and evolution of CNEs in the vertebrate lineage. Through the combined use of comparative genomics and developmental biology techniques, including a newly developed reporter assay for sea lamprey embryos, crucial first steps have been taken toward systematically de-coding these ancient gene regulatory elements. Special attention is paid toward utilising the low sequence identity of lamprey CNEs for „phylogenetic footprinting‟, an approach which uncovers striking enrichment of CNEs for a set of motifs that are characteristic of Hox-regulated elements. These findings help to establish CNEs within a developmental and evolutionary context.
vii Contents
1 Introduction 1
Evolutionary developmental biology 1
Identifying cis-regulatory elements through genomics approaches 4 Conserved non-coding elements between mammal and teleost genomes 5
The gene-regulatory function of CNEs 6
The evolution of CNEs 7
The sea lamprey as a model for investigating the evolution of vertebrate 9 CNEs
Thesis overview 10
2 Materials and Methods 11
Materials 11
Fish embryo reagents 11
In-situ reagents 12
Methods 14
Molecular biology protocols 14
Fish embryo protocols 17
Zebrafish transgenesis 17
Lamprey transgenesis 19
In-situ hybridisation on lamprey embryos 22
3 CNEs in the Sea Lamprey Genome 25
Abstract 25
Introduction 25
Results 26
Identification of CNEs from the lamprey whole genome shotgun 26 sequence
Analysis of a contiguous region of the lamprey genome that contains 29 CNEs
Functional conservation of lamprey CNEs 30
Comparison of sequence divergence between ancient orthologous 34 CNEs and between dCNEs
viii
Discussion 36
Identifying ancient vertebrate CNEs using the sea lamprey genomic 36 sequence
The gene-regulatory role of ancient vertebrate CNEs 37
Conclusion 38
4 Functional Conservation of Lamprey CNEs 40
Abstract 40
Introduction 40
Results 42
Multiple alignment of the c15orf41 genomic region from vertebrates 42 Functional conservation between zebrafish and lamprey CNEs 43
Functional investigation of intron 5-6 45
Functional investigation of CNE 3286 47
Functional investigation of intron 7-8 48
Discussion 50
Conservation of sequence and function in lamprey CNEs 50 Non-conserved lamprey sequences can function in zebrafish 51 Conservation of function despite sequence divergence between 52 gnathostome and lamprey enhancers
Conclusion 54
5 Pbx-Hox Motifs in CNEs 55
Abstract 55
Introduction 55
Identifying TFBSs within CNEs 55
Regulation by Hox factors through the Pbx-Hox TFBS motif 57
Results 58
CNEs from the C15orf41 contig drive expression in the nervous system, 58 especially in the hindbrain
CNEs from the C15orf41 contig contain conserved Pbx-Hox and Meis 61 TFBS motifs
An in-silico search for conserved Pbx-Hox motifs in CNEs 62 Pbx-Hox motif hits identified in gnathostome CNEs strongly resemble 64 Pbx-Hox binding sites identified in the literature
ix Pbx-Hox motifs are enriched within other sets of vertebrate CNEs 65 CNEs with Pbx-Hox motifs frequently drive reporter expression in the 68 hindbrain and pharyngeal arches
CNEs with Pbx-Hox motifs are associated with genes that are likely to 70 be regulated by Hox factors
Genes with Pbx-Hox +ve CNEs overlap with characterised Hox targets 72 in r4
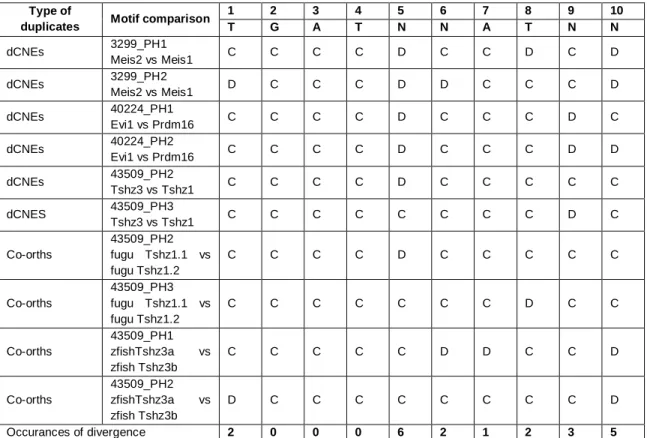
CNEs with Pbx-Hox motifs contain other relevant TFBS motifs 73 Pbx-Hox motifs are retained between duplicated CNEs 75
Discussion 80
CNEs of the C15orf41 contig 80
Identification of motifs in CNEs 82
Pbx-Hox motif association with hindbrain and pharyngeal arch expression 84 A gene regulatory network for hindbrain patterning is conserved across 86 vertebrates
Mechanism of CNE action 87
Patterns of evolution of duplicated CNEs 88
The role of Pbx-Hox +ve CNEs in vertebrate evolution 90
Conclusion 91
6 Development of a Lamprey Reporter Assay 92
Abstract 92
Introduction 92
Do CNEs drive conserved expression patterns across lineages? 92
The utility of a lamprey reporter assay 95
Results 95
Discussion 103
Development of a reporter assay in lamprey embryos 103 Conservation and divergence of CNE function between lamprey and 104 zebrafish
Evolution of the vertebrate hindbrain GRN 106
Conclusion 109
7 de-novo Motif Discovery in CNEs 110
x
Introduction 110
Results 112
CisFinder identifies Pbx-Hox motifs in CNEs 112
CNEs contain enriched motifs besides Pbx-Hox 114 Pbx-Hox and Oct motifs associate with different gene regions 119 Motifs enriched in ciona CNEs show little overlap with those of 121 vertebrate CNEs
Discussion 123
de-novo tools can identify enriched motifs in CNEs 123
Combinatorial transcriptional regulation 124
ciona CNE motifs do not overlap with those of vertebrate CNEs 126
Conclusion 128
8 Discussion 130
CNEs and gene regulation 130
CNEs and evo-devo 133
References 137
Appendix 151
xi List of tables
3.1. CNEs from 13 human gene regions identified in the Fugu and lamprey genomes.
5.1. Enrichment for Pbx-Hox motifs in different CNE sets and control sequence sets.
5.2. Distribution of Pbx-Hox +ve CNEs across Condor gene regions. 5.3. Conservation of Pbx-Hox motifs between duplicated CNEs. 6.1. A comparison of lamprey transgenesis methods.
7.1. Comparison of the distribution of 561 Pbx-Hox and 389 Oct motif hits across gene regions in the human CNE set.
A1. A list of gene regions with lamprey CNEs.
A2. The number of Pbx-Hox motif hits in the CNEs of each gene region.
28 67 71 77 99 120 151 154
xii List of Figures
1.1. A model of transcriptional regulation by transcription factors. 1.2. A phylogeny of the major vertebrate groups.
2.1. The megaprimer PCR method for site-directed mutagenesis. 2.2. Map of the cfos-IsceI-EGFP plasmid.
3.1. Conservation of non-coding sequences across the meis2/c15orf41 locus in vertebrates.
3.2. Schematic representations of GFP expression patterns driven by core CNEs.
3.3. Up-regulation of GFP by orthologous lamprey and human CNEs. 3.4. Sequence overlap between gnathostome and lamprey CNEs and
dCNEs.
4.1. Multiple alignment of the genomic region containing the gene C15orf41.
4.2. Patterns of GFP expression driven by orthologous zebrafish and lamprey meis2 CNEs.
4.3. The enhancer function of C15orf41 intron 5-6 is conserved between gnathostomes but not in lamprey.
4.4. CNE 3286 provides evidence for functional conservation despite sequence divergence between gnathostomes and lamprey.
4.5. Lamprey sequences within intron7-8 act as tissue specific enhancers in zebrafish.
4.6. Lamprey enhancers and zebrafish CNEs of intron 7-8 drove tissue specific expression in zebrafish embryos.
5.1. Reporter expression driven by CNEs of the C15orf41 contig.
5.2. Pbx-Hox motifs are essential for enhancer activity of meis2_3299 and meis2_3285.
5.3. Conserved Pbx-Hox and Meis motifs within lamprey CNEs. 5.4. Frequency logos representing different sets of Pbx-Hox motifs. 5.5. Pbx-Hox motifs predict segment-specific hindbrain and pharyngeal
arch reporter expression.
5.6. The lamprey CNE NR2F2_27254 contains conserved NR2F1 motifs. 5.7. Patterns of retention of Pbx-Hox and Meis motifs between dCNEs I. 5.8. Patterns of retention of Pbx-Hox and Meis motifs between dCNEs II.
2 9 15 21 30 32 34 35 43 44 46 48 49 50 59 62 64 65 69 74 78 79
xiii List of figures continued
5.9. Patterns of retention of Pbx-Hox and Meis motifs between co-orthologous CNEs.
6.1. Development of a reporter assay in lamprey embryos.
6.2. Comparison of GFP expression driven by CNE 3285 in lamprey and zebrafish embryos.
6.3. Comparison of GFP expression driven by CNE 3299 in lamprey and zebrafish embryos.
6.4. Hypothetical scenario for the evolution of the gnathostome hindbrain, with reference to patterns of CNE conservation in the chordate lineage.
7.1. CisFinder identifies an enriched motif that closely resembles the Pbx-Hox motif in a set of gnathostome CNEs.
7.2. CisFinder identifies enriched motifs within human CNEs.
7.3. Enriched motifs within human-shark CNEs as identified by CisFinder.
7.4. Motifs enriched within ciona CNEs, as identified by CisFinder. A.1. Multiple sequence alignment of CNE 3285-6.
80 98 101 102 108 113 115 118 122 152
xiv Chapter contributions
Specific contributions of collaborators are described in detail in the text within each chapter where necessary.
Chapter 3
The research described in this chapter was published in:
McEwen GK, Goode DK, Parker HJ, Woolfe A, Callaway H, Elgar G. (2009). Early evolution of conserved regulatory sequences associated with development in vertebrates. PLoS Genet. 5: e1000762.
McEwen GK, Woolfe A, Elgar G and Piccinelli P contributed to the bio-informatic analyses and Goode DK to the functional analyses. Goode DK contributed to the figures.
Chapter 5
Piccinelli P and Elgar G contributed to the bio-informatic analyses.
Chapter 7
1
1
Introduction
Evolutionary developmental biology
Animal taxa with diverse morphologies have arisen from a common ancestor by the process of evolution. Any explanation of how morphological evolution has occurred (and continues to occur) must address the changes in development that underlie heritable morphological changes. This is the aim of evolutionary developmental biology (Evo-Devo). In order to elucidate the developmental changes that led to evolutionary transitions, the mechanism of development must be understood at a molecular level. This mechanism must explain how a single cell can give rise to a multi-cellular organism composed of heterogeneous tissues. It is clear that simple asymmetries of the expression of early developmental genes can give rise to complex expression patterns of genes later in development, directing different tissues to be produced in different positions. Early developmental genes achieve this by regulating, via the proteins they encode, the transcription of other developmental genes, which are themselves regulators of other genes (Carroll, 2000; Levine & Tjian, 2003). This regulation ultimately depends upon transcription factors (TFs), which are proteins that bind to DNA in a sequence-specific manner at transcription factor binding sites (TFBSs) in the genomic vicinity of their target gene. In this model, TFs associated with binding sites in the genes promoter region directly influence the formation of the transcription initiation complex. Transcription of the gene is also strongly influenced by TFs binding to more distal regulatory elements, which also regulate the formation of the transcription initiation complex, either enhancing its formation, repressing it, or insulating the promoter from enhancers associated with other nearby genes (Kadonaga, 2004) (Figure 1.1). The proximity of distal regulatory elements to their genes promoter can vary widely between different elements, with some having a range of influence of several megabases (Vavouri et al., 2006).
The combinatorial regulation of a gene by many TFs makes that gene tightly regulated, only being expressed in areas of the developing organism where the right combination of TFs is present, enabling that gene to have a complex expression pattern. Clusters of TFBSs have been termed „cis-regulatory modules‟ (CRMs) (Howard & Davidson, 2004) (Figure 1.1), and are a feature of all genes. Indeed, a gene can be regulated through the action of multiple CRMs, each able to act independently to drive expression
2 of their target gene in complementary domains of the developing embryo (Arnone & Davidson, 1997).
Figure 1.1. A model of transcriptional regulation by transcription factors. Transcription factors, represented by blue, green or purple shapes associating with TFBSs regulate the formation of the transcription initiation complex (blue circles). CRM: cis -regulatory module. Figure adapted from Wasserman & Sandelin (2004).
Complex sets of expression cascades resulting from genes regulating the expression of other genes can be represented in the form of hierarchical gene regulatory networks (GRNs) (Levine & Davidson, 2005), several of which have been well characterised for particular developmental pathways in invertebrates through large scale gene perturbation analyses (e.g. Davidson et al., 2002; Shi et al., 2005). An increasing number of GRNs are now being characterised in vertebrates (e.g. Sauka-Spengler & Bronner-Fraser, 2008; Alexander et al., 2009; Morley et al., 2009). The characterisation of GRNs is a powerful approach for investigating developmental processes (Davidson, 2006). Further, GRNs can provide insights into evolutionary mechanisms, as the evolution of body plans can be viewed as being the result of inherited changes in the architecture of GRNs (Davidson & Erwin, 2006; Hinman & Davidson, 2007; Erwin & Davidson, 2009).
It has been posited that the GRNs of early metazoa were relatively simple and plastic, with changes in these networks giving rise to different animal lineages. The diverging
3 core networks then became impervious to major changes as they increased in complexity, resulting in taxa of animals that have distinct body plans between groups but conserved body plans within groups (e.g. phyla) (Davidson, 2006). Thus, the GRNs of animals from different phyla are expected to be similar in architectural principles, but different in terms of the specific components making up that architecture, whereas the GRNs of different species from the same phyla are expected to be mostly identical in their core regions, with changes predominantly at the external network levels (Davidson & Erwin, 2006). In order for us to construct GRNs, the developmental genes in the network, and their interactions with each other, must be characterised. The identification and characterisation of CRMs that regulate these genes is a crucial aspect of inferring GRNs, as these modules represent direct regulatory links between the components of the network.
Great advances have been made in annotating gene sequences within genomes; unfortunately the identification of regulatory elements is less easy. The importance of identifying these regulatory elements is highlighted by the prediction that the human genome contains 25-30,000 genes, which is only modestly more than the genome of the morphologically „simple‟ nematode C. elegans (~19,000) (Hahn & Wray, 2002). Not only do metazoan genomes contain similar numbers of genes, they also share many gene families. There are some cases in which pairs of distant orthologous genes have been demonstrated to be functionally equivalent when substituted between hosts, suggesting that the biochemical properties of their proteins and their interactions with other factors have changed little between distantly related species (e.g. Hox factors: Malicki et al., 1990; McGinnis et al., 1990; Pax6: Halder et al., 1995). This has led to the hypothesis that changes in regulatory complexity underlie the evolution of more complex body plans (Carroll, 2008). However, it is not clear to what extent inter-clade functional equivalence is a common feature of ancient orthologous transcription factors. Furthermore, clade-specific expansions of transcription factor repertoires have occurred during metazoan divergence, such as KRAB-associated zinc finger genes in tetrapods (Huntley et al., 2006), so the developmental gene „toolkits‟ of animal clades are similar but not identical. There is empirical evidence for the contribution of mutations both in genes and cis-regulatory elements to morphological evolution. Interestingly, the examples of mutations in genes predominantly concern those with single roles in development, such as those influencing colouration (e.g. Protas et al., 2006). Whilst the list of examples is not extensive enough to be conclusive, this is in line with the
4 prediction that mutations giving rise to negative pleiotropic effects, such as those in genes with multiple developmental roles, would reduce organismal fitness and thus be unable to contribute to morphological evolution. Conversely, mutations in cis -regulatory elements and in genes with single roles in development would be less likely to have negative pleiotropic effects and could therefore provide variation that could be positively selected. Taken together, there is a strong theoretical and empirical basis underlying the notion that cis-regulatory changes have played an important role in morphological evolution, whilst the relative significance of genic versus regulatory changes is still a matter for debate. Thus, identifying the regulatory elements of developmental genes in vertebrates is a crucial step toward elucidating the genetic changes underlying the evolution of the vertebrate body plan and characterising vertebrate GRNs.
Identifying cis-regulatory elements through genomics approaches
Traditionally, cis-regulatory elements have been identified by deletion analysis of genomic sequences near the gene of interest, followed by testing fragments by reporter assay (Pennacchio & Rubin, 2001). A wide range of computational tools for TFBS and CRM prediction have been developed for searching genomic sequences (e.g. Berman et al., 2002; Ho Sui et al., 2007), yet the success of these methods is limited by the fact that many binding sites are short sequences (5-10bp) so performing searches on large vertebrate genomes is likely to falsely identify many binding sites by chance (Wasserman & Sandelin, 2004). Furthermore, these approaches often require prior knowledge of the TFBSs to be searched for, restricting the discovery of CRMs composed of novel TFBSs. The availability of genomic sequences of many different species enables searching for homologous regions between species that may harbour regulatory elements; a technique termed „phylogenetic footprinting‟ (Wasserman et al., 2000). The assumption is that essential CRMs will be conserved by negative selection, so will be identifiable as non-coding sequences conserved between divergent species.
Alignments of whole vertebrate genomes have revealed numerous highly conserved non-coding regions of considerable length (>100 bp). For example, whole-genome human-mouse alignments identified more than 300,000 conserved non-coding elements of 70% identity over at least 100 bp, which are uniformly distributed throughout the genome (Dermitzakis et al., 2003). Many conserved elements show evidence of
5 sequence constraint through purifying selection, rather than a low mutation rate, which suggests that they have functional roles (Drake et al., 2005; Lunter et al., 2006). Putative cis-regulatory elements can be validated by in-vivo experiments using reporter constructs (e.g. Muller et al, 2002), but current methods of testing elements for regulatory function are relatively slow, making it unfeasible to test such a high number of sequences. In some cases, deletion of large regions containing many conserved non-coding elements had little phenotypic effect (Nobrega et al., 2004). Thus, it is unclear what the functions of many of these human-mouse conserved sequences are. Approaches to filter out smaller sets of sequences with high regulatory potential include searching for elements with more strict conservation parameters (e.g. Bejerano et al., 2004) and searching for conservation between multiple and more divergent species (e.g. Woolfe et al. 2005, Pennacchio et al., 2006).
Conserved non-coding elements between mammal and teleost genomes
A whole-genome comparison between human and the Japanese pufferfish, Fugu rubripes (Fugu), identified nearly 1,400 highly conserved sequences of at least 100 bp in length that had little or no evidence of transcription (Woolfe et al., 2005). The mean length of the conserved sequences was 199 bp with a mean identity of 84%; considerably higher than the mean level of coding-sequence identity between the two organisms. The sequences were called „conserved non-coding elements‟ (CNEs), a term which has subsequently been used to refer to all non-coding sequences conserved between distant organisms, not just to this set of sequences. These human-Fugu CNEs have been retained in their host genomes more-or-less unchanged since the divergence of lobe-finned and ray-finned fish roughly 450 MYA. The majority of CNEs were also found to be conserved in other vertebrate genomes, namely rat, chicken and zebrafish, indicating that they are probably common to all bony vertebrates. More sensitive searches involving multiple species alignments have increased the number of identified CNEs conserved between human and Fugu to about 6,000 (Woolfe et al., 2007). Searching the invertebrate whole-genome sequences of a urochordate: Ciona intestinalis, fly: Drosophila melanogaster, and a nematode worm: Caenorhabditis elegans, for sequence identity with the vertebrate CNEs revealed no significant matches, suggesting the majority of these sequences to be conserved only within the vertebrate lineage. The distribution of CNEs was found to be highly clustered around genes involved in transcriptional regulation and development (termed „trans-dev‟
6 genes). This association of mammal-fish CNEs with trans-dev genes has been confirmed by a number of other studies (Sandelin et al., 2004; Sironi et al., 2005; Ovcharenko et al., 2005).
Although most of the CNEs within the human genome appear to be unrelated to each other, 124 families of two to five duplicated CNEs (dCNEs) were identified, which were proposed to have arisen through at least one ancient whole-genome duplication early in vertebrate evolution (McEwen et al., 2006). For the majority of these families, a set of paralogous genes could be assigned, removing much of the ambiguity involved in identifying the specific genes associated with CNEs. This also enabled confident measurements of the enhancer range of these dCNEs to be made, revealing that half of the dCNEs were situated more than 250 kb upstream of their target gene‟s promoter (Vavouri et al., 2006).
The gene-regulatory function of CNEs
The gene-regulatory ability of an increasingly high number of CNEs has been confirmed through testing them for enhancer activity by reporter assay in zebrafish (Woolfe et al., 2005; Kikuta et al., 2007), frog (de la Calle-Mustienes et al., 2005) and mouse embryos (Pennacchio et al., 2006). CNEs often show reproducible enhancer activity, with spacio-temporal expression patterns generally reflecting the endogenous expression domains of their nearby trans-dev gene. The significance of CNEs for normal development is not always clear (Ahituv et al., 2007), but crucial roles for many CNEs in development have been inferred through identification of genetic diseases arising from mutation or deletion of CNEs (Lettice et al., 2003; Visel et al., 2009; Ragvin et al., 2010).
These data support the proposal that CNEs represent highly conserved CRMs. However, the conventional wisdom regarding TFs is that their interactions with binding sites show high levels of degeneracy (Sandelin & Wasserman, 2004), leading to the suggestion that CNEs are composed of multiple, tightly arranged TFBSs, with small sequence changes having deleterious effects on the binding of TF complexes to the CNE sequence (Elgar & Vavouri, 2008). It is likely that many vertebrate CRMs with conserved and important roles in development will not necessarily be found as CNEs, due to their operation through less sequence-restrictive mechanisms. Thus, CNEs may represent only a subset
7 of functionally conserved developmental cis-regulatory elements. A key issue is to what extent this set of elements operates through mechanisms that have been characterised for other, less well conserved CRMs.
The binding specificities of TFs can be inferred through in-vitro binding assays, which produce a set of similar sequences to which a given TF can strongly bind. These sequences can be aligned to calculate a position frequency matrix (PFM) (Stormo & Fields, 1998), which tabulates the frequency at which each nucleotide (A T G or C) is found for each position of the alignment. PFMs are converted into position weight matrices (PWMs) by weighting each base according to its average frequency in a background sequence set (Hertz & Stormo, 1999). These PWMs are usually depicted as a logo, in which each nucleotide at each position is represented as a letter with a size proportional to its weighted frequency. Publicly available databases of TF PWMs have been created (e.g. JASPAR (Bryne et al., 2008)), enabling genomic sequences to be scanned for the presence of putative TFBSs. However, only modest progress has been made in systematically identifying enriched TFBSs within CNEs, using either targeted or de-novo motif discovery approaches (Bailey et al., 2006; Pennacchio et al., 2006; Li et al., 2010). Furthermore, although many CNEs have now been shown to exhibit enhancer activities in developing embryos, relatively few have been dissected to elucidate the specific sequence components responsible for their enhancer functions (e.g. Pöpperl et al., 1995; Tümpel et al., 2006). Thus, the regulatory language of CNEs remains somewhat of a mystery.
The evolution of CNEs
Whilst homologs of vertebrate CNEs are largely untraceable in the genomes of invertebrates, these invertebrate phyla each have their own characteristic sets of CNEs. Over 20,000 conserved non-coding sequences have been identified between closely related Drosophila species, with a proportion being traceable in the more distantly related mosquito genome, showing a bias in their genomic distribution towards the loci of developmental regulatory genes (Glazov et al, 2005). A comparison of the genomes of two nematodes, Caenorhabditis elegans and Caenorhabditis briggsae, which show a similar level of divergence to that between human and Fugu genomes, revealed worm-specific CNEs with similar properties to vertebrate CNEs (Vavouri et al., 2007). The smaller worm CNEs are found near trans/dev genes and share the same base
8 composition signals as vertebrate CNEs. Their regulatory function is supported by many of the worm CNEs containing previously identified transcriptional regulatory sites. Interestingly, many of the genes associated with CNEs in invertebrates are orthologs of vertebrate CNE-associated genes. Of 190 C. elegans genes with CNE-associated orthologs in humans, 60 are associated with worm CNEs in C. elegans, with 40 also having orthologs in Drosophila that are associated with conserved fly elements (Vavouri et al., 2007). This is consistent with the evolutionary model outlined above, in which developmental networks composed of CRMs associated with key developmental genes in the metazoan common ancestor were initially evolutionarily plastic, their divergent evolution and the subsequent fixation of different regulatory sequences in different lineages giving rise to groups of animals characterised by vastly different body plans.
To trace vertebrate CNEs deeper into the vertebrate phylogeny, the genome sequence of a cartilaginous fish, the elephant shark (Callorhinchus milii) was searched for non-coding sequence conservation with the human genome (Venkatesh et al, 2006). Cartilaginous fishes (Chondrichthyes) represent an extant group of jawed vertebrates that diverged from the common ancestor of the bony vertebrates about 530 MYA (Figure 1.2) (Kumar & Hedges, 1998). A total of 4782 human-shark CNEs were identified, almost all of them being vertebrate-specific sequences, and many having representatives in the human-Fugu CNE set. This suggests that a large cohort of CNEs evolved prior to the divergence of bony and cartilaginous fishes and were retained in both lineages for ~530 million years. In order to ascertain when these sequences first arose, the genome of a more distantly related vertebrate must be investigated.
9 Figure 1.2. A phylogeny of the major vertebrate groups. The sea lamprey is a member of the agnathan lineage. Figure adapted from Campbell et al., 1999.
The sea lamprey as a model for investigating the evolution of vertebrate CNEs
The phylogenetic position of the sea lamprey (Petromyzon marinus), an extant jawless fish (agnathan), makes it ideally suited to answering questions regarding the early evolution of vertebrates (Figure 1.2). Given the inferred monophyly of cyclostomes (hagfish and lamprey) from molecular phylogenetic analyses (Kuraku & Kuratani, 2006), characteristics common to lamprey and jawed vertebrates (gnathostomes) can be assumed to have been present in the common ancestor of all extant vertebrates. Morphologically, the lamprey lacks certain characters present only in jawed vertebrates, including paired appendages, hinged jaws, an adaptive immune system, and specialisation of the axial skeleton along the anterior-posterior axis, which were acquired by the gnathostome lineage (Shimeld & Holland, 2000). The availability of large numbers of lamprey embryos during their summer mating season makes lamprey a useful model organism for evo-devo (Nikitina et al., 2009). Studies into lamprey development have revealed insights into the evolution of vertebrate characteristics such as the jaw (Shigetani et al., 2002), paired fins (Freitas et al., 2006) and neural crest (Sauka-Spengler et al., 2007). With the establishment of further molecular biology and histochemistry techniques for use on lamprey embryos (Kusakabe et al., 2003; McCauley & Bronner-Fraser, 2006), and a project to sequence the lamprey genome underway, the lamprey is poised to become a crucial evo-devo model. The sequencing
10 of the lamprey genome presents a fantastic opportunity to address questions about the timing of fixation of vertebrate CNEs, the functional evolution of CNEs in vertebrate lineages, and the evolution of vertebrates in general.
Thesis overview
This thesis traces the use of the sea lamprey as a model for investigating the emergence of CNEs in vertebrate genomes and the significance of these elements to vertebrate development and evolution. In Chapter 3 the pattern of CNE conservation across vertebrates is elucidated by searching for CNEs in the lamprey genome. The main findings from this search were that a relatively small, but significant, proportion of CNEs were found in the lamprey genome, and these elements were able to function as developmental enhancers in a zebrafish assay. An investigation into the functional significance of the lack of many CNEs in the lamprey genome is described in Chapter 4. Chapter 5 details the use of the lamprey CNE sequences for phylogenetic footprinting. This approach led to the identification of enriched Pbx-Hox TFBS motifs within lamprey and gnathostome CNEs, which correlate with hindbrain and pharyngeal arch enhancer function. In Chapter 6, the development of a reporter assay in lamprey embryos, and its use to address whether CNE gene-regulatory functions are conserved across vertebrates, is described. An evolutionary model predicting a role for many CNEs in the evolution of the vertebrate head is proposed. The topic of the identification of TFBS motifs in CNEs is returned to in Chapter 7, where the use of a de-novo motif discovery approach on CNEs is detailed.
11
2
Materials and Methods
Materials
Fish embryo reagents
20x Embryo medium (1L): NaCl 17.5g KCl 0.75g CaCl-2H2O 2.9g add DDW to 800ml KH2PO4 0.41g Na2HPO4(anhydrous) 0.142g MgSO4-7H2O 4.9g
Vacuum filter sterilise
Embryo medium (1L): 20x Embryo medium 50ml 500x NaHCO3 2ml Fill to 1L with DDW 100x PTU (50ml): PTU 150mg Embryo medium 50ml Heat to 65˚C, aliquot and freeze
Embryo medium with PTU (700ml): 1x embryo medium 693ml 100x PTU 7ml 10x MMR (1L): NaCl 58.44 g KCl 1.491 g MgSO4 1.204 g CaCl2.2H2O 2.94 g HEPES (pH7.8) 11.915 g
12 In-situ reagents 10X PBS (IL) pH 7.2: Na2HPO4.7H20 11.5 g NaCl 80 g KH2PO4 2 g Kcl 2g Make up to 1L with DDW
Hybridization mix (500 mL) **DNAse/RNAse free**: final conc.
Formamide 250 ml 50%
20X SSC DEPC(pH 5 w/citric acid) 32.5 ml 1.3X
0.5 M EDTA (pH 8) 5 ml 5mM
tRNA (20mg/mL in H20DEPC) 5 ml (or 100 mg) 200µg/ml
Tween-20 1ml 0.2%
10% CHAPS in H20DEPC 25 ml (or 2.5 g) 0.5%
Heparin 50 mg 100µg/ml
Fill up to 500 mL with DEPC DDW
5X MABT 1L: Maleic Acid 58g DDW 500 ml pH to 7.5 with Tris-base 100-150g NaCl 43.5 g 20% Tween-20 5 ml Fill up to 1l with DDW
10% Boehringer blocking reagent in MAB (no Tween-20) (200 ml):
BBR (Roche) 20g
1X MAB 180 ml
heat to 70C to dissolve
autoclave or microwave to a boil aliquot in 1 ml
13 PTW (make fresh): PBS with 0.1% Tween-20 20X SSC (200 mL) **RNAse/DNAse free**: NaCl 35g NaCitrate 17.6g
pH with 1M citric acid to 5.0 Fill up to 200 ml with DEPC DDW
NTMT (50 mL): Final conc.
5 M NaCl 1 ml 100mM
1 M Tris.Hcl pH 9.5 5 ml 100mM
2 M MgCl2 1.25 ml 50mM
10%Tween-20 0.5 ml 0.1% Fill to final volume with DDW
Glycine:
0.1g in 50 mL PTW
sterile filter, make fresh on day of use
MEMFA:
16% formaldehyde 2.5ml
10x MEM salts 1ml
DEPC-DDW 6.5ml
make fresh on day of use
10X MEM salts 500ml:
MOPS (pH7.4) 104.65g
EGTA 3.804g
MgSO4 0.602g
14 Methods
Molecular biology protocols: PCR
General PCR mix using Taq polymerase: 5 μl 10x buffer 5μl 10x dNTPs (2mM) 2.5μl forward primer (10μM) 2.5μl reverse primer (10μM) 0.5-2μl template DNA (25-50ng) 0.5μl Taq polymerase to 50μl DDW Basic cycle: 95˚C 2 mins 95˚C 30 secs (denature) 55˚C 30 secs (anneal) 72˚C 30 secs (elongation) repeat final 3 steps 25-35 times 72˚C 5 mins
Adjust elongation temperature according to the instructions included with the enzyme being used (for instance, the optimal elongation temperature for Accuzyme (Bioline) is 68˚C whilst for BioTaq (Bioline) it is 72˚C).
DNA purification
DNA can be purified from enzymatic reactions (such as PCR and restriction digests) and agarose gels using the illustra GFX PCR DNA and Gel Band Purification kit (GE Healthcare).
Ethanol precipitation of DNA
Add one tenth volume of 3M sodium acetate (pH5.2) to DNA solution. Add two and a half volumes of cold 100% ethanol, place at -20˚C for 30 mins. Centrifuge sample for 30 minutes at high speed at 4˚C. Decant supernatant. Add cold 70% ethanol. Centrifuge for 10 minutes at high speed at 4˚C. Decant/remove supernatant. Dry on bench or in a vacuum. Resuspend pellet in DDW or TE buffer (10mM Tris-Cl, pH 7.5, 1mM EDTA).
15
Agarose gels
In general, use 1% agarose in 1x TBE buffer. Add 1μl ethidium bromide (10mgμl-1
) per 100ml agarose.
Megaprimer PCR
This technique for introducing mutations into DNA is based on that of Barik (2002).
Figure 2.1. The megaprimer PCR method for site-directed mutagenesis. A and B are wild type primers, whilst M is a primer containing site-specific mutations.
PCR1: megaprimer creation – normal PCR settings, gel extract product
PCR2: megaprimer PCR – use product from PCR1 as primer, ~65˚C annealing temperature, 2 min annealing step, 10 min final extension, add primer B at cycle 6 annealing step, add enzyme at cycle 1 annealing step. Gel extract product. PCR3: optional amplification PCR – use product of PCR2 as template, amplify element using internal primers. Gel extract product.
DNA extraction from animal tissue
Low-scale genomic DNA extraction can be performed using the DNeasy Blood and Tissue Kit (Qiagen).
Lamprey sperm DNA extraction
Obtaining lamprey sperm:
Dissect gonads from adult male lamprey, anaesthetised by Tricaine. Wash briefly with PBS, before mincing tissue with a razor and extensively triturating in PBS in a 50 ml falcon tube. Filter with a 40 μm filter before centrifugation at 500 x g for 10 mins. Resuspend the pellet in PBS. Check the colour of the pellet
16 – if it is white/cream then it contains pure sperm; blood appears as a red pellet at the bottom – this can be removed by resuspending only the white part of the pellet. Resuspend in 5ml PBS.
Counting cells on a haemocytometer:
Clean the haemocytometer with 70% ethanol, moisten the shoulders and affix the coverslip. Mix sperm cells by agitation. Quickly transfer 1 ml with a pipette into a separate eppendorf tube. Mix cells in this tube and transfer 100 μl into a new eppendorf tube. Add 100 μl of trypan blue (0.4% in PBS) and mix gently. Fill the haemocytometer gently with 10 μl of this mix. Count the cells in the 4 corner squares (not the blue cells!). Average the four counts and multiply by 2 x 10⁶ to obtain the cell count for the original sample.
Sperm DNA extraction:
This method is based on that of Hossain et al (1997). Add 5ml of guanidinium lysis buffer (6M guanidinium thiocyanate, 30mM sodium citrate, 0.5% sarkosyl, 0.3M β-mercaptoethanol 0.2 mgml-1
proteinase K (added fresh)) per 1 x 10⁷ cells. Mix and incubate at 55˚C for 3-4 hours. Add two volumes of isopropanol to the lysate and gently invert the tube until DNA fibres clump together to form a „cotton ball‟, which should be recovered with a glass sheppard‟s crook and briefly washed in 70% EtOH. Dissolve DNA in TE buffer.
Determining the concentration and purity of DNA
Use a NanoDrop spectrophotometer according to the users manual. Expect a 260:280 absorbance ratio of ~1.80 for pure DNA, ~2.00 for RNA. A low 260:280 ratio could indicate protein contamination and influences concentration determination.
Plasmid transformation
Add 1μl ligated DNA to 15μl competent cells (such as One Shot TOP10 (Invitrogen)) in a pop-top tube. Leave on ice for 10 mins. Heat shock cells at 42˚C for 47 secs and place on ice. Add 500μl of 37˚C SOC and incubate with shaking for 1 h. Plate desired volume (can try a range) onto pre-warmed 1% LB-agar plates containing the required antibiotic. Incubate plates overnight at 37˚C.
17
Plasmid preps
Inoculate the appropriate volume of LB medium containing the required antibiotic and incubate with shaking at 37˚C overnight (minimum 8 hours). Harvest cells by centrifugation and proceed with prep using either QIAprep Spin MiniPrep Kit (Qiagen) or QIAGEN Plasmid Maxi Kit.
Restriction digestion
Standard digest mix:
1μl 10x buffer
6.5μl DDW
2μl DNA (choose concentration appropriate to the size of the band to be visualised – the smaller the band the higher the concentration) 0.5μl enzyme (5-10 units)
Mix well and incubate for 1h at 37˚C.
DNA ligation
Standard ligation mix (sticky ends):
1μl 10x T4 ligase buffer
6:1 molar ratio of insert to vector (~10ng vector) make up to 9.5μl DDW
0.5μl T4 ligase (200 units)
Leave for 10mins at RT. Proceed with transformation.
Fish embryo protocols: Zebrafish strains
QMWT Tubingen WT
rh3/5:KalTA4 (aka: r3r5 RFP) (Distel et al., 2009)
Zebrafish transgenesis – Co-injection reporter assay
This assay is adapted from a protocol presented in Müller et al. (1999). Preparation:
18 PCR-amplify βglobinGFP promoter-reporter cassette, ethanol precipitate and column purify to make a stock of 200ngμl-l. PCR-amplify putative enhancer, ethanol precipitate and column purify to make a stock of 500ngμl-1
. Injection:
Prepare the injection mix – 25ngμl-1
βglobinGFP promoter-reporter cassette 75-125ngμl-1 putative enhancer
0.5 μl phenol red (0.5% Sigma) Make up to 5μl with DDW
Inject –
Pre-warm agarose injection dishes by placing them at room temperature. Load injection needle with injection mix and insert into micro-injector. Inject embryos at early 1-cell to 2-cell stages, either in the cell or into the yolk adjacent to the cell. Inject a volume equivalent to 1/5 the volume of the cytoplasm.
Post-injection –
Transfer embryos into a petri dish containing EM, incubate at 28˚C. In evening, remove unfertilised embryos and transfer embryos to PTU, incubate at 28˚C. Change EM-PTU daily.
Embryo screening –
Dechorionate embryos manually using fine forceps. Anaesthetise embryos with 6-8 drops (glass Pasteur pipette) of Tricaine stock per small petri dish. Screen under fluorescent microscope. Note GFP expressing cells on embryo schematic data sheet. Compile composite expression using Adobe Photoshop.
Tol2-mediated transgenesis
This method is based on that of Fisher et al. (2006). The destination vector into which elements are to be cloned is pGW_cfosEGFP (Fisher et al, 2006).
PCR-amplify the element from genomic DNA with a high-fidelity enzyme using a 5 mins final extension step. For a successful TOPO reaction, column purify the PCR product.
Insertion of element into the entry vector:
Use the pCR8/GW/TOPO TA vector to clone the PCR product 50-100ng (4 μl max volume) fresh, purified PCR product 0.3 μl (5ngul-1
19
1 μl saline buffer (from TOPO kit)
make up to 6 μl with DDW
Leave for 5 mins at room temperature.
Mix 3 μl of the mix with 50μl competent cells (DH5α, TOP10 or Match1) and transform. Plate all the volume on pre-warmed 1% LB-agar plates containing spectinomicine (100mgl-1). Leave overnight at 37˚C.
Pick three colonies and inoculate them into 2ml of LB with spectinomicine (100mgl-1). Incubate overnight at 37˚C with shaking.
Purify the plasmids by mini-prep and check for the presence of the insert by PCR. Select one plasmid for recombination.
Recombination with pGW_cfosEGFP destination vector:
Use the Gateway LR Clonase II enzyme (Invitrogen) to transfer the TOPO-cloned element into the pGW_cfosEGFP vector-
1 μl TOPO vector with insert (100ng) 1 μl pGW_cfosEGFP (100ng)
0.5 μl Clonase enzyme
Leave at 25˚C for 1h minimum. Add 0.25 μl of Proteinase K (2μgμl-1
). Transform 1.25 μl in Match1 or TOP10 competent cells. Plate all the volume on pre-warmed 1% LB-agar with ampiciline (100mgl-1). Leave at 37˚C overnight. Pick 3 colonies and inoculate them into 2ml of LB with ampicilin (100mgl-1). Incubate overnight at 37˚C with shaking.
Purify the DNA by mini-prep, followed by column purification. Injection:
Prepare the injection mix –
1 μl DNA (purified plasmid: 125ngμl-1
) 1 μl transposase RNAenzyme (175ngμl-1
) 0.5 μl phenol red stock
Load an injection needle of 1mm diameter with the mix. Inject with a micro-injector 1-3nl per embryo, aiming for the yolk just adjacent to the cell. Inject into embryos at the 1-2 cell stage.
Lamprey transgenesis –
Lamprey husbandry and embryo care, as described in the transgenesis protocols below, is detailed in Nikitina et al. (2009).
20
Linearised construct injection
Preparation of vector:
The vector used is pGW_cfosEGFP. Clone the element into the vector as described for the zebrafish tol2 assay. Linearise vector by restriction digestion with KpnI or XhoI. Digest enzyme with proteinase K (100-200 μgμl-1). Column purify, elute in DDW to make stock of 100ngμl.
Injection:
Obtain lamprey eggs by massaging a gravid female lamprey in a large glass dish containing 18˚C Sparkletts water (mineral water with a suitable ionic concentration). Fertilise eggs by massaging a mature male lamprey, mix and leave eggs to fertilise for 10 mins. Check activation under a dissecting microscope – chorions can be seen to expand. Wash thrice with distilled water (18˚C) and replace with Sparkletts water. Incubate at 18˚C. The first cell division occurs at 5-6 hpf. Check the viability of the batch by the proportion of embryos showing cell cleavage - <50% cleavage is bad, >80% is good. Inject 2-3μl linearised plasmid at 100ngμl-1
into embryos at 1-2 cell stage. Store embryos in 0.1x MMR at 18˚C.
Lamprey embryo care:
Keep embryos at 18˚C in an incubator. Change the 0.1x MMR daily. Remove the dead embryos daily. At e4 (3dpf), spread embryos apart in the dish and leave them to gastrulate until late e5/e6. Remove dead embryos and screen survivors for reporter expression.
I-sceI meganuclease-mediated transgenesis
This method is based on that of Ogino et al. (2006), which was used on frogs. Cloning element into the vector:
The cfos-IsceI-EGFP vector was created from the β-globin EGFP construct by cloning the mouse cfos promoter in place of the β-globin promoter, upstream of the EGFP coding sequence (Figure 2.2). I-SceI sites flank the promoter-GFP cassette. Enhancers to be tested can be cloned upstream of the promoter using eg 5‟ XhoI and 3‟ HindIII sites, which can be added to the primers used to PCR amplify the elements. After cloning the element into the plasmid, extract the plasmid using an EndoFree Plasmid Maxi Kit (Qiagen) and elute with water through QIAQuick columns (Qiagen). Dissolve the DNA in DDW to 1μgμl-1 and make a working stock of 100ngμl-1. Store both at -20˚C.
21 Figure 2.2. Map of the cfos-IsceI-EGFP plasmid. Key features are highlighted and explained by the colour-coded key.
Preparation of injection solution:
To maximize the number of full transgenics it is good to inject the DNA whilst the embryos are still at the single cell stage. However, it was found that injection at 2-3 hpf resulted in abnormal division followed by death during gastrulation, whereas injection at 5-6hpf was fine. At this stage the embryos start to show cleavage furrows.
The standard reaction is
2μl 10 X I-sceI buffer + BSA (pre-mixed) 4μl cfos-IsceI-EGFP plasmid (100ng μl-1) 3μl I-SceI enzyme (5 units μl-1)
11μl Water
Digest at 37˚C for 40 mins. The I-SceI enzyme should be aliquoted and kept in a freezer at -80˚C to prevent degradation. This reaction mix results in a plasmid DNA concentration of 20ngμl-1
. Injection:
After 40 mins of digestion, take the mix out of incubation. This is the injection mix. Inject roughly 2-3nl per embryo (quite a small drop) using the standard
22 injection procedure. Inject immediately - freshness is the key. Transfer injected embryos to 0.1x MMR and incubate at 18˚C.
In-situ hybridisation on lamprey embryos
Fixing Embryos:
Collect embryos and leave in MEMFA at RT FOR 1h on nutator.
Add 1 X DEPC-PTW solution. Shake on nutator for at least 15 mins. Discard solution. Repeat this wash three times.
Dehydrate embryos: 15 mins on nutator each 25% MeOH + 1X PTW/DEPC
50% MeOH + 1X PTW/DEPC 75% MeOH + 1X PTW/DEPC
Add MeOH 100%. Shake for 15 mins. Discard solution. Do this step twice Add MeOH. Store at –20 C
Pretreatments and Hybridization:
Re-hydrate embryos - 5-10 mins each, on nutator 75% MeOH + PTW/DEPC
50% MeOH + PTW/DEPC 25% MeOH + PTW/DEPC
Wash twice with PTW/DEPC for 5 mins each
Bleaching step: Replace PTW/DEPC with freshly made bleaching solution, which is 0.5% SSC, 10% H2O2, 5% formamide (For 10ml add in the following
order: 500µl Formamide, 6.45ml H2O, mix together then add 250µl 20X SSC
and finally, 2.8ml H2O2). Place on the light box for 10 mins (this time can be
increased to 15 mins if stronger signal is desired). Dilute the bleaching solution with an equal amount of water.
Wash thrice with PTW/DEPC for 5 mins each
Treat with 14-22µg/ml of proteinase K in PTW/DEPC (1:1000 dilution of the Roche PK stock). Incubation time depends on the level of the penetration desired. It may vary between 10 – 15 mins. Do not use the nutator after this step until the Fixing step!
Wash in 2 mg/ml of glycine in PTW/DEPC. Incubate for 10mins Wash twice with PTW/DEPC for 5 mins
Post-fix with 4% PFA + 0.2% glutaraldehyde for 20 min @ RT Rinse 4X with PTW/DEPC for 5 mins
23 PTWDEPC: Hybe Mix (1:1) 10 min @ RT
Hybe Mix 10 min @ RT, add another HybeMix wash if necessary to get as close to 100% HybeMix as possible.
At this point the embryos can be stored indefinitely in HybeMix at -20C. The procedure can then be continued at any convenience.
Change to new hybe mix and pre-hybridize: Incubate at 70C for approximately 3 hours
Add new pre-warmed (70°C) hybe mix + RNA probe-Dig (1-10 µl/ml hybe) Incubate at 70C O/N (at least 16 hours). Position tubes horizontally if using an oven.
Post-hybridization washes (Most important for specificity):
Remove the probe in Hybe solution and save it @ -20°C (to be re-used) Wash 2X with pre-warmed hybridization solution (50 ml tube ON in the oven) at 70C for 15 mins each
Wash 4X with warmed hybridization solution at 70C for 30 –45 mins each Wash once with HybeMix:MABT (1:1) @ 70°C for 10 mins
Wash once with HybeMix:MABT (1:1) @70° C for 30 mins with agitation Wash 4X with MABT for 30 mins at RT on nutator
Change MABT to MABT + 20%Sheep Serum + 2%BBR for 15 mins at RT (blocking solution) on nutator
Replace with fresh MABT + SSC + BBR for 3-4 hours at RT on nutator Change to Anti-Dig-AP AB (1:2000) in MABT + sheep serum + BBR and leave O/N at 4C on the nutator
Post-Ab washes and Histochemistry: All these steps are on the nutator-
Rinse 2X with MABT for 5 mins each wash at RT Wash 2X with MABT for 30 mins each at RT Wash 6X with MABT for 1 hour each wash at RT Wash at 4C O/N
Wash 4X with NTMT, 15 min at RT
Change NTMT solution to BCIP in NTMT (filtered). Be sure to cover vials with foil. Change the substrate after 1h. Closely follow the development of colour. If necessary leave at 4C O/N.
After the desired color has developed, proceed with washing steps. Wash 3X with PTW for 5 mins each at RT (in obscurity-foil)
24 Change to 4% PFA, leave at 4C O/N OR 2 hours RT (in obscurity-foil)
Wash 3X with PTW for 10 mins at RT (in obscurity-foil) Change solution to MeOH in PTW - 5 mins each
25% MeOH + PTW 50% MeOH + PTW 75% MeOH + PTW
Wash twice with 100% MeOH for 5 mins each Keep @ 4°C or -20C ON
Re-hydrate embryos before photographing:
Change solution to MeOH + PTW - 5 mins each 75% MeOH + PTW
50% MeOH + PTW 25% MeOH + PTW
Wash 3X with PTW for 5 mins each
Embryos can be further equilibrated to 75% Glycerol in PTW (gradual steps of 25%, 50% and finally 75% Glycerol/PTW)
25
3
CNEs in the Sea Lamprey Genome
Abstract
CNEs show an intriguing pattern of conservation across chordates – whilst they are incredibly highly conserved amongst jawed vertebrates, there are barely any traces of them in invertebrate chordate genomes. This is in contrast to the conservation patterns of the genes with which they are associated, the majority of which have invertebrate homologues. As an increasing number of CNEs have been shown to have cis-regulatory capabilities, they have been proposed to represent regulatory elements that arose early in the vertebrate lineage and are crucial for specifying the development of the vertebrate body plan. Whilst a wealth of genomic data is available for jawed vertebrates, there is another vertebrate lineage containing species whose genomes have not been so well characterised – the agnathans. This lineage occupies a unique phylogenetic position, having diverged from the other vertebrates very early in vertebrate evolution. In this chapter, emerging genomic sequence data from an agnathan – the sea lamprey – is used to trace the evolution of CNEs deep into the vertebrate phylogeny. In doing so, a set of ancient, pan-vertebrate CNEs is defined. This set of elements provides a useful resource for investigation into the crucial roles that CNEs are predicted to play in vertebrate development.
Introduction
The high sequence conservation of gnathostome CNEs can be traced back as far as the Chondrichthyes(Venkatesh et al, 2006), showing that these sequences evolved prior to the divergence of cartilaginous and bony fish more than 500 MYA (Blair & Hedges, 2005). However, traces of only a very small number of vertebrate CNEs are visible in the genome of an invertebrate chordate, amphioxus, illustrating that the majority of CNEs represent a defining characteristic of the ancestral vertebrate genome (Putnam et al., 2008; Holland et al., 2008). Invertebrate groups have also been found to posses their own sets of CNEs (Glazov et al., 2005; Vavouri et al., 2007) and there is a correlation between the families of genes around which both vertebrate and invertebrate CNEs are clustered, suggesting parallel evolution of the GRNs in which these CNEs act (Vavouri et al., 2007). Thus, despite the fact that the evolution of coding sequences can be tracked across the invertebrate/vertebrate boundary, the evolution of CNE sequences
26 seems to have followed a different pattern, with their comparatively rapid emergence very early the vertebrate lineage. As a starting point to investigate the origin and evolution of CNEs in early vertebrates, I have focused on the sea lamprey, Petromyzon marinus. It can be assumed that the common ancestor of gnathostomes and angnathans possessed the developmental mechanisms and morphological characteristics that are shared by both modern groups. Comparative studies of the lamprey and its genome can therefore provide insights into the ancestral vertebrate state, and the common regulatory sequences that determined it.
It is likely that the early vertebrate genome was shaped by two whole genome duplication events, with gnathostomes possessing paralogous copies of genes that exist in single copy in invertebrates such as amphioxus (Putnam et al., 2008). There is evidence supporting the hypothesis that both rounds of duplication preceded the agnathan-gnathostome divergence (Kuraku et al., 2009). However, this is difficult to prove definitively without an assembled lamprey genome. Whilst the majority of CNEs appear to be unique in the human genome, a significant sub-set exist as duplicates and are found in the vicinity of paralogous genes (McEwen et al., 2006). These duplicated CNEs (dCNEs) indicate that certain CNEs were already in existence prior to at least one of the whole genome duplication events in vertebrates. If the agnathan and gnathostome lineages diverged after these duplications, then we might expect to find some CNEs to also be conserved in the lamprey genome.
The genome of the sea lamprey, Petromyzon marinus, has been targeted for a high quality draft and assembly. Over 18 million whole genome shotgun (WGS) reads, equivalent to a 6-fold coverage, have been made available. By utilising this lamprey sequence data, it is possible to investigate an ancient era between the emergence of vertebrates and the divergence of the agnathans and gnathostomes, in order to identify those CNEs that are common to all extant vertebrates.
Results
Identification of CNEs from the lamprey whole genome shotgun sequence
(this data was generated and analysed by G. McEwen)
Thousands of CNEs have previously been identified by sensitive multiple sequence alignment between human, mouse, rat and Fugu genomes (Woolfe et al., 2007). From a
27 database of these CNEs (http://condor.nimr.mrc.ac.uk/) 13 gene regions were selected based on the high occurrence of dCNEs within them. Smaller CNEs from these regions were removed by using an “LPC” score of >= 50, (the score is based on the sequence length and identity across the four species (Woolfe et al., 2007)). The 13 gene regions comprise a total of 27 Mb of sequence, containing 1205 elements (Table 1), including 108 duplicated CNEs (dCNEs) (McEwen et al., 2006) and 46 ultra-conserved elements (Bejerano et al., 2004) (UCEs) - sequences with 100% identity over at least 200bp between mouse, rat and human genomes. The 1205 gnathostome CNEs were identified using a multiple alignment approach - MLAGAN (Brudno etal., 2003) - however, this approach is not possible for the lamprey trace sequences due to their short length. To verify the efficacy of using BLAST (Altschul et al., 1997) as a tool for identifying CNEs, we searched the Fugu genome for homologous sequences to the 1205 human CNEs using sensitive parameters (word size: 8, mismatch penalty: -1, e-value cut-off: 5e-4), with the majority of the CNEs being identified (1035/1205 = 85.9%) (Table 1). The 1205 CNEs were then searched against the lamprey reads, which were downloaded from the NCBI trace server (http://www.ncbi.nlm.nih.gov/Traces/trace.cgi), using BLAST (parameters as above for the Fugu genome search).
Some of the lamprey reads were predicted to represent contamination, as a number of hits were almost identical to chicken when compared to all vertebrates in Ensembl using BLAST. The full length lamprey reads corresponding to these hits were then compared to the chicken genome using BLAST (with default parameters) and those matching to chicken with >90% identity across most of their length were removed (a total of 34 lamprey hits). Due to the unassembled lamprey genome sequence, many lamprey hits were to multiple redundant reads. Consensus sequences were generated for each hit if the sequences were more similar than 95% identical, with overlapping hits then being joined to make a contiguous hit.
From this search, 74 lamprey CNEs were identified, including 38 dCNEs and 8 UCEs, with matches to gnathostome CNEs in all but one of the gene regions (Table 1). This signifies a widespread distribution of CNEs across trans-dev genes in lamprey. The proportion of lamprey hits to dCNEs (38/74 = 51.3%) was found to be greater than would be expected based on their proportion in the gnathostome CNE set (dCNEs only constitute 3.7% of the total CNEs across the 13 regions). This demonstrates a considerable enrichment for this set of ancient elements. Furthermore, whilst 17.4% of
28 the UCEs were detectable, more than twice as many (35.2%) of the dCNEs were identified across the regions. Despite lamprey CNEs being found for each of the 13 gene regions except Dach1, the total number that were identified is low relative to the numbers conserved across jawed vertebrates – only 74 of 1205 were found. This could be an underestimate due to the incomplete coverage of the lamprey draft genome sequence. Alternatively this pattern may represent significant divergence of these sequences between lamprey and gnathostome lineages or the rapid emergence of many CNE sequences in the gnathostome lineage (see Discussion).
All CNEs dCNEs UCEs
Human genome
Multi-LAGAN BLAST hits
Multi-LAGAN BLAST hits
Multi-LAGAN BLAST hits
Gene Region Chr Length (Mb) H/F/M/R H/F H/L H/F/M/R H/F H/L H/F/M/R H/F H/L BARHL2 1 0.789 55 49 1 4 4 0 0 0 0 BCL11A 2 2.634 72 55 4 6 6 3 8 5 1 DACH1 13 1.236 56 50 0 4 3 0 7 4 0 EBF3 10 1.753 138 118 9 13 13 3 2 1 1 FOXB1* 15 1.979 45 40 2 5 5 2 0 0 0 FOXP2 7 1.682 95 78 8 7 7 2 6 3 0 IRX5 16 4.421 192 163 10 20 20 6 3 1 0 MEIS2 15 3.079 118 103 10 8 8 4 4 3 0 NR2F1 5 3.412 117 98 3 5 5 2 1 1 0 PAX2 10 0.264 51 45 9 6 6 5 9 8 4 TSHZ3 19 2.194 109 101 10 15 15 8 2 2 2 ZIC2 13 0.835 36 29 3 4 4 1 0 0 0 ZNF503 10 2.759 121 106 5 11 11 2 4 4 0 Totals: 27.039 1205 1035 74 108 107 38 46 32 8
Table 3.1. CNEs from 13 human gene regions identified in the Fugu and lamprey genomes. Chr: chromosome, H: human, F: Fugu, M: mouse, R: rat, L: lamprey. H/F/M/R: four way multiple alignment (MLAGAN) used to identify CNEs.
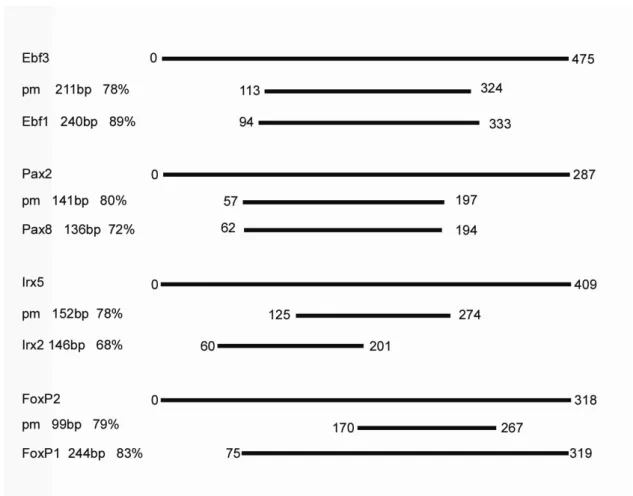
The lengths of the lamprey hits were found to be on average considerably lower than those defined by gnathostome conservation. Lamprey sequences match on average only 47% of the length of CNEs defined through alignments between mammals and fish using the same BLAST parameters. Nevertheless, sequence conservation is high across these core regions, with an average identity of 80%, compared with approximately 90% between teleosts and mammals.
29
Analysis of a contiguous region of the lamprey genome that contains CNEs
(This search was performed by G. McEwen, with the alignment created by myself) The pre-Ensembl lamprey draft assembly (PMAL3) was searched for assembled contigs that contain multiple lamprey CNEs. The longest of these (contig 1709) encompasses 33.7kb of contiguous lamprey sequence with just three short unresolved regions. This contig contains a number of CNEs as well as an uncharacterised gene, C15orf41, which lies immediately downstream of the meis2 gene in gnathostome genomes (Figure 3.1). The identified lamprey CNEs reside directly adjacent to, or within the introns of, the C15orf41 gene, and form part of a much larger genomic regulatory block covering nearly 3.5Mb of the meis2 locus in the human genome, which contains over 200 CNEs.
The organisation of this region, with conserved coding exons acting as landmarks, allowed us to identify which gnathostome CNEs are detectable in the lamprey genome using multiple alignment approaches. Given the conserved positional relationship of CNEs in all other vertebrates, we have assumed that if lamprey CNEs are present, they will also be co-linear. From Figure 3.1 it is apparent that whilst some CNEs are clearly detectable in the lamprey genome, others are not found using sequence similarity. Furthermore, BLAST searches of the WGS reads do not identify these CNE sequences elsewhere in the lamprey genome.