A web-based query interface for health-care data warehouses
Zhouxiao Wang
a, Qigang Gao
a, Michael Shepherd
aand Mark Smith
baFaculty of Computer Science, Dalhousie University, Halifax, NS, Canada B3H 1W5 bPopulation Health Research Unit, Dalhousie University, Halifax, NS, Canada B3H 4H7
E-mail: qggao@cs.dal.ca
Received 10 July 1999; received in revised form 14 August 2000; accepted 19 September 2000
Abstract
This paper presents a new type of computer interface to large population health-care data repositories via the Internet. It does not require programming knowledge but is ¯exible enough to handle the ad-hoc queries common in research settings. The interface allows for the automated creation of SAS programs by the end users using a GUI-based questionnaire. The interface is the front end of a three-tier client/server system for on-line information retrieval for large health-care data warehouses.
Keywords: health-care data warehouse, web-based query interface, automatic SAS code generation, three-tier architecture
1. Introduction
Large repositories of health data are invaluable resources to researchers and planners in health care. These large repositories are usually created and maintained as data warehouses with data from many different sources being centralized on a large server. However, access to these repositories is often limited by the fact that specialized programs must be written to obtain the desired information and results. Often, these programs can be written only by the trained programmers who are familiar with the databases and the language for accessing the data. This consultative process is both time-consuming and expensive.
Over the past few years, Web-based query interfaces to databases have become a popular solution for on-line decision-support systems. For quite a while, it has proven very dif®cult to build effective decision-support systems via the Internet because the techniques available were not able to support the end-user satisfactorily. The end users would like to have available a variety of techniques such as a graphical user interface, query operations, statistical and data mining techniques, windowing mechan-isms, and visualization techniques so that they can easily access the data, retrieve information, and view results graphically. To provide these techniques at the user's computer requires a great deal of computing power at each computer. Alternatively, the Web-based client/server architecture is currently the best choice for providing these capabilities (SAS Institute Inc, 1999; Smith and Guengerich, 1998;
# International Federation of Operational Research Societies. Published by Blackwell Publishers Ltd.
Orfali and Harket, 1998; Sadoski, 1998a; 1998b; International Systems Group, 1998; Dolgicer, 1998). Client/server involves dispersing the software over several computers and creating an environment for the end-user so that each computer works just on one part of the problem.
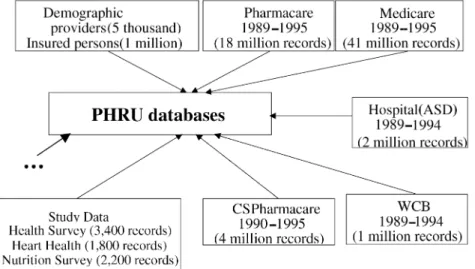
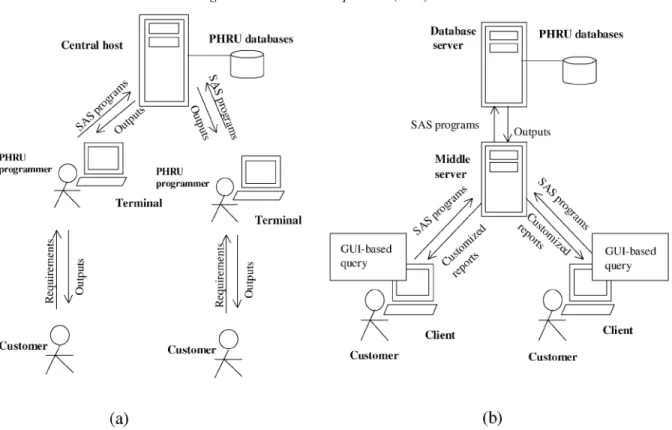
This paper presents a Web-based query interface to a population health-care data repository as a part of the research project proposed by the Population Health Research Unit (PHRU), Nova Scotia, Canada (PHRU, 1998; Smith and Kephart, 1998). The project is aimed at developing an effective on-line information retrieval system for the PHRU databases. The PHRU data warehouse is a single-site collection of large data sets replicated from various population health-care databases of the province of Nova Scotia. The data warehouse, as showed in Fig. 1, consists of a number of very large database ®les such as medicare, pharmacare, hospital administration, workers compensation, clinical records, large-scale population surveys, etc. The individual data sets have been linked through an encrypted identi®er, but they are not structured with any standard data warehouse schema for the sake of analysis ¯exibility. In the traditional approach, as illustrated in Fig. 2a, the data has to be accessed by professional programmers using the programming language SAS (SAS Institute, 1999). This approach is powerful and ¯exible in that almost any ad-hoc query or analysis that is supported by the data can be generated, given enough time and effort. But the problem is that it is very costly in terms of the time required to create each SAS program, and the user has to rely upon programmers to access the data for generating a result. As the demands to access the data warehouse increase, the programmer-bottleneck problem becomes an issue. An alternative strategy is to use the subject-oriented schemas to organize pre-digested and summarized data. This method can improve the response time and also the technical knowledge required to access the data. However the subject-oriented structure may limit the kinds of questions the user can ask, and the cost of building and maintaining this warehouse is high.
The proposed strategy is to combine advantages from each of the above approaches, yet avoid the most serious pitfalls in either. This new method of accessing large repositories:
(1) does not require any programming knowledge,
(2) does not require exporting, summarizing or copying the data, and (3) is ¯exible enough to handle ad hoc analysis queries.
In short, the proposed system, as illustrated in Fig. 2b, provides the user with a Web-based query interface that allows the user to de®ne his/her application (i.e., a query) by following domain-based menus. The generated query can then be translated into an SAS program automatically for accessing the data. The system uses a three-tier architecture, including client, Web server, and database server, for partitioning the computation and making optimal use of each computer. A complete system of the project includes following subsystems: query interface and automatic SAS code generation, data mining, graphics viewing and report formatting, and system administration and security. This paper is mainly focused on the subsystem query interface and automatic SAS code generation.
The paper is organized in ®ve sections. The general issues of the system design are introduced in Section 2. The query interface design and automatic code generation are two key components of the Web-based query interface; they are discussed in Sections 3 and 4 respectively. The last section gives conclusions.
2. System design and architecture
The main goal of the proposed system is to eliminate the need of skilled programmers for applications, and make the users to be able to directly communicate with the data via the Internet. Accordingly, the following features are considered in developing the system.
(1) Web-based GUI: allows the user to easily communicate with the data warehouse through the Internet.
(2) Guided query: a domain-based query system which guides the user to de®ne a data set and the computation on it without the need of programming knowledge.
(3) Automatic SAS code generation: the query de®ned by the user can be automatically translated into SAS code and sent to the data warehouse for retrieving the information.
(4) Customized report formatting: provides the user a set of visualization options for viewing the result and producing the ®nal report.
(5) Data mining: a set of data-mining modules is available for discovering the patterns and rules hidden in the data.
(6) Security and scalability: a set of built-in secure features is available for insuring the data privacy and the system security; the system can be easily extended to include additional new features. Features (1) to (3) are the focus of this paper. Features (4) to (5) are the other three subsystems of the project for which we will only give a brief overview.
The proposed system adopted the three-tier client/server model which provides the technological means to use previous investments concerned with the current technology options. The system, as illustrated in Fig. 2b and Fig 3., includes three layers of computers: client, middle server (i.e., Web server) and database server.
Client: deals with the communication between the end-user and the Web Sever and executes
applications from the Web server.
Web server: connects clients to the database server and serves a middle-layer of the architecture. The Web server accepts the HTML commands from the client. If the client requires data from the database server, the Web server is responsible for controlling and passing the information to the database server, and returning the feedback to the user.
Database server: stores and maintains the data warehouse, and executes SAS programs for
accessing the data.
The Internet provides the basic connectivity among the components of the system. The client communicates with the end-user, including managing the user-interface of the application, validating data entered by the user, generating SAS code and dispatching requests to the middle server. The computation for the client needs to be kept as simple as possible. The Web and database servers disperse the other main services, and each server is set up to fully optimize the end-user's application. The old SAS server acts as the database server in the new system without a change. In other words, the server can still work independently. The middle server receives input (SAS programs) from the client, and transmits the input to the database server; then receives output from the database server, processes the output and returns the output to the client. The detail system design is illustrated in Fig. 3.
Web server (also called application server) is the key part of the system, which collects all application logic, handles the communication between the client and the database server, and plays as a central control of the whole system. The Web server consists of Security Manager, Query Interface Provider (QIP), SAS Code Generator (SCG) classes, Queue Manager, File Manager, Mail Manager, SAS Local Host, and Apache Server. SCG is run on the client as an applet.
Security Manageris responsible for user authentication. User authentication is the process by which the system identi®es the users who connect to the web site. The user has to authenticate himself by entering the correct username/password pair which was approved by PHRU in advance. User identi®cation information is stored in the Membership database, which contains the private data for each user including username, password, and other relevant personal data. All operations of the Security Manager, including retrieval, insertion, modi®cation and deletion, are on the Membership database.
Query Interface Provider is a set of GUI-based questionnaires which guides the user to de®ne a
query. QIP in the Web Server manages the interface centrally (more detail is discussed in Section 3).
SAS Code Generatoris a set of Java applet classes for forming SAS code from the user's query. SCG composes an SAS program based on the questionnaires and answers from the client by the applet embedded in the web page, which will be submitted to the database server for getting the ®nal data.
Queue Managerdeals with multiple-job management. Each generated SAS program is a job which
is assigned a job ID and put into the job queue according to its arrival time.
File Managermanages the ordered ®les including both query programs and output ®les.
Mail Managernotices the user when his/her result is available (through E-mail) if the user does not want to wait for a big job.
Apache Server is a mandatory part in the Web server. It handles all HTTP commands from the
clients.
SAS Local Host is responsible for sending the jobs to remote host by remote-submitting for
executions. It takes a job from the queue, submits it to the remote host, and receives output from the remote host. SAS Local Host in the Web Server communicates with SAS Remote Host in SAS Database Server.
All data ®les that support the application logic are stored in the Web Server including: Membership database for users' personal information, meta data of the PHRU databases, the generated SAS code ®les, and SAS output ®les.
Base SAS is responsible for compiling and executing every job from SAS Local Host. PHRU
warehouse is a collection of databases listed in Fig. 1, and stored in SAS Database Server. Data
Mining User Interface links to the data-mining subsystem for de®ning a task related to classi®cation, association and clustering tasks.
3. Query interface design
The query interface is a Web-based GUI which allows the user to create their own queries by using a domain-based language. The goal is to provide the client with both common query and data-mining functions. In this paper, however, only the common query interface is of concern.
Generally, the query interface is based on common questionnaires which are currently used by PHRU. The process asks the user questions and lists all the possible choices. What the user does is to select from the choices. Currently, the interface provides two major input sections: data selection and data analysis, which work together to create the user's customized queries.
3.1. Data selection
The questions asked by the interface are guided to de®ne the data set to be analyzed, which include locating a database and specifying a subset of the database. For instance, two typical questions to be asked are: `What type of data do you want to analyze?' `What years of data do you want to analyze?' The given choice is a list of the databases, such as Medicare (1989±1995), Pharmacare (1989±1995), Hospital-ASD (1989±1994), Hospital-CIHI (1995±1996), and so on. The user can either select a database from the list, or merge multiple data sets. In the latter case, the user can create additional datasets by merging multiple existing data sets following the guidance of the interface.
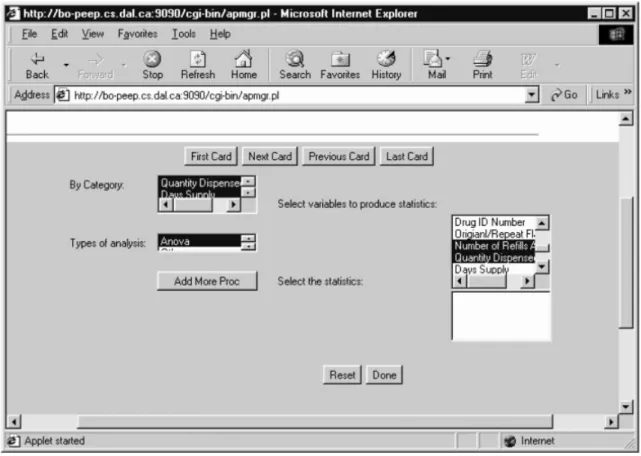
The second part of the data selection query is to specify a subset of the database by following the question such as `Is there some subset of the data that you want to analyze?' The user is then given a form through which the query for de®ning a subset of the selected database can be generated. This form includes all possible ®elds the user can access, valid operators and values of each ®eld, as well as logic connectors. The information given to the user is based on the database selected by the user. An example of the interface is given in Fig. 4, which shows a partial process of de®ning a data set with the condition: yob1992 and pcounty`15' and sex`1' (Note: the database pharm had been selected in the previous step).
3.2. Data analysis
A data analysis query can be de®ned in the following steps. The ®rst step is to select a desired statistical analysis procedure for processing the data by following a guided question: `What type of analysis do you want to perform?' For instance, a selection can be from the functions Mean, Frequency, Correlation, etc. In general, any functions which are describable in SAS language can be made available. The query library can be updated easily by adopting more calculation procedures.
The second step is to select the variables to be calculated for the application by following the question: `Which variables do you want to use for the analysis?' From here, the interface promotes the user with a reference list of the available numerical variables of the de®ned data set. The user may select one or more of them for the analysis.
The interface also allows the user to select categorical variables to de®ne a subgroup for the analysis by following the question: `Which sub-groups do you want to conduct the analysis?' An example of the interface is provided in Fig. 5, where the procedure Anova has been chosen for the analysis on the data set. As a summary, all the questions in the Data Selection and Data Analysis sections are arranged in a `deck' of cards where only the top card is visible. Any card in the deck can be placed at the top of the deck at any time. The interface guides the user ®lling in the cards one by one. The card-based layout makes the dynamic interface easily understood by the client.
4. Automatic SAS code generation
The SAS code generator of the Web-server converts automatically a query de®ned by the user from HTTP format to a corresponding SAS program. The SAS system organizes data using a rectangular
form called an SAS data set. An SAS data set is stored in binary form. It can be recognized and handled directly by SAS program statements. The PHRU databases are stored in the SAS format. In this section, we ®rst introduce the basic structure of SAS programs, and then discuss the general procedure of translating a query from HTTP representation into an SAS program.
4.1. SAS program structure
As shown in Fig. 6, an SAS program or a portion of the program consists of multiple data steps and procedure steps. The sequence of DATA steps and PROC steps can be varied in countless ways.
Fig. 5. An example of the query interface for data analysis section.
The DATA step typically reads in data, modi®es the data, and creates new data, which has a standard format:
DATA SAS-data-set; (SAS statements)
RUN;
A DATA step creates an SAS data set which has a standard SAS format and can be recognized and processed by a PROC step. The user is allowed to work with multiple data sets. In SAS, merging data sets uses the MERGE statement in a DATA step.
A PROC step calls an SAS procedure to analyze or process an SAS data set. The format of a procedure step is:
PROCprocedurekDATASAS-data-setl; (SAS statements)
RUN;
The SAS system provides all kinds of built-in procedures, which may be classi®ed into four categories: reporting, such as PRINT, CHART, PLOT; descriptive, such as FREQ, MEANS, UNIVARIATE; utility, such as SORT, FORMAT; and statistics, such as REGRESSION.
An SAS program can contain any number of DATA and PROC steps. Once a data set has been created, it can be processed by any subsequent DATA or PROC steps.
4.2. Translation
The user's input information from the interface is broken down into two categories: data selection and data analysis. When SCG translates input piece into SAS code, the data-selection information is translated into DATA steps, and the data analysis information is mapped into PROC steps. We use some simple examples of the query interface to illustrate the translation processes.
Question 1:`What type of data do you want to analyze?'
The available choices are: Medicare, Pharmacare, Hospital (ASD), Hospital (CIHI), etc.
The SAS statement is:
LIBNAMElibref `DIRECTORY_NAME'; ± Translation (1) The translation associates alibrefwith an SAS data library (data directory) stored in the Web-server as shown in Table 1. The SAS system then can locate a permanent SAS data set by matching the libref with the physical directory (DIRECTORY_NAME) in the database server.
Question 2: `What years of data do you want to analyze?'
The available choices are: Medicare (1989±1995), Pharmacare (1989±1995), Hospital (ASD 1989±
1994), Hospital (CIHI 1995±1996), etc.
DATA; ± Translation (2)
SETFILE_NAME;
RUN;
The query selections from Question (1) and Question (2) work together to identify a unique data set. For instance, if the user selects `Medicare' and `1994', then the SCG searches the metadata to ®nd the data set `MED94'. The translation tells the SAS system to begin creating an SAS data set. In SAS, it is a DATA step which begins withDATA statement and ends with aRUNstatement. The SETsentence tells the SAS system to read observations from an existing SAS data set. In the previous example, the generated code is:
DATA;
SET`MED94';
RUN;
Question (3):
`Is there any subset of the data to analyze? What is your criteria to choose the subset?'
The SAS statement is:
IFcondition (user's query) [THENaction]; ± Translation (3)
The translation follows the most common way in which the SAS system selects observations in a DATA step. It creates a subgroup of the data set and in this sub-group, only the observations which meet the condition are kept. For example, if a data step is
DATA;
SET`MED94';
IFsex`female';
RUN;
The data step will create a subgroup of `MED94', and only `females' records are included.
Question (4):
`What type of analysis do you want to perform?'
`For which variables do you want to produce the analysis selected above?' `For which sub-groups do you want to produce the analysis selected above?'
Table 1
Physical locations of a set of the databases
Database type Physical location (directory)
Medicare Phrudat:[meddat]
Pharmacare Phrudat:[pharmdat]
Hospital (ASD) Phrudat:[asddat]
The SAS statements are:
PROCprocedurename [DATAdatasetname]; ± Translation (4)
(SAS statements, which depend on the procedure)
RUN;
where procedurename is the name of the procedure to be used, datasetname is the name of the dataset on which analyses are going to be performed. Other additional statements give the SAS system more information, such as CLASS, VAR, TABLE, and TITLE statements, etc. These statements are placed between PROC statement and RUN statement.
The SAS system has many built in procedures. In the following, we use three examples to illustrate the translation of analysis queries.
MEANS: If the user chooses `MEANS' analysis type, and selects corresponding variables and
sub-groups, then the information is translated into the SAS code:
PROC MEANS;
VARvariable list;
CLASSvariable list;
RUN;
MEANS procedure gives a concise summary of the data. The default statistics computed by the MEANS procedure are N, the number of observations having non-missing values for the variables; MIN, the minimum value; MAX, the maximum value; MEAN, the mean; SUM, the sum of all values; and STD, the standard deviation. Other statistics can be requested in the PROC MEANS statement. Variables listed in VAR statement specify the variables for which statistics are computed. CLASS statement tells the SAS system to compute statistics separately for categories of observations, that means the user can de®ne sub-groups of the data.
FREQ: It is one of the most frequently used statistical application procedures provided by the SAS
system. It is used to count the number of observations in each category. When the user selects this analysis type and speci®es the variable whose value identi®es the categories of observations, the information is translated into:
PROC FREQ;
TABLESvariable list;
RUN;
CORR:When two different variables measure similar characteristics, the values of those variables may mirror each other (thecorrelation association). As the values of one variable increase, the values of an associated variable tend to increase or decrease.
A single coef®cient is used to indicate the direction and the strength of the relationship between two variables, and it ranges fromÿ1 to 1. A negative value means that as one variable becomes larger, the other tends to become smaller. A positive number means both variables tend to go in the same direction. The query request of correlation analysis can be translated into the SAS code:
PROC CORR;
VARvariable lists;
RUN;
The CORR procedure computes correlation coef®cients for all combinations of variables listed in the VAR statement.
An example of the translation result is shown in Fig. 7 which was mapped from the query de®ned in Figs 4 and 5.
4.3. Implementation tools
When choosing the implementation tools, one needs to consider not only the current technologies available in the market, the existing system, the design and implementation strategies, the future plan, but also other realistic factors, such as the funding of the project, etc. In developing this Web-based query system, we use Java applets to make all graphical user interfaces and to generate SAS code on the client side, and use Java URL to implement networking functions.
We use CGI as a mediator between the Web Server and other programs which accept, at runtime, command-line input (for example, standard input, stdin, or environmental variables). Once data has
been collected, it will be transmitted to a CGI program using the HTTP POST method. Because the CGI program is on the Web sever which is the home of the applet, the applet can process the results directly. The script language Perl is used for CGI programming. Perl is an interpreted language; therefore, it is simple for developing, debugging, and revising applications. In addition, Perl has a rich and capable functionality.
5. Conclusions
This paper presents a new type of computer interface to large health-care data repositories via the Internet. The prototype system bypasses the bottleneck of programming in SAS by providing a constraint-driven front-end that captures the users' information needs and generates SAS programs automatically. The three-tier architecture of the system also provides a full administration package for the registration and management of users and two layers of security. A fully-developed PHRU information retrieval system will also include data-mining tools and data visualization options, which would provide a more comprehensive and ef®cient on-line decision support system for health care researchers and administration planners. Further, the proposed system can be easily mapped to other application domains which have similar sittings.
Acknowledgements
The authors thank the PHRU group for access to their data and their time in working with us. We would also like to thank the other computer science graduate students in the team who have collaborated on this project.
References
Dolgicer, M. 1998. Middleware at the Crossroads, http://www.isg-inc.com/index.html.
International Systems Group, Inc. Middleware, 1998. The Essential Component for Enterprise Client/Server Applications, http://www.openvms.digital.com/openvms/whitepapers/middleware/isgmidware.html.
Orfali, R., Harket, D., 1998.Client/Server Programming with Java and CORBA. John Wiley & Sons, Canada. Population Health Research Unit (PHRU), 1998. http://www.mcms.dal.ca/gorgs/phru/index.html.
Sadoski, D., 1998a. Client/Server Software ArchitecturesÐAn Overview, http://www.sei.cmu.edu/str/descriptions/clientser-ver_ body.html.
Sadoski, D., 1998b. Three Tier Software Architectures, http://www.sei.cmu.edu/str/descriptions/threetier.html#34492. SAS Institute Inc., 1999. http://www.sas.com.
Smith, M., Kephart, G. 1998. Proposal for a GUI-based Non-Programmable Interface to Administrative Data, PHRU proposal report, Dalhousie University.