METHODS FOR MULTIMODAL ANALYSIS AND
REPRESENTATION OF TEACHING–LEARNING
INTERACTIONS IN PRIMARY SCIENCE LESSONS
CAPTURED ON VIDEO
Mark Hackling1, Karen Murcia1, Khadeeja Ibrahim-Didi1 and Susan Hill1
1
Edith Cowan University, Edith Cowan Institute for Education Research, Perth, Western Australia
Abstract: Video-based classroom research is opening-up exciting new insights into how teachers generate productive opportunities for student engagement in quality learning, reasoning and the development of their scientific literacy. The significant role played by multimodal representations in learning and teaching becomes evident through the medium of video and its analysis. Classroom research that is framed from social constructivist,
sociocultural, activity theory and social semiotic perspectives highlights the social
interactions involving multimodal representations which are used to communicate science ideas and also act as semiotic resources for meaning making. Social and cognitive processes of co-constructing meaning are mediated by talk, embodied representations such as gesture and role play, graphical and textual representations. Video offers unique affordances to capture the multimodality of these representations and interactions (Flewitt, 2006), however, new methods of documenting, transcribing and re-representing such data are needed to capture the rich multimodality of the data (Bezemer & Mavers, 2011). This paper outlines research methods developed to analyse and represent classroom video data collected in a study of primary science teaching and learning funded by the Australian Research Council. Keywords: video ethnography, research methods, video data analysis
INTRODUCTION
For those researching the nuances of the complex interactions and representations that mediate teaching and learning, video offers rich affordances with its capacity to capture the multimodality of these processes (Flewitt, 2006) and enables researchers to investigate phenomena in more powerful ways. Video-based classroom research poses a number of challenges including issues of time and costs of capturing quality video and conducting analyses. Erickson (2006) and others caution researchers that video data are not objective and need careful interpretation taking into account the full range of contextual factors and
perspectives. Derry et al. (2011) highlight challenges associated with making decisions about selecting samples of video for analysis and analytical frameworks and processes. Despite these challenges many large scale and international studies are generating video case studies which provide rich descriptions of teaching and learning and we have seen the emergence of video ethnography (Fitzgerald, Hackling & Dawson, 2013) which provides rich
documentation of classroom cultures and practices.
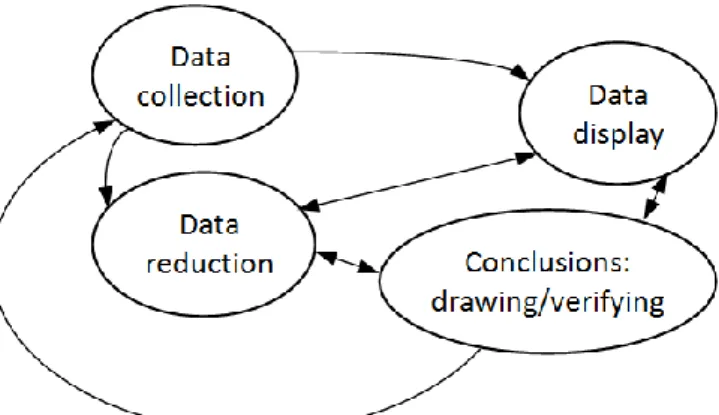
As Miles and Huberman (1994) have argued, data analysis involves an interactive process between data reduction, data re-representation and the development and validation of assertions (see Figure 1).
Figure 1. An interactive model of data analysis (Miles & Huberman, 1994, p. 12)
This paper describes the methods developed to analyse Australian case studies of primary science teaching as part of the larger international Equalprime project. The analysis
commenced with a broad overview taking into account the context of the case and then the patterns of teaching and learning in the sequence of lessons. This work requires data
reduction and re-representation and helps provide the contextual overview which guides the selection of teaching-learning episodes that are worthy of much closer analysis. Data
sampling therefore becomes a significant aspect of video analysis.
THEORETICAL FRAMING OF VIDEO-BASED CLASSROOM
RESEARCH
The Equalprime project has a focus on exploring the ways in which teachers create rich opportunities for higher order thinking and reasoning in primary science classes, and the ways in which this is achieved within different cultural settings. The wider team of
researchers hold a broadly sociocultural view of learning which takes account of the ways in which various forms of representation created by both teachers and students are powerful mediators of learning and have particular meanings within a given classroom culture (Lemke, 1998; Vygotsky, 1978). It is recognised that within the primary science contexts of our case studies, material objects as well as symbolic and embodied representations all act as semiotic resources from which meaning is constructed, represented and communicated; teachers and students are immersed within a highly multimodal milleu (Kress, 2010). Both material objects and other representations can also be considered tools that mediate learning within an activity system (Engestrom, 2001) in which teachers and students play particular roles shaped by division of labour, rules and culture. In these settings teachers need rich pedagogical content knowledge to orchestrate a range of multimodal representations with explicit pedagogical links between them to support student meaning making (Hackling, Murcia & Ibrahim-Didi, 2013; Scott, Mortimer & Ametller, 2011). The affordances of video enable researchers to capture a detailed, permanent and multimodal record of teaching and learning which poses a number of challenges for data sampling, reduction, re-representation, and for choice of analytical frameworks.
Our research which is guided by broad questions takes an inductive or whole-to-part approach (Derry et al., 2010; Erickson, 2006) to analysis which begins by considering the
whole body of video data to identify major events and themes, and then progressively focuses on particular events in greater detail. The emerging themes are then interpreted within the theoretical framing of the study to generate assertions about teaching, learning and culture.
DATA REDUCTION AND RE-REPRESENTATION
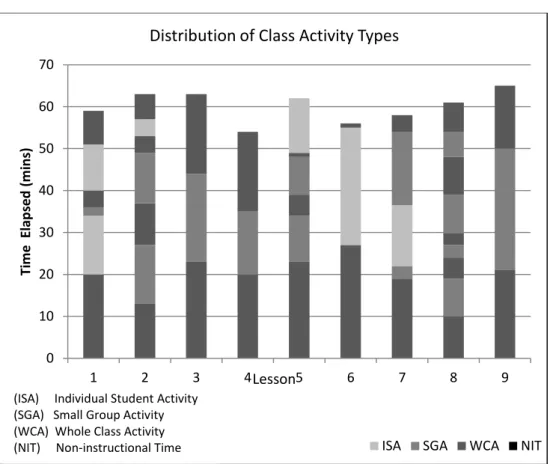
Data reduction refers to the “process of selecting, focusing, simplifying, abstracting and transforming” the rich and complex data sets typical of qualitative research (Miles & Huberman, 1994, p. 10). In the initial phases of analysis of our video case studies we have found it useful to document the instructional settings employed by the teacher, the sequence in which they are used and the time devoted to each instructional setting. By re-representing these data as a stacked column graph, broad patterns of teaching-learning activity can be identified and assertions can be developed regarding the teacher’s use of instructional time (see Figure 2). For example, in this case the teacher uses a mix of whole class, small group and individual student activity with almost no non-instructional time. Almost all lessons commence and conclude within a whole-class instructional setting and include some small group activity.
This data re-representation has been most helpful in comparing teaching and learning across cultures and revealing the prominence of small group work in Australian case studies, whole class instruction in Taiwanese cases and individual student activity in German cases.
Figure 2. Distribution of various instructional settings throughout the nine lessons of a primary science topic
0 10 20 30 40 50 60 70 1 2 3 4 5 6 7 8 9 Ti m e E lap sed (m in s) Lesson
Distribution of Class Activity Types
ISA SGA WCA NIT (ISA) Individual Student Activity
(SGA) Small Group Activity (WCA) Whole Class Activity (NIT) Non-instructional Time 2mins
These re-representations or intermediate representations of simplified, abstracted and reframed data have proved to be very effective for both identifying and communicating significant characteristics of the teaching and learning practices and also provided a context from which decisions could be made about the parts of the corpus of video to be selected for more detailed analysis.
DATA SAMPLING
Given the typical 16-20 hours of video collected for our Australian video case studies,
episodes or events have to be selected for more detailed analysis. The selection of episodes is driven by the aims of the research, and the analysis and interpretation of the episodes is necessarily influenced by the theoretical framing of the research. A sequence of episodes may be selected if the purpose of the research is to track students’ learning through a lesson or lesson sequence.
In the Australian primary science case studies, the research purpose was to identify situations in which teachers created rich opportunities for higher order thinking and reasoning in
science. The criteria used to select episodes related to teaching effectiveness in terms of high levels of student engagement in scientific thinking and reasoning. Given the age of the students and their dependence on multimodal representations and communication, these episodes of effective teaching often involved rich multimodality which enabled the research team to draw heavily on sociocultural theory and Gunther Kress’ (2010) multimodal semiotic theory for data interpretation. The selection of individual lessons or episodes within a lesson for detailed analysis were often guided by a teacher’s particularly effective use of discourse, orchestration of representations or embodiment as means of creating rich opportunities for reasoning and learning. For example, in Grace’s case study (Figure 2), in the first 20 minutes of lesson 4 she utilised a sequence of verbal, graphical and embodied semiotic resources to support student meaning making which revealed complex skills of orchestration and pedagogical link-making worthy of in-depth analysis (Hackling, Murcia & Ibrahim-Didi, 2013). Links were made by the teacher between representations used sequentially and across ensembles of modalities used concurrently.
MUTIMODAL TRANSCRIPTION
As Bezemer and Mavers (2011) explain, the rich multimodality of the video data has required the development of new methods of multimodal transcription and as yet no standard
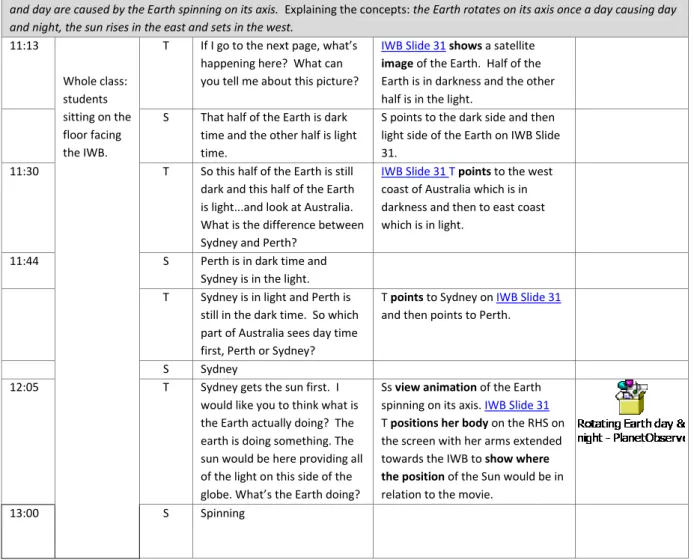
conventions have been established by which audio, visual and embodied data can be re-represented. Carey Jewitt (2009) highlights the importance of investigating intersemiotic relationships within multimodal records of teaching and learning to better understand how meaning is communicated, represented and made. A significant challenge for the Australian case study research was therefore a capacity to construct accounts of events in ways that captured the multimodality of the data and provided a capacity to work between transcripts of discourse, and view video clips of classroom activity and images, videos and interactives utilised by the teacher on an interactive whiteboard. It became necessary to develop multimodal transcriptions that include contextual information, time stamps, transcripts of discourse, descriptions of semiotic resources such as gestures, role plays, images and
manipulations of equipment, and images and short video clips embedded into the multimodal transcript (see Figure 3). The digital format enabled the researchers to open digital
representations of multimodal objects and processes and view them whilst reading the transcriptions of discourse and description of how gestures were being used.
This multimodal transcript modality (Figure 3) extends the matrix style utilised by Baldry and Thibault (2006) which combined still photos with descriptions of body movements and language used, by embedding digital images and film clips that can be opened and played. The inclusion of video clips helps address the challenge of combining the use of language and other visual, spatial and temporal elements, but not the perceptual difficulties that arise when attempting a simultaneous reading (Flewitt, Hampel, Hauck & Lancaster, 2009). As publishing media evolve with increased digitisation it is anticipated that some of these representational challenges will be addressed through hyperlinking of images and video clips into the multimodal texts of journal articles.
TIME
(mins)
CLASSROOM
SETTING SPEAKER UTTERANCE OTHER SEMIOTIC RESOURCES VIDEO CLIP
Episode 4
Teacher uses a diagram of Australia and a satellite image (static and spinning) of the Earth on the IWB to represent, how night and day are caused by the Earth spinning on its axis. Explaining the concepts: the Earth rotates on its axis once a day causing day and night, the sun rises in the east and sets in the west.
11:13 Whole class: students sitting on the floor facing the IWB.
T If I go to the next page, what’s happening here? What can you tell me about this picture?
IWB Slide 31shows a satellite
image of the Earth. Half of the Earth is in darkness and the other half is in the light.
S That half of the Earth is dark time and the other half is light time.
S points to the dark side and then light side of the Earth on IWB Slide 31.
11:30 T So this half of the Earth is still dark and this half of the Earth is light...and look at Australia. What is the difference between Sydney and Perth?
IWB Slide 31 Tpoints to the west coast of Australia which is in darkness and then to east coast which is in light.
11:44 S Perth is in dark time and
Sydney is in the light. T Sydney is in light and Perth is
still in the dark time. So which part of Australia sees day time first, Perth or Sydney?
T points to Sydney on IWB Slide 31
and then points to Perth.
S Sydney
12:05 T Sydney gets the sun first. I
would like you to think what is the Earth actually doing? The earth is doing something. The sun would be here providing all of the light on this side of the globe. What’s the Earth doing?
Ss view animation of the Earth spinning on its axis. IWB Slide 31
T positions her body on the RHS on the screen with her arms extended towards the IWB to show where the position of the Sun would be in relation to the movie.
13:00 S Spinning
There is a need to acknowledge that such transcripts are in many ways partial in that they only document a sample of the rich data, they are data reductions, re-representations and interpretations of the raw data and that transcription is a theory-laden decision-making process so that these multimodal transcripts are in no sense a complete or ‘verbatim’ record of the events (Skukauskaite, 2012). As Flewitt et al. (2009, p. 45) note, transcripts are “reduced versions of observed reality, where some details are prioritised and others are left out”. The processes of transcription and interpretation need to be theoretically coherent.
COLLABORATIVE MICRO-ETHNOGRAPHIC ANALYSIS
Once episodes had been selected and multimodal transcripts developed to document the episodes, the research team met to view the video clips, work with the transcriptions and collectively conduct an analysis of an episode using a collaborative form of ethnographic microanalysis (Erickson, 2006). The team of researchers repeatedly viewed a video sequence, reviewed multimodal transcripts, identified significant actions, processes, representations and links between them. Given the researchers’ different theoretical and pedagogical
commitments, initially, each researcher typically focussed on a particular aspect of the teaching and learning exemplified by the video data. For example, one researcher would see aspects of discourse being highly significant to making sense of the teaching-learning process while another researcher would identify embodied representations as being significant. Researchers would ‘notice’ an aspect of pedagogy as being salient and then interpret and reason through the meaning and significance of that which had been noticed. With repeated viewing of the video clip and careful scrutiny of other evidence, consensus between
researchers emerged as to the themes and relationships in the data and how the effectiveness of the teaching and learning practices could be best explained. By triangulating and
aggregating the perspectives afforded by the professional vision (Sherin & van Es, 2009) of the different researchers, much richer documentation and analysis of practice emerged, and perhaps more credible data interpretations made than would be possible from an analysis conducted by a single researcher.
The Equalprime case studies of primary science teaching capture the perspectives of the teacher and students through pre and post-lesson interviews with the teacher and post-lesson debriefs with focus group students some of which are video stimulated discussions. There are questions to be explored about the role that the classroom teacher and students play in
member checking data interpretations to enhance credibility of findings (Janesick, 2000) and what relationship there is between these participants giving ‘voice’ within the research, providing data, assisting with data interpretation as co-researchers, and/or acting as member checkers of data interpretations.
SIGNIFICANCE
The introduction of video data collection represents revolutions in classroom research methodology, however, there are a number of methodological issues and challenges facing researchers in this rapidly expanding field of video ethnography. This research study has developed and elaborated a number of research methods that can be effectively applied to the analysis of classroom video data and makes particular contributions to issues related to sampling, methods of analysis and re-representing data to support analysis and to
communicate findings. The methods of collaborative micro-ethnographic analysis developed in this study extend Erickson’s (1992) methods to address the complexities in analyzing video cases which can be viewed from different perspectives because of the various
theoretical commitments of researchers that influence their professional vision and capacity to see significant aspects of teaching and learning practices. The methods of multimodal transcription of teaching and learning extend the methods currently employed in social research (Bezemer & Mavers, 2011). Given the multimodal nature of video data the necessity for intermediate re-representations of data have been shown to be critical for data reduction, analysis and communication. As noted by Miles and Huberman (1994), there is an interactive and interdependent relationship between data sampling, data reduction, data re-representation and data interpretation. For multimodal data, these interactions are more complex given the difficulties of adequately representing the relationships amongst the assemblages of semiotic resources utilized in teaching and learning.
NOTES
We would like to acknowledge: the Australian Research Council for funding (DP110101500) the Equalprime research project; Barbara Sherriff’s support with data analysis; and, our collaborators at Deakin University (Russell Tytler, Peter Hubber and Gail Chittleborough), the Free University of Berlin (Joerg Ramseger), the National Taipei University of Education (Chao-Ti J Hsiung) and the National Taiwan Normal University (Hsiao-Lan S Chen).
REFERENCES
Baldry, A., & Thibault, P. (2006). Multimodal transcription and text analysis. London: Equinox.
Bezemer, J., & Mavers, D. (2011). Multimodal transcription as academic practice: A social semiotic perspective. International Journal of Social Research Methodology, 14(3), 191-206
Derry, S. J., Pea, R. D., Barron, B., Engle, R. A., Erickcon, F., Goldman, R., . . . Sherin, B. L. (2010). Conducting video research in the learning sciences: Guidance on selection, analysis, technology and ethics. Journal of the Learning Sciences, 19(1), 3-53. Engestrom, Y. (2001). Expansive learning at work: Toward an activity theory
reconceptualization. Journal of Education and Work, 14(1), 133-156. Erickson, F. (2006). Definition and analysis of data from videotape: Some research
procedures and their rationales. In J. L. Green, G. Camilli & P. B. Elmore (Eds.), Handbook of complementary methods in education research (pp. 177-205). Mahwah, NJ: Erlbaum.
Fitzgerald, A., Hackling, M., & Dawson, V. (2013). Through the viewfinder: Reflecting on the collection and analysis of classroom video data. International Journal of
Qualitative Methods, 12, 52-64. Retrieved from
http://ejournals.library.ualberta.ca/index.php/IJQM/index
Flewitt, R. (2006). Using video to investigate preschool classroom interaction: education research assumptions and methodological practices. Visual Communication, 5, 25-50.
Flewitt, R., Hampel, R., Hauck, M., & Lancaster, L. (2009). What are multimodal data and transcription? In C. Jewitt (Ed.), The Routledge handbook of multimodal analysis (pp. 40-53). Milton Park, Abingdon: Routledge.
Hackling, M., Murcia, K., & Ibrahim-Didi, K. (2013). Teacher orchestration of multimodal resources to support the construction of an explanation in a Year 4 astronomy topic. Teaching Science, 59(1), 7-15.
Janesick, V. J. (2000). The choreography of qualitative research design. In N. K. Denzin & Y. S. Lincoln (Eds.) Handbook of qualitative research (2nd ed.) (pp. 379-399). Thousand Oaks, CA: Sage.
Jewitt, C. (2009). An introduction to multimodality. In C. Jewitt (Ed.), The Routledge handbook of multimodal analysis (pp. 14-27). Milton Park, Abingdon: Routledge. Kress, G. (2010). Multimodality: A social semiotic approach to contemporary
communication. Milton Park, Abingdon: Routledge.
Lemke, J. L. (1998). Multiplying meaning: Visual and verbal semiotics in scientific text. In J. R. Martin & R. Veel (Eds.), Reading science (pp. 87-113). London: Routledge. Miles, M. B., & Huberman, A. M. (1994). Qualitative data analysis: An expanded
sourcebook (2nd ed.). Thousand Oaks, CA: Sage.
Scott, P., Mortimer, E., & Ametller, J. (2011). Pedagogical link-making: A fundamental aspect of teaching and learning scientific conceptual knowledge. Studies in Science Education, 47(1), 3-36.
Sherin, M. G., & van Es, E. A. (2009). Effects of video club participation on teachers' professional vision. Journal of Teacher Education, 60(1), 20-37.
Skukauskaite, A. (2012). Transparency in transcribing: Making visible theoretical bases impacting knowledge construction from open-ended interview records. Forum: Qualitative Social Research, 13(1), Art. 14. Retrieved from http://www.qualitative-research.net/index.php/fqs/issue/view/39
Vygotsky, L.S. (1978). Mind in society: The development of higher psychological processes. Cambridge, MA: Harvard University Press.