Open Research Online
The Open University’s repository of research publications
and other research outputs
Body size and weight, and the nutrition and activity
behaviors of sexual and gender minority youth:
Findings and implications from New Zealand
Journal Item
How to cite:
Lucassen, Mathijs; Guntupalli, Aravinda; Clark, Terryann; Fenaughty, John; Denny, Simon; Fleming, Theresa; Smith,
Melody and Utter, Jennifer (2019). Body size and weight, and the nutrition and activity behaviors of sexual and
gender minority youth: Findings and implications from New Zealand. Public Health Nutrition, 22(13) pp. 2346–2356.
For guidance on citations see FAQs.
c
2019 The Authors
Version: Version of Record
Link(s) to article on publisher’s website:
http://dx.doi.org/doi:10.1017/S1368980019001149
Copyright and Moral Rights for the articles on this site are retained by the individual authors and/or other copyright
owners. For more information on Open Research Online’s data policy on reuse of materials please consult the policies
page.
Body size and weight, and the nutrition and activity behaviours
of sexual and gender minority youth: findings and implications
from New Zealand
Mathijs FG Lucassen
1,2,*, Aravinda Meera Guntupalli
1, Terryann Clark
3,
John Fenaughty
4, Simon Denny
5, Theresa Fleming
2,6, Melody Smith
3and Jennifer Utter
71School of Health, Wellbeing and Social Care, Faculty of Wellbeing, Education and Language Studies, The Open
University, Walton Hall, Milton Keynes MK7 6AA, UK:2Department of Psychological Medicine, Faculty of Medical and
Health Sciences, University of Auckland, Private Bag 92019, Auckland 1142, New Zealand:3School of Nursing,
Faculty of Medical and Health Sciences, University of Auckland, Auckland, New Zealand:4School of Counselling,
Human Services and Social Work, Faculty of Education and Social Work, University of Auckland, Auckland, New Zealand:5Department of Paediatrics, Child and Youth Health, Faculty of Medical and Health Sciences,
University of Auckland, Auckland, New Zealand:6School of Health, Faculty of Health, Victoria University of
Wellington, Wellington, New Zealand:7School of Population Health, Faculty of Medical and Health Sciences,
University of Auckland, Auckland, New Zealand
Submitted 25 October 2018: Final revision received 4 February 2019: Accepted 4 March 2019
Abstract
Objective:To describe the body size and weight, and the nutrition and activity behaviours of sexual and gender minority (SGM) students and compare them with those of exclusively opposite-sex-attracted cisgender students. Male and female SGM students were also compared.
Design:Data were from a nationally representative health survey.
Setting:Secondary schools in New Zealand, 2012.
Participants:A total of 7769 students, 9 % were SGM individuals.
Results: Overall, weight-control behaviours, poor nutrition and inactivity were common and, in many cases, more so for SGM students. Specifically, male SGM students (adjusted OR; 95 % CI) were significantly more likely to have tried to lose weight (1·95; 1·47, 2·59), engage in unhealthy weight control (2·17; 1·48, 3·19), consume fast food/takeaways (2·89; 2·01, 4·15) and be physically inactive (2·54; 1·65, 3·92), and were less likely to participate in a school sports team (0·57; 0·44, 0·75), compared with other males. Female SGM students (adjusted OR; 95 % CI) were significantly more likely to engage in unhealthy weight control (1·58; 1·20, 2·08), be overweight or obese (1·24; 1·01, 1·53) and consume fast food/takeaways (2·19; 1·59, 3·03), and were less likely to participate in a school sports team (0·62; 0·50, 0·76), compared with other females. Generally, female SGM students were more negatively affected than comparable males, except they were less likely to consume fast food/takeaways frequently (adjusted OR; 95 % CI: 0·62; 0·40, 0·96).
Conclusions:SGM students reported increased weight-control behaviours, poor nutrition and inactivity. Professionals, including public health nutritionists, must recognize and help to address the challenges facing sexual and gender minorities.
Keywords
Adolescent Lesbian, gay, bisexual
and transgender Exercise Eating disorders Obesity
Health research and lesbian, gay, bisexual and transgender people
Historically there has been a lack of research focused on the health and well-being of sexual and gender minority (SGM) individuals, such as lesbian, gay, bisexual and transgender (LGBT) people and those questioning their
sexuality or gender(1). Between 1989 and 2011, for
exam-ple, projects focused on LGBT health comprised only 0·5 % (n628) of all studies funded by the primary agency of the US government responsible for health research (the National Institutes of Health)(2). Of these, only 9·7 %
of funded LGBT projects (n61) explicitly included people
under 18 years of age(2). Furthermore, most international
studies (of both adults and young people) in the field of LGBT health have relied upon convenience-based sam-ples(3–5)or population-based surveys that are limited in size
or geographic scope(5). However, the available
population-based data suggest numerous disparities between SGM youth and their peers who are heterosexual or exclusively opposite-sex-attracted and experience congruence between their gender identity and natal sex (hereafter‘heterosexual cisgender youth’for brevity). Such disparities are particu-larly apparent in the area of youth mental health. For in-stance, there is now robust international evidence that sexual minority youth are at an elevated risk of depressive symptoms or depressive disorder(6), with risk particularly
elevated among females as compared with males(6). The
population-based studies of gender-diverse adults and young people published to date have also consistently doc-umented a high prevalence of adverse health outcomes(7).
From a theoretical standpoint, Meyer’s minority stress model has been widely cited to explain the high rates of health issues experienced by SGM individuals(8).
According to the model, the mistreatment and resulting distress that LGBT people experience increase their risk for a range of negative health outcomes(9–11).
Body size and weight, and the nutrition and activity behaviours of lesbian, gay, bisexual and transgender youth
One area of disparity in health that has had relatively little investigation concerns body size, weight, nutrition and physical activity and LGBT young people. A systematic review of research (to July 2017) exploring weight-control behaviours, eating habits, BMI and physical activity among sexual minority youth(12)highlighted that little research in
the field has been conducted outside the USA and that only one cited study included transgender individuals(13).
Also apparent were several key differences or variations between male and female sexual minority youth(12). For
example, the majority of studies (fifteen out of seventeen) reported no differences in BMI between sexual minority and heterosexual males(12), whereas, in line with earlier work focused on adults, sexual minority females were shown to be at greater risk of being overweight or obese than heterosexual females(11,12,14).
Body size and weight are affected by a young person’s diet, but the few studies that have explored differences in dietary intake by sexual orientation have primarily assessed fruit and vegetable consumption(15). While female sexual
minority youth in the USA report higher BMI than their heterosexual peers(11), results from the Youth Risk Behavior Survey (YRBS) highlighted that sexual minority youth as a group were more likely to meet recommendations for fruits and vegetables compared with heterosexual youth(16). This finding may reflect that, irrespective of
sexuality, very few students in that study (<7 %) actually con-sumed‘5+ fruits & vegetables’daily(16). Another study from
the USA(17)found no significant differences in fruit and
veg-etable consumption between lesbian, bisexual and sexuality-questioning female college students and their heterosexual peers, while noting that sexual minority students were signifi-cantly heavier. This may be explained in part by the fast-food consumption behaviours of sexual minority youth, another understudied area. Indeed, one large longitudinal US study found that female sexual minority youth con-sumed significantly more fast food than heterosexual females, while male sexual minority youth consumed sig-nificantly less fast food than heterosexual males(18).
Another factor that may influence the nutrition of LGBT young people is participation in family meals. Generally speaking, young people who eat with their family five or more times per week are likely to consume more fruit and vegetables and have better eating habits than those who do not(19,20). Research indicates that SGM youth are
less likely to get along with their family(21,22), which could
reduce the likelihood of shared family meals.
BMI is also affected by physical activity and other weight-control behaviours, and the BMI differences noted in relation to SGM young people may reflect disparities in such behaviours. For instance, sexual minority young people report less physical activity and sporting engage-ment(12,23)than heterosexual controls. Results from a study
of over 12 000 youth aged 12–22 years (the Growing Up Today Study (GUTS)) indicated that sexual minority partic-ipants were significantly less likely to engage in physical activity and participate in team sports than heterosexual youth(23). Some young people also engage in unhealthy
methods of weight control, including restrictive dieting, purging and using diet pills(10,12). The large-scale YRBS in the USA indicated an elevated risk of unhealthy weight-control behaviours among male and female sexual minority youth, relative to their heterosexual peers(10). However, a gender pattern has emerged across studies in this area. Whereas sexual minority males show a consistently elevated risk of unhealthy weight-control methods in com-parison with heterosexual males, there is a less consistent pattern of differences in these behaviours between sexual minority and heterosexual females(12).
Developmental factors and lesbian, gay, bisexual and transgender youth
Research exploring the challenges relevant to the health of LGBT youth is needed, as studies conducted among LGBT adults cannot always be generalized. As such, it is impor-tant to consider how sexual orientation and gender identity are defined, since this requires an appreciation of several factors, including developmental considerations. In rela-tion to sexuality, most high-school students in a range of Western countries report that they have not had sexual
intercourse(24); in New Zealand (NZ), fewer than
one-quarter of high-school students reported ever having had sex(25). It is therefore unsuitable to use sexual behaviour
as the main means of determining an adolescent’s sexua-lity. After reviewing school-based health surveys, Saewyc and colleagues instead suggested that if a health and well-being survey could only include one item about sexuality, this should ask about sexual attraction(26).
Contrary to this recommendation, those researching LGBT young people’s weight-control behaviours, eating habits, BMI or physical activity have not routinely used sexual attraction as a measure in studies that included a heterosex-ual referent group. Instead, they have often used sexheterosex-ual identity and/or sexual behaviour to determine sexual-ity(10,27–30). Despite this lack of consistency in defining
sexuality, comparisons across studies remain possible as, irrespective of how sexuality is established, same-sex attraction and sexual attraction to more than one gender are highly correlated with sexual behaviour that is not exclusively heterosexual and self-identification as lesbian, gay or bisexual(31). To date, transgender and other gender
minority individuals (i.e. those youth whose gender iden-tity and natal sex differ and those that do not identify with a male/female binary) are largely excluded from popula-tion-based surveys. For example, in their 2016 review of the health burden and needs of transgender populations internationally for a special issue ofThe Lancet, Reisner and colleagues noted‘a dearth of research about transgen-der children, adolescents, and young people’(7) (p. 422).
Encouragingly, the period following publication of that review has seen a rapid increase in population-based studies of gender-diverse young people, especially in research from North America in the field of mental health(32–35).
The current study
In order to move towards health equality for SGM young people, robust data are needed. While aspects of inequal-ities between LGBT and heterosexual cisgender individuals are well documented in the international literature, far less is known about such inequalities in NZ(36). A 2017 review of
research on LGBT health in NZ concluded that the focus has largely been on gay men’s sexual health, primarily in relation to HIV(36) – this is understandable given the
sizeable challenges that remain around HIV prevention and ensuring timely HIV diagnoses in NZ(37). To date,
there has been no population-based research conducted in Australasia to explore the weight-control behaviours, eating habits, BMI and physical activity levels of LGBT youth compared with those of their heterosexual cisgender peers(12). Additionally, prior population-based research in
this area has not included gender minority youth under 18 years of age. To the best of our knowledge, only two studies have included gender-diverse young people, but this has been for research conducted with college-aged
students in the USA(13,38). Given the lack of local and
gender-diverse-inclusive research in this field, the aim of the current study was to determine, using robust, nationally representative data, whether SGM secondary-school students in NZ differ in regard to body size and weight, nutrition and activity behaviours by sex compared with heterosexual cisgender students. We studied a range of salient factors selected for their potential synergistic effects and their role as risk factors for chronic health issues(39),
such as BMI, because NZ has persistently high rates of ado-lescents being overweight and obese(40). We investigated
differences in outcomes between male and female students, as prior work conducted with young people gen-erally in NZ(41)and internationally has highlighted
consid-erable sex variations in a range of these phenomena. We also compared male and female SGM students, as a sys-tematic review and meta-analysis in the field of LGBT youth mental health has previously highlighted significant differences(6). We hypothesized that SGM students in NZ
would have higher odds of adverse health outcomes than heterosexual cisgender youth, in line with the almost exclu-sively USA-based research on these topics to date.
Methods
Youth’12 is a cross-sectional, self-administered question-naire, conducted with a representative sample of NZ secondary-school students in 2012. In total, 125 schools were randomly selected to participate. Of these, ninety-one schools (73 %) took part and 8500 students (68 %) participated. The University of Auckland Human Participants Ethics Committee granted ethical approval for the study (ref. 2011/206). Students completed the sur-vey at school using multimedia, computer-assisted, self-interviewing technology on Internet-enabled tablets(42).
Questions were presented in English and te reo Māori (the indigenous language of NZ) text, which was read out loud via a voice-over (students could hear only the voice-over for their own survey on individualized head-phones). To ensure students’ privacy, the survey was administered in locations such as their school hall or gymnasium, seating was arranged to ensure sufficient distance between students and no school staff were present. Detailed descriptions of the survey methods are available elsewhere(24) (see also http://www.fmhs.
auckland.ac.nz/faculty/ahrg/).
Measures
Demographic information
At the beginning of the survey, participants were asked
‘What sex are you?’ (with the response options of‘male’ or‘female’ only) and their age in years. The number of SGM participants by age group (e.g. 13 years or younger, 14 years, 15 years, 16 years and 17 years or older) was
small, therefore age was categorized as above or below 16 years (in NZ students can leave school from the age of 16 years). Students indicated their ethnic group(s) using the NZ Census standard 2001/2006 ethnicity questions(43).
Those who chose more than one ethnicity were assigned a single ethnic group, based on the Statistics NZ ethnicity prioritization method(44). Hence, for data analyses,
ethnic-ity was grouped as European, Māori, Pacific, Asian and
‘Other’ ethnicity. Socio-economic deprivation was mea-sured using the NZ Deprivation Index (NZDep2006)(45)
for the census area unit in which the student lived. NZDep2006 combines eight dimensions of deprivation derived from the NZ Census(45). For data analyses, students
were grouped into one of three deprivation bands indicat-ing low (NZ Census deprivation deciles 1–3), medium (deciles 4–7) and high (deciles 8–10) levels of deprivation. Sexuality was determined by the question‘Who are you sexually attracted to?’(response options:‘the opposite sex’,
‘the same sex’,‘both sexes’,‘I’m not sure’,‘neither’and‘I don’t understand this question’). Whether a student was transgender was determined by the question‘Do you think you are transgender? This is a girl who feels like she should have been a boy, or a boy who feels like he should have been a girl (e.g. Trans, Queen, Fa’afafine, Whakawahine, Tangata ira Tane, Genderqueer)?’ (response options:
‘yes’,‘no’,‘not sure’and‘I don’t understand this question’). Students were categorized as heterosexual cisgender if they reported being sexually attracted to the opposite sex and that they were not transgender. Students were categorized as SGM youth if they were sexually attracted to the same sex, both sexes or not sure of their sexual attrac-tion/s, or if they were transgender or not sure if they were transgender. The‘not sure’students were thus categorized as prior research indicates that their mental health and psychosocial needs are similar to those of other SGM youth(3,21). Students were excluded if they did not answer
the sexual attraction question or the question asking if they were transgender, or if they responded‘I don’t understand this question’to either item.
Weight control, unhealthy weight control and BMI
Students were categorized as having‘tried to lose weight’if they answered‘yes’to the question ‘In the last 12 months have you ever tried to lose weight?’. Students who had tried to lose weight were categorized as using‘unhealthy weight control’if they answered‘yes’to one or more of the following weight-loss strategies in the past 12 months: (i)‘I fasted or did not eat for more than a day’; (ii)‘I skipped one or more meals a day’; (iii)‘I smoked cigarettes’; (iv)‘I took diet pills or other pills’; or (v)‘I made myself vomit’. These five items were used as prior research identifies them as‘red flags’for unhealthy weight control(46) and there is growing concern about
weight-control behaviours among NZ young people(40).
Trained research staff measured each student’s height and weight individually behind privacy screens, using portable digital scales and stadiometers. Students wore light clothing
and no shoes. These measurements were used to calculate BMI as [weight (kg)]/[height (m)]2. BMI categories
(i.e. underweight, healthy weight, overweight and obese) were determined using the age- and sex-specific BMI cut-offs established by Cole and Lobstein(47).
Diet, physical activity and participation in sports teams
Students were categorized as consuming‘frequent fast food and takeaways’if they reported eating from‘A fast-food place (e.g. McDonald’s, KFC, Burger King, Subway, Pizza Hut)’or
‘Other takeaways or fast-food shops (e.g. fish and chips, Chinese takeaways) [typically corner-shop low-cost and high-fat establishments in NZ]’ more than four times per week. Fruit and vegetable consumption was assessed by a series of questions about the frequency of consumption of
‘fruit’,‘potatoes, kumara [indigenous sweet potatoes], taro [a tropical root vegetable], etc.’and‘vegetables (not including potatoes, kumara, taro)’. Students were categorized as meet-ing the recommendation for‘5+ fruits & vegetables’per day if they reported consuming, as recommended by the NZ Ministry of Health(48), fruit twice daily or more often, and
vegetables or potatoes, kumara or taro three times daily or more often. They were categorized as eating‘family meals together’if they responded‘five or more times’to the ques-tion‘During the past 7 days, how many times did all, or most, of your family living in your house eat a meal together?’. Physical activity levels, including daily physical activity and also whether a student was physically inactive, was assessed with a single question:‘During the past 7 days, on how many days were you physically active for a total of at least 60 minutes per day? (add up all the time you spend in any kind of physical activity that increases your heart rate and makes you breathe hard some of the time)’, with responses ranging from‘0 days’to‘7 days’. Students who responded ‘7 days’ were categorized as engaging in ‘daily physical activity’; those who responded‘0 days’were categorized as ‘ physi-cally inactive’.‘Participation in a school sports team’ was defined as an affirmative response to the question‘Do you belong to any school sports teams?’.
Sample
Overall, 8500 students participated in Youth’12, with more female than male participants (due to more single-sex female schools than single-sex male schools taking part). Students were excluded from the current study (n731) if they: did not answer the question ‘What sex are you?’ (n3); did not understand the sexual attraction question (n178); did not understand the question asking if they were transgender (n137); or did not respond to either of these questions (i.e. the remainder). Therefore, the total sample for the current study was 7769 students.
Analyses
Students were recruited using a two-stage clustered sample design, with unequal probabilities of selection. In all
analyses the data were, therefore, weighted by the inverse probability of selection and the variance of estimates was adjusted to allow for correlated data from the same schools. The χ2 test was used to test differences between SGM
students and heterosexual cisgender students on three categorical variables: age category (≤15 and≥16 years), ethnicity group and level of deprivation (based on NZDep2006). Results were categorized by sex as there are considerable differences in weight-control behaviours, BMI, eating habits and physical activity levels between male and female youth. Total numbers and weighted per-centages were calculated for the selected outcomes, which were all determined a priori. Adjusted multiple logistic regression models were used to investigate the associations for male and female SGM students in comparison with male and female heterosexual cisgender students for the selected outcomes. Male and female SGM students were also compared using adjusted multiple logistic regression models. Possible confounders were included in the adjusted models, as prior work has reinforced key differences for youth, particularly in terms of BMI, ethnicity and levels of deprivation(49). Hence, for‘tried to lose weight’and‘
unheal-thy weight control’, age, ethnicity, socio-economic depriva-tion and BMI were included in the adjusted models. For all other outcomes, age, ethnicity and socio-economic depriva-tion were included. All analyses were carried out using the statistical software package Stata version 14.
Results
In total, 91·0 % of students were heterosexual cis-gender (n7069) and 9·0 % were SGM students (n700). SGM students were older (P= 0·011), less likely to be
European (P<0·001) and more likely to experience high levels of socio-economic deprivation (P<0·001) than their heterosexual cisgender peers. Of the SGM students, 318 (4·1 % of the overall total and 45·4 % of the minority students) were either not sure of their sexual attraction/s or not sure whether or not they were transgender (see Table 1).
Table 2 provides the numbers and weighted percent-ages, as well as the adjusted OR with 95 % CI, for the selected outcomes, comparing SGM males with heterosex-ual cisgender males. Over half of the SGM male participants had tried to lose weight, of which approximately a third had engaged in unhealthy weight-control behaviours. Numbers were small (i.e.≤50) for several variables. SGM male stu-dents were significantly more likely to have tried to lose weight, have engaged in unhealthy weight control, have frequently consumed fast food and takeaways, and be physically inactive, in comparison with heterosexual cis-gender male students. They were also significantly less likely to have participated in a school sports team. There were no significant differences between SGM males and heterosexual cisgender males in terms of BMI, consump-tion of 5+ fruits and vegetables daily, family meals together and daily physical activity.
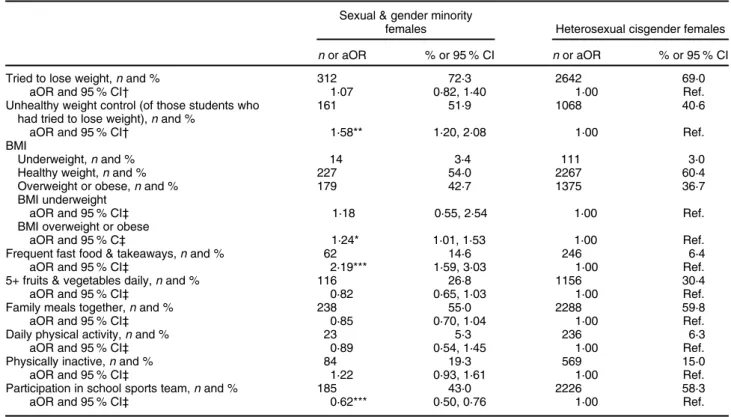
Table 3 compares the body size and weight, nutrition and activity behaviours of SGM females with those of heterosexual cisgender females. Again, numbers were small (i.e.≤50) for a couple of variables. Almost half of the SGM female participants were overweight or obese, and of the SGM females who had tried to lose weight, over half had engaged in unhealthy weight-control behaviours. SGM female students were significantly more likely to have engaged in unhealthy weight control, be overweight or obese, and have frequently consumed fast food and
Table 1Demographics of male and female secondary-school students, comparing sexual and gender minority students with heterosexual cisgender students; Youth’12 nationally representative health survey, New Zealand, 2012
Males Females
Sexual & gender minority
Heterosexual cisgender
Sexual & gender minority Heterosexual cisgender n % n % n % n % Total 266 – 3239 – 434 – 3830 – Age (years) ≤15 165 62·0 2108 65·0 255 58·6 2423 63·4 ≥16 99 38·0 1129 35·0 179 41·4 1402 36·6 Ethnicity European 108 41·1 1584 48·9 175 40·2 1975 51·5 Māori 58 21·5 656 20·4 80 18·4 744 19·4 Pacific 56 21·4 368 11·5 73 16·9 500 13·2 Asian 30 11·5 422 13·1 72 16·8 389 10·2 Other 12 4·5 202 6·2 34 7·7 221 5·8 NZDep2006 Low 67 26·4 1055 33·2 137 32·1 1338 35·3 Medium 83 32·0 1219 38·1 116 26·8 1375 36·3 High 109 41·6 924 28·8 176 41·1 1088 28·5
NZDep2006, New Zealand Deprivation Index. nare unweighted, while % are weighted.
takeaways, in comparison with their heterosexual cisgen-der female peers. They were also significantly less likely to participate in a school sports team. There were no signifi-cant differences between SGM females and heterosexual cisgender females in relation to trying to lose weight, con-sumption of 5+ fruits and vegetables daily, family meals together, daily physical activity and physical inactivity.
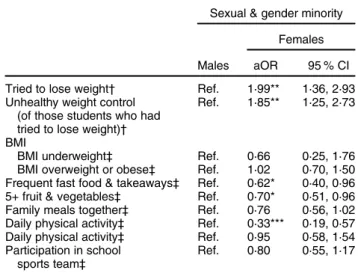
Comparing male and female SGM students highlighted a general trend, such that females experience higher odds of health and well-being issues. Female SGM students were significantly more likely to have tried to lose weight, and to have engaged in unhealthy weight control, relative to their male counterparts. They were also less likely to have eaten 5+ fruits and vegetables daily and to have engaged in daily physical activity. Sexual minority males were more likely to have frequently consumed fast food and take-aways than sexual minority females (see Table 4).
Discussion
Principal results
SGM youth in the current nationally representative sample from NZ had higher odds of adverse health outcomes related to weight-control behaviours, poor diet and lower
levels of physical activity than other students. When male and female SGM students were compared with their heterosexual cisgender peers, they were significantly more likely to engage in unhealthy weight control and frequently consume fast food and takeaways. They were also significantly less likely to participate in school sports teams.
Comparisons to prior international research
The results of the present study align with the findings of prior research in two key ways. First, in line with most earlier studies, our study indicates that there were no significant differences in BMI between young SGM and heterosexual cisgender males in NZ(12), whereas young
female SGM individuals were at greater odds of being over-weight or obese than their heterosexual cisgender peers, again in line with previous work(11,12,14). Second, in line
with GUTS, the current results indicate that SGM partici-pants were significantly less likely to engage in school sports teams than heterosexual cisgender youth(23). In
the current study there were no differences in fruit and veg-etable consumption, which is consistent with findings from research conducted with university students in the USA(17),
but contrasts with results from the YRBS that suggest that
Table 2 Associations between body size and weight, nutrition and activity behaviours among secondary-school students, comparing male sexual and gender minority students with male heterosexual cisgender students; Youth’12 nationally representative health survey, New Zealand, 2012
Sexual & gender minority males Heterosexual cisgender males
nor aOR % or 95 % CI nor aOR % or 95 % CI
Tried to lose weight,nand % 150 56·8 1298 40·4
aOR and 95 % CI† 1·95*** 1·47, 2·59 1·00 Ref.
Unhealthy weight control (of those students who had tried to lose weight),nand %
53 36·5 275 21·2
aOR and 95 % CI† 2·17*** 1·48, 3·19 1·00 Ref.
BMI
Underweight,nand % 12 4·6 101 3·1
Healthy weight,nand % 136 51·6 2041 63·3
Overweight or obese,nand % 117 43·8 1081 33·6
BMI underweight
aOR and 95 % CI‡ 1·84 0·99, 3·42 1·00 Ref.
BMI overweight or obese
aOR and 95 % C‡ 1·40 0·99, 1·98 1·00 Ref.
Frequent fast food & takeaways,nand % 60 23·0 244 7·7
aOR and 95 % CI‡ 2·89*** 2·01, 4·15 1·00 Ref.
5+ fruits & vegetables daily,nand % 90 34·0 906 28·4
aOR and 95 % CI‡ 1·25 0·96, 1·62 1·00 Ref.
Family meals together,nand % 161 61·4 2115 65·5
aOR and 95 % CI‡ 0·91 0·71, 1·18 1·00 Ref.
Daily physical activity,nand % 40 14·8 425 13·3
aOR and 95 % CI‡ 1·18 0·82, 1·69 1·00 Ref.
Physically inactive,nand % 50 19·0 293 9·2
aOR and 95 % CI‡ 2·54*** 1·65, 3·92 1·00 Ref.
Participation in school sports team,nand % 129 49·7 2047 63·8
aOR and 95 % CI‡ 0·57*** 0·44, 0·75 1·00 Ref.
aOR, adjusted OR; Ref., reference category; NZDep2006, New Zealand Deprivation Index. nare unweighted, while % are weighted.
*P<0·05, **P<0·01, ***P<0·001.
†Adjusted for age, ethnicity, NZDep2006 and BMI.
sexual minority students are more likely to meet recom-mendations for fruit and vegetable consumption(16). The
latter discrepancy likely reflects differences in measuring fruit and vegetable consumption between the two studies from the USA.
Although little has been published in relation to fast-food consumption for SGM youth, the current results differ from those from GUTS(18), as both male and female SGM
youth were more likely to consume fast food than their heterosexual peers. SGM males were also significantly more likely to consume fast food than SGM females. These findings highlight a need for future work to explore targeted interventions to reduce fast-food consumption by SGM young people, especially males.
In relation to weight-control behaviours, earlier research indicates that sexual minority males appear to be at consid-erable risk of disordered eating behaviours, with the results for comparable females less clear(12). While our
find-ings indicate that SGM males are more likely to engage in unhealthy weight-control behaviours, they show that SGM females are also more likely to engage in these behav-iours compared with other females and compared with SGM males.
Implications
Minority stress theory is useful in understanding the health issues reported in the present study. For instance, stress-related coping behaviours can include consoling dietary behaviours and certain sedentary activities(11),
which may lead to weight gain and obesity. There is some support for the minority stress theory in our data, given the increased challenges reported by SGM students. For exam-ple, it has been hypothesized that female SGM individuals may be more likely to be overweight than their male counterparts because of gender differences in managing minority-related stress. Specifically, females are thought to be more likely than males to adopt specific coping behav-iours linked with weight gain (e.g. disinhibited eating)(11).
There are a range of compelling sociocultural factors that may also help to explain the current findings. Numerous studies suggest that gendered cultural standards have a powerful effect on weight- and shape-related health indicators(50). Although SGM individuals are frequently
gender-role non-conforming(50), the strong cultural forces
linked to masculinity and femininity can help to explain certain patterns when SGM people are compared with heterosexual cisgender people. For instance, the findings
Table 3 Associations between body size and weight, nutrition and activity behaviours among secondary-school students, comparing female sexual and gender minority students with female heterosexual cisgender students; Youth’12 nationally representative health survey, New Zealand, 2012
Sexual & gender minority
females Heterosexual cisgender females
nor aOR % or 95 % CI nor aOR % or 95 % CI
Tried to lose weight,nand % 312 72·3 2642 69·0
aOR and 95 % CI† 1·07 0·82, 1·40 1·00 Ref.
Unhealthy weight control (of those students who had tried to lose weight),nand %
161 51·9 1068 40·6
aOR and 95 % CI† 1·58** 1·20, 2·08 1·00 Ref.
BMI
Underweight,nand % 14 3·4 111 3·0
Healthy weight,nand % 227 54·0 2267 60·4
Overweight or obese,nand % 179 42·7 1375 36·7
BMI underweight
aOR and 95 % CI‡ 1·18 0·55, 2·54 1·00 Ref.
BMI overweight or obese
aOR and 95 % C‡ 1·24* 1·01, 1·53 1·00 Ref.
Frequent fast food & takeaways,nand % 62 14·6 246 6·4
aOR and 95 % CI‡ 2·19*** 1·59, 3·03 1·00 Ref.
5+ fruits & vegetables daily,nand % 116 26·8 1156 30·4
aOR and 95 % CI‡ 0·82 0·65, 1·03 1·00 Ref.
Family meals together,nand % 238 55·0 2288 59·8
aOR and 95 % CI‡ 0·85 0·70, 1·04 1·00 Ref.
Daily physical activity,nand % 23 5·3 236 6·3
aOR and 95 % CI‡ 0·89 0·54, 1·45 1·00 Ref.
Physically inactive,nand % 84 19·3 569 15·0
aOR and 95 % CI‡ 1·22 0·93, 1·61 1·00 Ref.
Participation in school sports team,nand % 185 43·0 2226 58·3
aOR and 95 % CI‡ 0·62*** 0·50, 0·76 1·00 Ref.
aOR, adjusted OR; Ref., reference category; NZDep2006, New Zealand Deprivation Index. nare unweighted, while % are weighted.
*P<0·05, **P<0·01, ***P<0·001.
†Adjusted for age, ethnicity, NZDep2006 and BMI.
from the current study do not appear to support the assumption that SGM youth assigned female sex at birth are unaffected by the powerful social discourses surround-ing how girls should look, even if they are gender diverse. Equally, although some SGM youth assigned male sex at birth may identify as girls and women, the results suggest that their early socialization, in which they were ostensibly treated as boys, may have been protective against some of the problematic discourses surrounding the weight and size of girls’and women’s bodies. These findings suggest that efforts to address harmful expectations around appear-ance must include a focus on children.
Relatedly, some unhealthy weight control among SGM males may be a result of these males attempting to meet certain sociocultural ideals of attractiveness. For example, in a study with adults, gay men were more likely to idealize a thinner body shape than heterosexual men(51). The
pressure to meet this ideal may mean that young sexual minority males are more likely to employ body manage-ment practices, including those that are unhealthy, that result in a lower BMI. Youth’12 data currently do not allow for a full exploration of problematic body management practices outside of BMI (e.g. compulsive exercising for weight gain or muscle bulking) related to meeting the mas-culine ideal to be muscular. However, prior work suggests that male sexual minority individuals can over-conform to cultural norms in an attempt to become more physically powerful and muscular, and thus ‘fit in’ within cis-heteronormative society(52). Hence, public health
nutrition-ists will need to consider that weight-control issues may manifest in various ways among SGM males.
Ironically, because SGM females are expected to be non-conforming in relation to their gender, athletic ability is often considered to be a stereotypical trait, particularly for lesbians(53,54). However, the current results indicate that
female SGM students were less likely to participate in a school sports team. This lack of sports involvement may be a result of SGM females actively avoiding sports as a means of staying ‘closeted’(23) and because team sports
are frequently an unwelcoming context for ‘socializing and reinforcing homophobia [and presumably biphobia and transphobia] due to Western cultural expectations related to athleticism, gender norms, and sexual orientation’(23) (p. 18). The current results also support
prior international findings that male SGM students system-atically report lower engagement in school sporting activities(23).
Physical activity is important for all youth as adolescence is a crucial life stage for establishing health-promoting behaviours that contribute to current and future well-being. However, evidence suggests that adolescence is a time of substantial declines in physical activity, and that physical activity and inactivity track from adolescence to adult-hood(55). Mitigating declines in activity is important for this
age group overall and for SGM youth in particular, due to greater demonstrated need. Addressing these issues during adolescence represents a life-stage-dependent opportunity for substantial gains in individuals’current and future health. Public health nutritionists and other professionals should strive towards making team sports environments more sup-portive of SGM students, for example by helping to establish non-gendered sports teams, providing uniforms that are inclusive of SGM youth and ensuring that changing-room environments are safe for all.
Strengths and limitations
The current study has several strengths. First, data are drawn from a large nationally representative sample of NZ secondary-school students, including SGM youth. This is in contrast to convenience-based studies, in which samples are recruited on the basis of sexuality or gender identity. Second, Youth’12 was subject to extensive pilot and field testing before the survey was conducted. Third, student BMI was measured objectively, rather than by self-reported height and weight.
Limitations must also be considered. First, self-report was used for all items other than BMI, introducing the potential for bias. Second, the small numbers of SGM stu-dents endorsing some outcomes (e.g. being underweight and daily physical activity) resulted in a risk of a type 2 error (i.e. we may have been underpowered to detect some differences). Third, because students could select their sex as only male or female for the item ‘What sex are you?’and the question about whether a student was trans-gender was a separate item, we cannot, therefore, be sure how gender minority students interpreted these questions.
Table 4 Associations between body size and weight, nutrition and activity behaviours among secondary-school students, comparing male and female sexual and gender minority students; Youth’12 nationally representative health survey, New Zealand, 2012
Sexual & gender minority Females Males aOR 95 % CI Tried to lose weight† Ref. 1·99** 1·36, 2·93 Unhealthy weight control
(of those students who had tried to lose weight)†
Ref. 1·85** 1·25, 2·73
BMI
BMI underweight‡ Ref. 0·66 0·25, 1·76 BMI overweight or obese‡ Ref. 1·02 0·70, 1·50 Frequent fast food & takeaways‡ Ref. 0·62* 0·40, 0·96 5+ fruit & vegetables‡ Ref. 0·70* 0·51, 0·96 Family meals together‡ Ref. 0·76 0·56, 1·02 Daily physical activity‡ Ref. 0·33*** 0·19, 0·57 Daily physical activity‡ Ref. 0·95 0·58, 1·54 Participation in school
sports team‡
Ref. 0·80 0·55, 1·17
aOR, adjusted OR; Ref., reference category; NZDep2006, New Zealand Deprivation Index.
*P<0·05, **P<0·01, ***P<0·001.
†Adjusted for age, ethnicity, NZDep2006 and BMI.
Did they respond to the first question based on their natal sex (i.e. sex assigned at birth)? Or based on their gender identity at the time of the survey? Thus, there is a chance that some gender minority students reported their assigned sex as their current gender identity. Moreover, many gender minority youths have a gender identity outside the male/female binary. The item designed to capture sex-ual attractions has similar limitations. For example, a trans-gender student whose natal sex is female, trans-gender identity is male and is attracted to males, may state an attraction to the same sex. Although we surveyed students about whether they were transgender, we did not ask participants whether or not they were intersex (i.e. born with variations in sex characteristics that do not fit the typical definitions for male or female bodies). Despite these challenges, our data demonstrate robust differences that would most likely be strengthened by the use of more definitive items on sex, gender and sexuality.
Conclusion
To the best of our knowledge, there have been no prior published nationally representative studies of SGM youth outside the USA in relation to BMI, weight-control behav-iours, nutrition and activity levels. In NZ, compared with their peers, SGM students have higher odds of adverse health outcomes related to weight-control behaviours, a poor diet and low levels of physical activity. Female SGM students appear to have particularly high needs. Health professionals, including public health nutritionists, must recognize and help work towards addressing the chal-lenges facing sexual and gender minorities.
Acknowledgements
Acknowledgements:The authors would like to thank the schools and students that participated in Youth’12. They would also like to thank Kylie Sutcliffe for her feed-back on earlier drafts of this paper. Financial support:
Youth’12 was funded by the Ministries of Youth Development, Social Development, Health, Education, Justice; the Department of Labour, Families Commission; and the Alcohol Advisory Council. The authors also acknowledge Toshiba (Australia) Pty. Limited. M.S. is supported by a Health Research Council of New Zealand (HRCNZ) Sir Charles Hercus Research Fellowship (grant number 17/013). The HRCNZ and the funders of Youth’12 had no role in the design, analysis or writing of this article. Conflict of interest: None. Authorship:
M.F.G.L. and A.M.G. conceived the study and conducted the analyses. M.F.G.L. drafted the manuscript. T.C., J.F., S.D., T.F., M.S. and J.U. participated in the conception and design of the study and its analyses, and together with A.M.G. assisted M.F.G.L. to draft the paper. T.C. was the
principal investigator for the Youth’12 project and S.D., T.F. and J.U. were co-investigators.Ethics of human subject participation: All procedures performed in our study involving student participants were in accordance with the ethical standards of the University of Auckland Human Participants Ethics committee. Informed consent was obtained from the principal of each participating school as well as from all participating students.
Author ORCIDs. Mathijs Lucassen, 0000-0001-6958-3468. Aravinda Meera Guntupalli, 0000-0002-4879-2110. Terryann Clark, 0001-5499-5080. John Fenaughty, 0000-0002-6261-3975. Simon Denny, 0000-0001-6986-7196. Theresa Fleming, 5174-9359. Melody Smith, 0000-0002-2846-6430. Jennifer Utter, 0000-0001-9472-5595.
References
1. Boehmer U (2002) Twenty years of public health research: inclusion of lesbian, gay, bisexual, and transgender popula-tions.Am J Public Health92, 1125–1130.
2. Coulter RW, Kenst KS, Bowen DJ (2014) Research funded by the National Institutes of Health on the health of lesbian, gay, bisexual, and transgender populations.Am J Public Health 104, e105–e112.
3. Lucassen MFG, Merry SN, Robinson EMet al. (2011) Sexual attraction, depression, self-harm, suicidality and help-seeking behaviour in New Zealand secondary school students.Aust N Z J Psychiatry45, 376–383.
4. Safren SA & Heimberg RG (1999) Depression, hopelessness, suicidality, and related factors in sexual minority and hetero-sexual adolescents.J Consult Clin Psychol67, 859–866. 5. Gonzales G, Przedworski J & Henning-Smith C (2016)
Comparison of health and health risk factors between lesbian, gay, and bisexual adults and heterosexual adults in the United States: results from the National Health Interview Survey.JAMA Intern Med176, 1344–1351. 6. Lucassen MFG, Stasiak K, Samra Ret al. (2017) Sexual
minor-ity youth and depressive symptoms or depressive disorder: a systematic review and meta-analysis of population-based studies.Aust N Z J Psychiatry51, 774–787.
7. Reisner SL, Poteat T, Keatley Jet al. (2016) Global health burden and needs of transgender populations: a review.
Lancet388, 412–436.
8. Meyer IH (2003) Prejudice, social stress, and mental health in lesbian, gay, and bisexual populations: conceptual issues and research evidence.Psychol Bull129, 674–697. 9. Denny S, Lucassen MFG, Stuart Jet al. (2016) The association
between supportive high school environments and depres-sive symptoms and suicidality among sexual minority students.J Clin Child Adolesc Psychol45, 248–261. 10. Austin SB, Nelson LA, Birkett MAet al. (2013) Eating disorder
symptoms and obesity at the intersections of gender, ethnic-ity, and sexual orientation in US high school students.Am J Public Health103, e16–e22.
11. Austin SB, Ziyadeh NJ, Corliss HLet al. (2009) Sexual orien-tation disparities in weight status in adolescence: findings from a prospective study. Obesity (Silver Spring) 17, 1776–1782.
12. Miller JM, Luk JW (2018) A systematic review of sexual orien-tation disparities in disordered eating and weight-related behaviors among adolescents and young adults: toward a
developmental model.Adolesc Res Rev.Published online: 18 January 2018. doi: 10.1007/s40894-018-0079-2.
13. Diemer EW, Grant JD, Munn-Chernoff MA et al. (2015) Gender identity, sexual orientation, and eating-related path-ology in a national sample of college students.J Adolesc Health57, 144–149.
14. Bowen DJ, Balsam KF & Ender SR (2008) A review of obesity issues in sexual minority women.Obesity (Silver Spring)16, 221–228.
15. VanKim NA, Austin SB, Jun HJet al. (2017) Dietary patterns during adulthood among lesbian, bisexual, and heterosexual women in the Nurses’Health Study II.J Acad Nutr Diet117, 386–395.
16. Rosario M, Corliss HL, Everett BGet al. (2014) Sexual orien-tation disparities in cancer-related risk behaviors of tobacco, alcohol, sexual behaviors, and diet and physical activity: pooled Youth Risk Behavior Surveys.Am J Public Health 104, 245–254.
17. McElroy JA & Jordan J (2014) Disparate perceptions of weight between sexual minority and heterosexual female college students.LGBT Health1, 122–130.
18. Katz-Wise SL, Jun HJ, Corliss HLet al. (2014) Child abuse as a predictor of gendered sexual orientation disparities in body mass index trajectories among US youth from the Growing Up Today Study.J Adolesc Health54, 730–738.
19. Utter J, Denny S, Robinson Eet al. (2013) Family meals among New Zealand young people: relationships with eating behav-iors and body mass index.J Nutr Educ Behav45, 3–11. 20. Fulkerson JA, Kubik MY, Story M et al. (2009) Are there
nutritional and other benefits associated with family meals among at-risk youth?J Adolesc Health45, 389–395. 21. Clark TC, Lucassen MFG, Bullen P et al. (2014) The
health and well-being of transgender high school students: results from the New Zealand Adolescent Health Survey (Youth'12).J Adolesc Health55, 93–99.
22. Lucassen MFG, Clark TC, Denny SJet al. (2015) What has changed from 2001 to 2012 for sexual minority youth in New Zealand?J Paediatr Child Health51, 410–418. 23. Calzo JP, Roberts AL, Corliss HLet al. (2014) Physical activity
disparities in heterosexual and sexual minority youth ages 12–22 years old: roles of childhood gender nonconformity and athletic self-esteem.Ann Behav Med47, 17–27. 24. Clark TC, Fleming T, Bullen P et al. (2013) Health and
well-being of secondary school students in New Zealand: trends between 2001, 2007 and 2012. J Paediatr Child Health49, 925–934.
25. Clark TC, Lucassen MFG, Fleming Tet al. (2016) Changes in the sexual health behaviours of New Zealand secondary school students, 2001–2012: findings from a national survey series.Aust N Z J Public Health40, 329–336.
26. Saewyc EM, Bauer GR, Skay CL et al. (2004) Measuring sexual orientation in adolescent health surveys: evalua-tion of eight school-based surveys. J Adolesc Health 35, 345–360.
27. Ackard DM, Fedio G, Neumark-Sztainer D et al. (2008) Factors associated with disordered eating among sexually active adolescent males: gender and number of sexual part-ners.Psychosom Med70, 232–238.
28. Hadland SE, Austin SB, Goodenow CSet al. (2014) Weight misperception and unhealthy weight control behaviors among sexual minorities in the general adolescent popula-tion.J Adolesc Health54, 296–303.
29. Mereish EH & Poteat VP (2015) Let’s get physical: sexual ori-entation disparities in physical activity, sports involvement, and obesity among a population-based sample of adoles-cents.Am J Public Health105, 1842–1848.
30. Watson RJ, Adjei J, Saewyc Eet al. (2017) Trends and dispar-ities in disordered eating among heterosexual and sexual minority adolescents.Int J Eat Disord50, 22–31.
31. Hatzenbuehler ML, McLaughlin KA & Nolen-Hoeksema S (2008) Emotion regulation and internalizing symptoms
in a longitudinal study of sexual minority and heterosexual adolescents.J Child Psychol Psychiatry49, 1270–1278. 32. Day JK, Fish JN, Perez-Brumer Aet al. (2017) Transgender
youth substance use disparities: results from a population-based sample.J Adolesc Health61, 729–735.
33. Eisenberg ME, Gower AL, McMorris BJ et al. (2017) Risk and protective factors in the lives of transgender/ gender nonconforming adolescents. J Adolesc Health 61, 521–526.
34. Perez-Brumer A, Day JK, Russell STet al. (2017) Prevalence and correlates of suicidal ideation among transgender youth in California: findings from a representative, population-based sample of high school students. J Am Acad Child Adolesc Psychiatry56, 739–746.
35. Veale JF, Watson RJ, Peter Tet al. (2017) Mental health dis-parities among Canadian transgender youth.J Adolesc Health 60, 44–49.
36. Treharne GJ & Adams J (2017) Critical perspectives on the diversity of research into sexualities and health in Aotearoa/New Zealand: thinking outside the boxes.
Psychol Sex Rev8, 53–69.
37. Dickson N, Lee B, Foster Tet al. (2015) The first 30 years of HIV in New Zealand: review of the epidemiology.N Z Med J 128, 31–48.
38. VanKim NA, Erickson DJ, Eisenberg MEet al. (2014) Weight-related disparities for transgender college students.Health Behav Policy Rev1, 161–171.
39. Pearson N, Atkin AJ, Biddle SJ et al. (2009) Patterns of adolescent physical activity and dietary behaviours. Int J Behav Nutr Phys Act6, 45.
40. Utter J, Haines J, Denny Set al. (2019) Trends in weight-related attitudes and behaviours among New Zealand adolescents, between 2007 and 2012. J Paediatr Child Health55, 333–337.
41. Utter J, Denny S, Percival Tet al. (2012) Prevalence of weight-related concerns and behaviours among New Zealand young people.J Paediatr Child Health48, 1021–1028.
42. Denny S, Milfont T, Utter J et al. (2008) Hand-held internet tablets for school-based data collection.BMC Res Notes 1, 52.
43. Statistics New Zealand (2005) Statistical Standard for Ethnicity. http://www.stats.govt.nz/surveys_and_methods/ methods/classifications-and-standards/classification-related-stats-standards/ethnicity.aspx (accessed April 2013). 44. Lang K (2002) Measuring Ethnicity in the New Zealand
Census. Wellington: Statistics New Zealand.
45. Salmond C, Crampton P, Sutton Fet al. (2006) NZDep2006 Census Area Unit Data. http://www.otago.ac.nz/wellington/ research/hirp/otago020194.html (accessed April 2013). 46. Utter J, Denny S, Robinson Eet al. (2012) Identifying the‘red
flags’for unhealthy weight control among adolescents: find-ings from an item response theory analysis of a national sur-vey.Int J Behav Nutr Phys Act9, 99.
47. Cole TJ & Lobstein T (2012) Extended international (IOTF) body mass index cut-offs for thiness, overweight and obesity.
Pediatr Obes7, 284–294.
48. New Zealand Ministry of Health (2017) Healthy eating for teen-agers. https://www.health.govt.nz/system/files/documents/ pages/healthy-eating-for-teenagers-jan17.pdf (accessed January 2019).
49. Utter J, Denny S, Crengle Set al. (2010) Overweight among New Zealand adolescents: associations with ethnicity and deprivation.Int J Pediatr Obes5, 461–466.
50. Austin SB, Ziyadeh NJ, Calzo JP et al. (2016) Gender expression associated with BMI in a prospective cohort study of US adolescents. Obesity (Silver Spring) 24, 506–515.
51. Smith AR, Hawkeswood SE, Bodell LP et al. (2011) Muscularity versus leanness: an examination of body ideals and predictors of disordered eating in heterosexual and gay college students.Body Image8, 232–236.
52. Kimmel SB, Mahalik JR (2005) Body image concerns of gay men: the roles of minority stress and conformity to masculine norms.J Consult Clin Psychol73, 1185–1190.
53. Blinde EM & Taub DE (1992) Women athletes as falsely accused deviants: managing the lesbian stigma.Sociol Q 33, 521–533.
54. Sartore ML & Cunningham GB (2009) Gender, sexual prejudice and sport participation: implications for sexual minorities.Sex Roles60, 100–113.
55. Dumith SC, Gigante DP, Domingues MRet al. (2011) Physical activity change during adolescence: a systematic review and a pooled analysis.Int J Epidemiol40, 685–698.