Integration of QTL detection and marker assisted
selection for improving resistance to Fusarium head
blight and important agronomic traits in wheat
Chao Lv
a,b, Yanxia Song
b, Lifeng Gao
b, Qin Yao
b, Ronghua Zhou
b, Rugen Xu
a, Jizeng Jia
b,⁎
aJiangsu Provincial Key Laboratory of Crop Genetics and Physiology/Key Laboratory of Plant Functional Genomics of Ministry of Education, College of Agriculture, Yangzhou University, Yangzhou 225009, ChinabKey Laboratory of Crop Germplasm and Biotechnology, Ministry of Agriculture/National Key Facility for Crop Gene Resources and Genetic Improvement, Institute of Crop Science, Chinese Academy of Agricultural Sciences, Beijing 100081, China
A R T I C L E I N F O
A B S T R A C T
Article history: Received 10 May 2013 Received in revised form 12 September 2013 Accepted 15 October 2013 Available online 5 November 2013
Fusarium head blight (FHB), caused byFusarium graminearum, is one of the most destructive wheat (Triticum aestivumL.) diseases worldwide. Identification of quantitative trait loci (QTL) conferring FHB resistance followed by marker assisted selection (MAS) is an efficient approach to breed FHB-resistant varieties. In this study, 38 additive QTL and 18 pairs of epistatic QTL for FHB resistance were detected in four environments using a population of recombinant inbred lines (RILs) derived from varieties Neixiang 188 and Yanzhan 1. Six QTL clusters were located on chromosomes 2D, 4B, 4D, 5A, 5D and 7B, suggesting possible polytrophic functions. Six elite lines with good FHB resistance and agronomic traits were selected from the same population using the associated markers. Our results suggest that MAS of multiple QTL will be effective and efficient in wheat breeding.
© 2013 Production and hosting by Elsevier B.V. on behalf of Crop Science Society of China and Institute of Crop Science, CAAS. Keywords: Triticum aestivum Fusarium graminearum FHB Head scab
1.
Introduction
Fusarium head blight (FHB), caused byFusarium graminearum Schwabe, is a common disease in wheat (Triticum aestivum) and barley (Hordeum vulgare), that causes yield losses and threatens human health [1–3]. Due to global warming and agronomic practices, such as irrigation and retained stubble that may carry the pathogen, FHB has become more frequent and more severe in recent years. The disease has gradually
extended to the northern major wheat production areas of China.[4]In the Yangtze River valley and Northeast Spring Wheat Zone, FHB regularly causes 10%–15% of yield losses, and nearly 50% in epidemic years[5].
Resistant varieties play an important role in controlling FHB. However, there are relatively few resistance genes used in wheat breeding in China. FHB resistance is a quantitative trait controlled by major and minor genes [3,6–10]located on all wheat chromosomes, except 7D[9]. Chinese variety Sumai 3,
⁎ Corresponding author.
E-mail address:[email protected](J. Jia).
Peer review under responsibility of Crop Science Society of China and Institute of Crop Science, CAAS.
2214-5141/$–see front matter © 2013 Production and hosting by Elsevier B.V. on behalf of Crop Science Society of China and Institute of Crop Science, CAAS.
http://dx.doi.org/10.1016/j.cj.2013.10.004
A v a i l a b l e o n l i n e a t w w w . s c i e n c e d i r e c t . c o m
which carries the major resistance QTL Fhb1, is widely recognized as the best resistance source and is extensively used in wheat breeding programs worldwide[6,11–14].
Marker assisted selection (MAS) is a promising method for breeding in the genomics era. Thousands of QTL and genes conferring traits of agronomic importance have been identified in major crops, and these can be used to accelerate MAS. At present, QTL detection and functional analysis are separate from MAS. Many molecular markers for targeting genes/loci are not useful during the selection process because of low polymorphism across different genetic backgrounds and incomplete association with target traits. In this study, we attempted to select promising breeding lines with FHB resistance and good agronomic traits by combining QTL analysis and MAS. In a recombinant inbred line (RIL) population derived from cultivars Yanzhan 1 (YZ1) and Neixiang 188 (NX188) FHB resistance and other important agronomic traits were simultaneously selected using molecular markers, and several elite lines were produced.
2.
Materials and methods
2.1. Plant materials
One hundred and ninety nine F7:8 RILs were developed by single-seed descent from the cross YZ1 × NX188. YZ1 is an early maturing cultivar released in Henan Province of China, in 2000; NX188, a high yielding cultivar with wide adaptation and released in 2000, was the fourth most widely planted cultivar in China (470,000 ha) in 2004.
2.2. Evaluation of agronomic traits
The RILs and their parents were planted in Beijing and in Luoyang, Henan province, in the 2003–2004 and 2004–2005 wheat seasons. All lines were phenotyped as single relicates in four environments. Thirty seeds of each line were sown in a two-row plot of 2 m in length. Plant height (PH) was measured in the field at maturity. Spike length (SL), spikelet number per spike (SPI), spike compactness (SC, SC = SPI/SL), grain number per spike (GNS), and thousand-grain weight (TGW) were measured after harvest.
2.3. FHB evaluation
FHB responses were assayed under natural conditions in the 2005–2006 and 2006–2007 cropping seasons in Jianyang, Fujian province. Although no wheat is commercially produced in the area extremely severe FHB infections are common. Field management was the same as that for agronomic evaluations. Sumai 3, Mianyang 26, and Yangmai 5 were used as the resistant, susceptible, and moderately susceptible controls, respectively.
About 15 and 20 days after flowering, 30 spikes of each line were randomly selected. FHB severity in each spike was classified into five grades of symptoms on spikelets and spike rachi: 0 for no incidence on spikelets and spike rachis, 1 for ratio of incidence on spikelets less than 1/4 and no incidence on the rachis, 2 for ratio of incidence on spikelets between 1/4 and 1/2 and no incidence on the rachis, 3 for ratio of incidence on spikelets between 1/2 and 3/4 and incidence on spike rachis, 4 for
ratio of incidence on spikelets of more than 3/4 or dead spikelets.
[15], FHB disease index (DI) of each line was calculated as follows: DI = (Σseverity score of an individual spike × number of spikes)/ (the highest severity score × total number of spikes).
The FHB resistance score of a genotype was graded by DI from 1 to 7[15,16], representing R, R–MR, MR, MR–MS, MS, MS–S and S, respectively. Where R = resistant, S = susceptible, and M = moderate disease.
2.4. Construction of a linkage map and QTL analyses
A total of 328 publicly available SSR and DArT markers were mapped on 25 linkage groups (http://wheat.pw.usda.gov/GG2/ index.shtml) [17] covering a total genetic distance of 3848.2 cM and providing partial linkage groups for all chro-mosomes. QTL for agronomic traits and FHB resistance were analyzed separately. Composite interval mapping (CIM) was performed using QTLNetwork 2.0 software[18]on the individual line means in order to detect additive QTL, epistatic QTL, and QTL × environment interaction (QE). QTL nomenclature followed the protocols of McIntosh et al. [19], in which the research institution is abbreviated as“caas”(Chinese Academy of Agricultural Sciences).
3.
Results
3.1. FHB response and agronomic traits
Consistent FHB responses of both parents and RILs were observed during the 2005–2006 and 2006–2007 cropping seasons, and the correlation coefficient was 0.56 (P< 0.01). NX188 had a significantly lower DI and resistance score than YZ1. FHB DI and resistance scores for the RIL population showed a continuous distribution with transgressive segregation, particularly, some lines exhibiting higher resistance than the resistant parent (Table 1).
The frequency distributions for six agronomic traits were continuous with broad variation and transgressive segregation in all environments (Table 1).
3.2. QTL for FHB resistance and agronomic traits
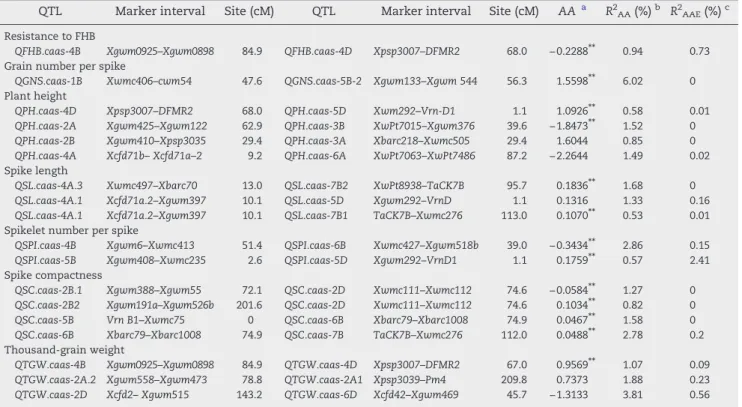
A total of 38 additive and 18 epistatic QTL for FHB and agronomic traits were detected across all environments (Table 2andFig. 1). Variation at single loci explained 0.40%–
34.96% of the phenotypic variation. These QTL were distrib-uted on 17 wheat chromosomes except for 1A, 1D, 7A and 7D. Twenty QTL had negative additive values, indicating that alleles from YZ1 reduced the phenotypic effect, whereas the alleles from NX188 increased the phenotypic values. At the remaining 18 loci, alleles from NX188 had positive additive values.
Additive QTL for FHB resistance were detected on chromo-somes 2D, 4B, 4D, 5B and 5D. The contribution of single QTL ranged from 1.01% to 12.86% (Table 2andFig. 1).QFHB.caas-5D and QFHB.caas-4Dshowed larger effects than others. Favor-able alleles at these five additive loci were from both parents, such asQFHB.caas-4D, QFHB.caas-5B, andQFHB.caas-5D from NX188 andQFHB.caas-2DandQFHB.caas-4Bfrom YZ1 (Table 2).
Five additive QTL were detected for GNS on chromosomes 2B, 4B, 5A, 5B and 5D, with phenotypic contributions ranging from 3.63% to 10.13% (Table 2andFig. 1). Alleles increasing GNS from NX188 were at QGNS.caas-4B, QGNS.caas-5B and QGNS.caas-5D, and the positive alleles at other loci were from YZ1. QE interactions were detected for all five QTL and accounted for 3.57% of the phenotypic variation. One pair of additive QTL showed interaction, accounting for 6.02% of the phenotypic variation (Table 3).
Five additive QTL for PH detected in Beijing and Luoyang were located on chromosomes 2D, 4B, 4D, 5A and 5D explained phenotypic variation of 1.51% and 34.96%, respectively (Table 2
and Fig. 1). Alleles at the QPH.caas-4D and QPH.caas-5D loci reducing PH were from YZ1, and the other alleles reducing height came from NX188. QPH.caas-4BandQPH.caas-4D were located in marker intervals co-inciding with dwarfing genes Rht-B1andRht-D1, respectively, andQPH.caas-2D.1was identi-fied at the position of Rht8. The effects of QPH.caas-4B and QPH.caas-4Dwere much greater than that ofQPH.caas-2D. This result confirmed an earlier finding that the effects ofRht-B1and Rht-D1were much larger than that ofRht-8[20].QPH.caas-5Aand QPH.caas-5Dhad minor effects on reducing PH. Four pairs of QTL showed interactions (Table 3) that explained phenotypic variation of 4.44%.
Eight additive QTL for SL were detected on chromosomes 1B, 2D, 4A, 5A, 5D, 6A and 7B, and explained 4.12%–11.97% of the phenotypic variation (Table 2andFig. 1). Of theseQSL.caas-1B
andQSL.caas-2Dgave the largest effects. The map position of QSL.caas-2D was similar to that of QPH.caas-2D in the Rht8 region, suggesting thatRht8affected SL. Alleles increasing SL were from NX188, viz.QSL.caas-1B,QSL.caas-4A.1,QSL.caas-5D and QSL.caas-6A, whereas the other four were from YZ1. Interactions between three pairs of QTL accounted for 3.54% of the total phenotypic variation (Table 3).
Additive QTL for SPI were detected on chromosomes 1B, 5A, 5B and 5D, and each explained 0.40%–23.99% of the phenotypic variation (Table 2andFig. 1). All three favorable alleles with larger effects on increasing SPI were from NX188 and explained 53.6% the variation. QE interactions were detected for all QTL, accounting for 9.78% of the phenotypic variation. These data indicated that spikelet numbers were affected by environmen-tal variation. Interaction was detected between two pairs of QTL on four chromosomes (Table 3), and together accounted for 3.43% of the phenotypic variation.
Six additive QTL for SC were detected on chromosomes 2D, 4A, 5A, 6B and 7B, and each explained between 2.83% and 17.34% of the phenotypic variation (Table 2andFig. 1). All except QSC.caas-4A.1 increased SC and all were derived from NX188 and contributed for 39.31% of the phenotypic variation. QE interactions were detected for four of the QTL. The latter had a very small effect (0.22%) on phenotypic variation. Interactions between four pairs of QTL were detected (Table 3), and together accounted for 6.45% of the phenotypic variation. These results showed that spike
Table 1–Means, ranges, standard deviations (SD) and coefficients of variation (CV) of agronomic traits and FHB response of parents and RILs in two seasons.
Trait Environment Parent RIL
NX188 YZ1 Mean Range SD CV
FHB repose
Disease index Jianyang, 2005 0.40 0.79 0.41 0.16–0.70 0.10 24.11
Jianyang, 2006 0.42 0.76 0.64 0.26–0.90 0.12 24.34
Resistance score Jianyang, 2005 4 7 5.31 2–7 1.11 20.97
Jianyang, 2006 2 7 5.71 2–7 1.32 23.09
Agronomic traits
Grain number per spike Beijing, 2003 50.80 40.40 41.28 29.60–58.00 6.11 14.80
Beijing, 2004 49.84 38.22 41.15 16.12–67.60 8.48 20.60
Luoyang, 2003 59.23 58.70 57.03 43.20–78.00 6.81 11.94
Luoyang, 2004 45.47 53.66 45.69 15.60–27.20 6.33 13.85
Plant height (cm) Beijing, 2003 62.80 66.20 66.38 38.20–97.40 14.15 21.32
Beijing, 2004 67.05 66.20 64.27 36.22–100.40 14.01 21.80
Luoyang, 2003 71.27 78.30 71.72 42.33–108.40 15.31 21.35
Luoyang, 2004 67.73 66.23 65.44 35.20–101.20 12.92 19.74
Spikelet compactness Beijing, 2003 2.12 2.13 2.27 1.63–3.28 0.30 13.12
Beijing, 2004 2.29 2.11 2.16 1.54–3.72 0.32 15.08
Luoyang, 2003 2.16 2.26 2.16 1.65–2.99 0.24 11.28
Luoyang, 2004 2.48 2.38 2.32 1.66–3.33 0.31 13.25
Spike length (cm) Beijing, 2003 9.80 7.80 8.06 5.70–11.80 1.30 16.13
Beijing, 2004 9.63 8.27 9.08 6.50–12.10 1.25 13.77
Luoyang, 2003 9.78 9.75 10.12 7.10–13.70 1.22 12.07
Luoyang, 2004 8.98 10.04 9.58 6.83–12.20 1.23 12.84
Spikelet number per spike Beijing, 2003 20.80 16.60 18.00 14.12–24.80 2.21 12.28
Beijing, 2004 22.03 17.47 19.47 13.23–27.10 2.63 13.50
Luoyang, 2003 21.17 22.05 21.55 18.33–25.60 1.23 5.65
Luoyang, 2004 22.27 23.94 21.92 15.50–27.20 2.05 9.35
Thousand-grain weight (g) Beijing, 2003 46.84 42.15 35.02 15.03–52.47 8.15 23.27
Beijing, 2004 37.85 39.03 40.92 17.40–59.21 7.34 17.94
Luoyang, 2003 50.50 49.92 48.32 37.64–57.62 4.12 8.50
compactness was controlled by genes with additive and epistatic effects.
Additive QTL for TGW were detected on chromosomes 2A, 2B, 3D, 4B and 4D, and each one explained between 2.90% and 18.30% of the phenotypic variation (Table 2andFig. 1).QTGW.caas-4Band QTGW.caas-4D, with the largest effects explained 15.47% and 18.30% of the phenotype variation, respectively. One favorable allele came from each parent. QE interactions were detected and explained 6.89% of the phenotypic variation in total. Interactions between three pairs of the QTL were detected (Table 3), account-ing for 6.76% of the phenotypic variation.
Six gene clusters were detected for the 56 additive and epistatic QTL identified in this study, and were located on
chromosomes 2D, 4B, 4D, 5A, 5B, 5D and 7B (Table 4andFig. 1). These QTL clusters suggested polytrophic effects conferred by some loci. Four QTL (QPH.caas-2D, QSC.caas-2D, QSL.caas-2D and QFHB.caas-2D) were located in the region Xwmc111– Xwmc112 on chromosome 2D where Rht8was located. The positive values for PH and SL and negative values for SC and FHB suggested that the allelic effects from YZ1 in this QTL cluster were for increasing PH, and SL, but decreasing SC and FHB (increasing FHB resistance) or alternately that the allele from NX188 decreased PH and SL but increased SC and FHB. Four QTL (QGNS.caas-4B, QPH.caas-4B, QTGW.caas-4B and QFHB.caas-4B) were located in the regionXgwm0925–Xgwm0898on chromo-some 4B, co-locating with dwarfing geneRht-B1. The positive
Table 2–QTL with additive effects and QE for agronomic traits and FHB resistance in two years.
QTL Marker interval Site (cM) Aa R2A(%)b R2AE(%)c
Resistance to FHB QFHB.caas-2D Xwmc111–Xwmc112 75.6 −0.3679⁎⁎ 4.70 0.004 QFHB.caas-4B Xgwm0925–Xgwm0898 84.9 −0.4341⁎⁎ 5.69 0.20 QFHB.caas-4D Xpsp3007–DFMR2 60.0 0.5727⁎⁎ 9.32 0.85 QFHB.caas-5B Xwmc235–Xwmc28 18.3 0.3135⁎⁎ 1.01 0.03 QFHB.caas-5D Xgwm292–Vrn-D1 1.1 0.6017⁎⁎ 12.86 0.05
Grain number per spike
QGNS.caas-2B Xgwm429–Xgwm410 20.0 1.9723⁎⁎ 3.63 0.05 QGNS.caas-4B Xcfd39a–Xgwm0925 74.5 −1.8482⁎⁎ 7.08 0.05 QGNS.caas-5A Xgwm304–Xbarc56 60.4 1.0243⁎⁎ 3.90 0.29 QGNS.caas-5B1 Vrn-B1–Xwmc75 0 −0.9614⁎⁎ 10.13 0.05 QGNS.caas-5D Xgwm292–Vrn-D1 1.1 −1.3031⁎⁎ 5.62 3.13 Plant height QPH.caas-2D Xwmc111–Xwmc112 89.6 4.0370⁎⁎ 3.96 0.03 QPH.caas-4B Xgwm0925–Xgwms0898 85.9 8.0044⁎⁎ 31.92 0.07 QPH.caas-4D Xpsp3007–DFMR2 68.0 −8.4021⁎⁎ 34.96 0.04 QPH.caas-5A Xgwm1258.1–Xwmc327 30.3 1.9853⁎⁎ 3.75 0.01 QPH.caas-5D Xgwm292–Vrn-D1 1.1 −1.5159⁎⁎ 1.51 0.73 Spike length QSL.caas-1B Xgwm11–Xcfd21b 85.9 −0.4645⁎⁎ 11.67 0.01 QSL.caas-2D Xwmc111–Xwmc112 73.6 0.4892⁎⁎ 11.97 0.04 QSL.caas-4A-1 Xcfd71a–2–Xgwm397 10.1 −0.3102⁎⁎ 4.84 0.01 QSL.caas-4A-2 Xbarc78–Xgwm160 25.2 0.2676⁎⁎ 4.28 0.01 QSL.caas-5A Xwmc327–Xgwm293b 44.9 0.3625⁎⁎ 4.10 0.04 QSL.caas-5D Xgwm292–Vrn-D1 1.1 −0.3119⁎⁎ 8.22 0.229 QSL.caas-6A Xgwm169–Xgwm617 162.0 −0.2270⁎⁎ 4.12 0.03 QSL.caas-7B1 TaCK7B–Xwmc276 113.0 0.1831⁎⁎ 4.05 0.01
Spikelet number per spike
QSPI.caas-1B Xbarc187–Xwmc419b 59.6 −0.7454⁎⁎ 10.17 0.02 QSPI.caas-5A Xgwm304–Xbarc56 60.4 0.2200⁎⁎ 0.40 0.92 QSPI.caas-5B Xgwm408–Xwmc235 2.6 −0.8927⁎⁎ 23.99 2.26 QSPI.caas-5D Xgwm292–Vrn-D1 1.1 −0.9349⁎⁎ 19.44 6.58 Spike compactness QSC.caas-2D Xwmc111–Xwmc112 74.6 −0.1301⁎⁎ 17.34 0.01 QSC.caas-4A1 Xwmc516–Xcfd71b 6.0 0.0307⁎⁎ 3.46 0. QSC.caas-4A2 Xbarc78–Xgwm160 26.2 −0.0634⁎⁎ 9.82 0.19 QSC.caas-5A Xgwm304–Xbarc56 58.4 −0.0267⁎⁎ 2.83 0.02 QSCcaas-6B Xbarc79–Xbarc1008 74.9 −0.0337⁎⁎ 4.40 0 QSC.caas-7B TaCK7B–Xwmc276 112.0 −0.0580⁎⁎ 4.92 0.01 Thousand-grain weight QTGW.caas-2A-1 Xpsp3039–Pm4 209.8 0.9423⁎⁎ 2.90 0.57 QTGW.caas-2B Xcfd19–Xgwm191a 146.2 0.8891⁎⁎ 4.01 0.27 QTGW.caas-3D C19L34.3D–Xgwm191c 103.2 0.9315⁎⁎ 4.59 0 QTGW.caas-4B Xgwm0925–Xgwm0898 84.9 2.1747⁎⁎ 15.47 3.39 QTGW.caas-4D Xpsp3007–DFMR2 67.0 −2.1228⁎⁎ 18.30 2.66
a Additive effects. Positive values indicate that alleles were derived from YZ1; negative values indicate that the alleles were derived from
NX188.bPercentage of phenotypic variation explained by QTL with additive effect.cPercentage of phenotypic variation explained by QE
values for PH and TGW, and negative values for FHB and GNS suggested that alleles from YZ1 increased PH and TGW but reduced FHB resistance and GNS, or alternatively, the allele from NX188 with the effect of reducing PH and TGW but increasing FHB resistance and GNS. Three QTL (QPH.caas-4D,QTGW.caas-4D andQFHB.caas-4D) were mapped in the region between markers Xpsp3007 and DFMR2 on chromosome 4D, the position of dwarfing gene,Rht-D1. The allele from YZ1 for the QTL cluster reduced PH, TGW and FHB resistance or alternatively the allele from NX188 increased PH, TGW and FHB resistance. Three QTL
(QGNS.caas-5A, QSC.caas-5AandQSPI.caas-5A) were in the region Xgwm304–Xbarc56on chromosome 5A. The YZ1 allele in this QTL cluster had the effect of increasing GNS and SPI and reducing SC. Five QTL (QGNS.caas-5D,QPH.caas-5D,QSPI.caas-5D,QSL.caas-5D and QFHB.caas-5D) were mapped between Xgwm292 and Xgwm269 on chromosome 5D, the location of vernalization geneVrn-D1. The NX188 allele at this locus had a large effect on simultaneously increasing FHB resistance, GNS, SL, and SPN, and with low interaction with PH. Finally, four QTL (two with additive and two epistatic effects) were mapped in theTaCK7B–Xwmc276
Fig. 1–Positions of QTL associated with PH, SL, SPI, SC, GNS, TGW and FHB resistance in wheat. Red color indicates additive QTL and black indicates epistatic QTL.
region on chromosome 7B. TaCK7B is a cytokinin-oxidase/ dehydrogenase gene controlling cytokinin levels in plant tissues
[21].
3.3. MAS for developing elite lines with improved FHB
resistance and agronomic traits
MAS was carried out to select elite lines with high FHB resistance and good agronomic traits. Among them, FHB was treated as first priority. Six elite lines were selected based on this criterion (Table 5). All had better agronomic traits (Table 6) than the others. No significant differences were detected between the observed and predicted values for all seven traits with SPI in the 2004–2005 cropping season (P= 0.05) as the only exception. These results indicated a high efficiency of MAS in this study (Table 5). For example, for FHB resistance, RIL-151 and RIL-164 carried all five resistance alleles, and showed the best FHB resistance. RIL-31,
RIL-68, RIL-130 and RIL-169 possessed four of the five resistance alleles). For other agronomic traits, these lines carried more favorable alleles than others. The lines should be useful as parents for conventional breeding and MAS because germplasm with both good FHB resistance and other agronomic traits is rare.
4.
Discussion
4.1. Analysis of QTL for FHB resistance
Numerous sources of FHB resistance that have been geneti-cally mapped to chromosomes are from many countries in Asia, North America, South America, and Europe[9]. In this study, we identified five additive QTL associated with FHB resistance on chromosomes 2D, 4B, 4D, 5B and 5D. Among them, QFHB.caas-4DandQFHB.caas-5Dshowed larger effects
Table 3–Identified QTL with epistatic effects and QE for agronomic traits over two years.
QTL Marker interval Site (cM) QTL Marker interval Site (cM) AAa R2AA(%)b R2AAE(%)c
Resistance to FHB
QFHB.caas-4B Xgwm0925–Xgwm0898 84.9 QFHB.caas-4D Xpsp3007–DFMR2 68.0 −0.2288⁎⁎ 0.94 0.73 Grain number per spike
QGNS.caas-1B Xwmc406–cwm54 47.6 QGNS.caas-5B-2 Xgwm133–Xgwm 544 56.3 1.5598⁎⁎ 6.02 0 Plant height
QPH.caas-4D Xpsp3007–DFMR2 68.0 QPH.caas-5D Xwm292–Vrn-D1 1.1 1.0926⁎⁎ 0.58 0.01
QPH.caas-2A Xgwm425–Xgwm122 62.9 QPH.caas-3B XwPt7015–Xgwm376 39.6 −1.8473⁎⁎ 1.52 0
QPH.caas-2B Xgwm410–Xpsp3035 29.4 QPH.caas-3A Xbarc218–Xwmc505 29.4 1.6044 0.85 0
QPH.caas-4A Xcfd71b–Xcfd71a–2 9.2 QPH.caas-6A XwPt7063–XwPt7486 87.2 −2.2644 1.49 0.02 Spike length
QSL.caas-4A.3 Xwmc497–Xbarc70 13.0 QSL.caas-7B2 XwPt8938–TaCK7B 95.7 0.1836⁎⁎ 1.68 0
QSL.caas-4A.1 Xcfd71a.2–Xgwm397 10.1 QSL.caas-5D Xgwm292–VrnD 1.1 0.1316 1.33 0.16
QSL.caas-4A.1 Xcfd71a.2–Xgwm397 10.1 QSL.caas-7B1 TaCK7B–Xwmc276 113.0 0.1070⁎⁎ 0.53 0.01 Spikelet number per spike
QSPI.caas-4B Xgwm6–Xwmc413 51.4 QSPI.caas-6B Xwmc427–Xgwm518b 39.0 −0.3434⁎⁎ 2.86 0.15
QSPI.caas-5B Xgwm408–Xwmc235 2.6 QSPI.caas-5D Xgwm292–VrnD1 1.1 0.1759⁎⁎ 0.57 2.41 Spike compactness
QSC.caas-2B.1 Xgwm388–Xgwm55 72.1 QSC.caas-2D Xwmc111–Xwmc112 74.6 −0.0584⁎⁎ 1.27 0
QSC.caas-2B2 Xgwm191a–Xgwm526b 201.6 QSC.caas-2D Xwmc111–Xwmc112 74.6 0.1034⁎⁎ 0.82 0
QSC.caas-5B Vrn B1–Xwmc75 0 QSC.caas-6B Xbarc79–Xbarc1008 74.9 0.0467⁎⁎ 1.58 0
QSC.caas-6B Xbarc79–Xbarc1008 74.9 QSC.caas-7B TaCK7B–Xwmc276 112.0 0.0488⁎⁎ 2.78 0.2 Thousand-grain weight
QTGW.caas-4B Xgwm0925–Xgwm0898 84.9 QTGW.caas-4D Xpsp3007–DFMR2 67.0 0.9569⁎⁎ 1.07 0.09
QTGW.caas-2A.2 Xgwm558–Xgwm473 78.8 QTGW.caas-2A1 Xpsp3039–Pm4 209.8 0.7373 1.88 0.23
QTGW.caas-2D Xcfd2–Xgwm515 143.2 QTGW.caas-6D Xcfd42–Xgwm469 45.7 −1.3133 3.81 0.56
a Epistatic effects. Positive value indicates parent effect is greater than the recombinant effect; a negative value indicates the opposite.b
Percentage of variation explained by epistatic QTL.cPercentage of variation explained by QE interaction.⁎⁎Significance atP= 0.001.
Table 4–Additive QTL clusters and their effects on FHB and agronomic traits.
Chr. Cluster interval Trait
GNS PH SC SPI SL TGW FHB 2D Xwmc111–Xwmc112 4.3070⁎⁎ −0.1301⁎⁎ 0.4892⁎⁎ −0.3679⁎⁎ 4B Xgwm0925–Xgwms0898 −1.8482⁎⁎ 8.0044⁎⁎ 2.1747⁎⁎ −0.4341⁎⁎ 4D Xpsp3007–DFMR2 −8.4021⁎⁎ −2.1228⁎⁎ 0.5727⁎⁎ 5A Xgwm304–Xbarc56 1.0243⁎⁎ −0.0267⁎⁎ 0.2200⁎⁎ 5D Xgwm292–Vrn-D1 −1.3031⁎⁎ −1.5159⁎⁎ −0.9349⁎⁎ −0.3119⁎⁎ 0.6017⁎⁎ 7B TaCK7B–Xwmc276 −0.0580⁎⁎ 0.1831⁎⁎
⁎⁎ Indicates significance atP= 0.001. GNS: grain number per spike; PH: plant height; SC: spikelet compactness; SPI: spikelet number per spike; SL: spike length; TGW: thousand-grain weight; FHB: Fusarium head blight.
than other QTL, explaining 7.01% and 12.87% of the phenotypic variation, respectively. Korean cultivar, Chokwang, was reported to carryQfhs.ksu-5DL.1for type II FHB resistance[22]. A minor QTL (R2= 4%) on chromosome 5DL was reported in a RIL population derived from a cross between European winter wheat cultivars Renan and Recital[23]. While SSR markerXgwm292was closely linked toQFHB.caas-5Din this study, the same QTL for type II resistance was detected in a Wangshuibai/Wheaton RIL popula-tion [24]. This indicated that QFHB.caas-5D conferred type II FHB resistance. In a similar region to QFHB-caas-4D, another QTL conferred Type I resistance using a different population
[25,26]. Thus,QFHB-caas-4Didentified in this study was probably associated with Type I resistance. In addition,QFHB-caas-4Bwas in the same region to that reported by Buerstmayr et al.[10]. It therefore should be a reliable locus for FHB resistance.
4.2. Correlation between FHB resistance and agronomic traits
Mechanisms of FHB resistance in wheat can be addressed from the viewpoint of morphology, physiology and biochemistry. Negative correlations between visual FHB symptoms and some agronomic traits such as plant height have been reported[2,9]. Co-localizations were also found between FHB resistance and
QTL for plant height and spike architecture in barley[27]. In this study, the locations ofQPH.caas-2D,QPH.caas-4BandQPH.caas-4D were the same asQFHB.caas-2D,QFHB.caas-4BandQFHB.caas-4D, respectively.QFHB.caas-4Dwas located in the intervalXpsp3007– DFMR2, and QFHB.caas-2D was located between Xwmc11 and Xwmc112. Wheat dwarfing genesRht-B1andRht8are located on chromosomes 4D and 2D, respectively. DFMR2 was used for detectingRht-B1 allelic variation[28]. Compared with the high density wheat integration map[29],Xwmc112was very close to Xgwm261which is closely linked toRht8. Since plant height was reduced, the probability of soil surface spore infection was increased, and the high humidity environment was conducive to FHB disease development. In the same or a similar interval between Xgwm292 and Vrn-D1, there were five additive QTL conferring different traits, includingQFHB-caas-5D(Fig. 1). These co-localizations showed that linkages may exist between genes for FHB resistance and agronomic traits that are independent of pleiotropic effects.
4.3. Simultaneous QTL detection and MAS
Gene/QTL detection and MAS are often carried out separately. Although hundreds of genes/QTL have been detected, progress in
Table 5–Genotypes of six selected RILs.
Locus Marker RIL-31 RIL-68 RIL-130 RIL-151 RIL-164 RIL-169
QTGW.caas-2A Xpsp3039 B B B A A B QGNS.caas-2B Xgwm429 B A A A B A QTGW.caas-2B Xgwm191a B A A A A A QFHB.caas-2D Xwmc112 A B A A A B QTGW.caas-3D C19L34.3D A A — B B — QFHB.caas-4B Xgwm 0898 B A A A A A QGNS.caas-4B Xcfd39a B A A A B A QFHB.caas-4D DFMR2 B B B B B B QGNS.caas-5A Xbarc56 B B B B B A QPH.caas-5A Xwmc327 — A B A A A QFHB.caas-5B Xwmc28 B B A B B B QGNS.caas-5B Xgwm 408 — B B B — B QFHB.caas-5D Xgwm 292 B B B B B B
A: source of QTL allele from YZ1; B: source of QTL allele from parent NX188.
Table 6–Agronomic traits of six YZ1/NX188 RILs with superior resistance to FHB in RILs.
Trait Year RIL-31 RIL-68 RIL-130 RIL-151 RIL-164 RIL-169 P-value
Resistance score 2004–2005 2 2 2 2 2 2 0.0614
2005–2006 2 2 2 2 2 2 0.3173
Grain number per spike 2003–2004 65.6 56.4 51.2 52.4 56.0 60.0 0.6188
2004–2005 50.0 40.4 42.8 44.0 46.4 50.4 0.9919
Plant height (cm) 2003–2004 70.4 89.2 85.4 98.6 87.2 75.2 0.9133
2004–2005 77.6 83.2 90.4 90.4 92.6 77.2 0.2802
Spike length (cm) 2003–2004 10.6 10.0 9.7 12.7 12.5 10.7 0.2886
2004–2005 11.2 8.5 10.1 11.1 11.0 9.3 0.3689
Spikelet numberper spike 2003–2004 23.0 22.6 20.4 22.8 22.4 23.6 0.4655
2004–2005 23.4 23.2 23.4 23.6 25.0 23.4 0.0431⁎
Spike compactness 2003–2004 2.17 2.26 2.10 1.80 1.79 2.21 0.0868
2004–2005 2.09 2.73 2.32 2.13 2.27 2.52 0.6284
Thousand-grain weight (g) 2003–2004 51.29 53.33 41.62 51.84 49.30 44.80 0.0922
2004–2005 52.17 47.14 42.01 48.32 46.58 43.05 0.9913
utilization MAS has been slow. The main reason for this was that markers detected in one population are often not applicable to other populations. In the present study, we combined gene/QTL detection and MAS using a RIL population. The advantages of this approach are as follows: (1) all the markers detected are efficient for MAS, and do not need to be validated again; (2) Gene/QTL detection and MAS are carried out simultaneously, shortening the time of MAS; (3) the genotypes of all selected new varieties/ elite lines are known, a feature that will be helpful in further genetic improvement. For example, of the five QTL for FHB resistance, there are four favorable alleles for FHB resistance in RIL-169, and only favorable alleleQFHB.caas-2Dwas absent. To further improve its FHB resistance, RIL-169 and RIL-151 can be crossed in order to addQFHB.caas-2Din a genetic background that is largely shared with RIL-169 (Table 5). New varieties with better FHB resistance and agronomic traits than RIL-169 will be easily bred. To carry out QTL detection and MAS simultaneously, the precondition is to construct a segregating population with both target traits and a better background of traits of agronomic importance. In the present study, six elite lines were selected from a cross of well adapted varieties. In conclusion, the results from this study suggest that QTL detection and MAS can be integrated using appropriate populations. This approach will significantly accelerate MAS in the future.
Acknowledgments
This study was supported by the National R&D Project of Transgenic Crops of the Ministry of Science and Technology of China and the Priority Academic Program Development of Jiangsu Higher Education Institutions. We thank Dr. Chunji Liu, CSIRO Plant Industry, Queensland, Australia, Dr. Yunbi Xu, Institute of Crop Science, Chinese Academy of Agricultural Sciences, for English improvement.
R E F E R E N C E S
[1] H.W. Schroeder, J.J. Christensen, Factors affecting resistance of wheat to scab caused byGibberella zeae(Schw.),
Phytopathology 53 (1963) 831–838.
[2] A. Mesterhazy, Types and components of resistance to Fusarium head blight of wheat, Plant Breed. 114 (1995) 377–386.
[3] G.H. Bai, G. Shaner, Management and resistance in wheat and barley to Fusarium head blight, Annu. Rev. Phytopathol. 42 (2004) 135–161.
[4] P. Chen, D. Liu, W. Sun, New countermeasures of breeding wheat for scab resistance, in: H.J. Dubin, L. Gilchrist, J. Reeves, A. McNab (Eds.), Fusarium Head Scab: Global Status and Future Prospects, CIMMYT, Mexico, 1997, pp. 59–65.
[5] J.B. Yao, W.Z. Lu, Research advances in wheat breeding for scab resistance in China, J. Agric. Sci. 16 (2000) 242–248(in Chinese with English abstract).
[6] G.H. Bai, F.L. Kolb, G.E. Shaner, L.L. Domier, Amplified fragment length polymorphism markers linked to a major quantitative trait locus controlling FHB resistance in wheat, Phytopathology 89 (1999) 343–348.
[7] G.H. Bai, G. Shaner, H. Ohm, Inheritance of resistance to
Fusarium graminearumin wheat, Theor. Appl. Genet. 100 (2000) 1–8.
[8] H.X. Ma, G.H. Bai, X. Zhang, W.Z. Lu, Main effects, epistasis, and environmental interactions of quantitative trait loci for Fusarium head blight resistance in a recombinant inbred population, Phytopathology 96 (2006) 534–541.
[9] H. Buerstmayr, T. Ban, J.A. Anderson, QTL mapping and marker-assisted selection for Fusarium head blight resistance in wheat: a review, Plant Breed. 128 (2009) 1–26.
[10] M. Buerstmayr, K. Huber, J. Heckmann, B. Steiner, J.C. Nelson, H. Buerstmayr, Mapping of QTL for Fusarium head blight resistance and morphological and developmental traits in three backcross populations derived fromTriticum dicoccum×Triticum durum, Theor. Appl. Genet. 125 (2012) 1751–1765.
[11] B.L. Waldron, B. Moreno-Sevilla, J.A. Anderson, R.W. Stack, R.C. Frohberg, RFLP mapping of QTL for Fusarium head blight resistance in wheat, Crop Sci. 39 (1999) 805–811.
[12] J.A. Anderson, R.W. Stack, S. Liu, B.L. Waldron, A.D. Fjeld, C. Coyne, B. Moreno-Sevilla, J.M. Fetch, Q.J. Song, P.B. Cregan, DNA markers for Fusarium head blight resistance QTLs in two wheat populations, Theor. Appl. Genet. 102 (2001) 1164–1168.
[13] J.A. Anderson, S.M. Chao, S.X. Liu, Molecular breeding using a major QTL for Fusarium head blight resistance in wheat, Crop Sci. 47 (2007) S112–S119.
[14] W.C. Zhou, F.L. Kolb, G. Bai, G. Shaner, L.L. Domier, Genetic analysis of scab resistance QTL in wheat with microsatellite and AFLP markers, Genome 45 (2002) 719–727.
[15] Z.Z. Liu, Z.Y. Wang, W.J. Zhao, A study on FHB resistance of wheat germplasm source, Acta Agric. Shanghai 1 (2) (1985) 75–84(in Chinese with English abstract).
[16] L. Tamburic-Ilincic, D. Falk, A. Schaafsma, Fusarium ratings in the Ontario Winter Wheat Performance Trial (OWWPT) using an index that combines Fusarium head blight symptoms and deoxynivalenol levels, Czech J. Genet. Plant Breed. 47 (2011) S115–S122.
[17] Q. Yao, Y.X. Song, R.H. Zhou, T.H. Fu, J.Z. Jia, Quantitative trait loci for adult-plant resistance against yellow rust in a wheat-derived recombinant inbred line population, Sci. Agric. Sin. 42 (2009) 4234–4241(in Chinese with English abstract).
[18] D.L. Wang, J. Zhu, Z.K. Li, A.H. Paterson, Mapping QTLs with epistatic effects and QTL × environment interactions by mixed linear model approaches, Theor. Appl. Genet. 99 (1999) 1255–1264.
[19] R.A. McIntosh, G.E. Hart, K.M. Devos, M.D. Gale, W.J. Rogers, Catalogue of gene symbols for wheat,http://grain.jouy.inra. fr/ggpages/wgc/98/Intro.htm#Intro61988.
[20] X.K. Zhang, S.J. Yang, Y. Zhou, Z.H. He, X.C. Xia, Distribution of theRht-B1b,Rht-D1bandRht8reduced height genes in autumn-sown Chinese wheats detected by molecular markers, Euphytica 152 (2006) 109–116.
[21] L. Zhang, B.S. Zhang, R.H. Zhou, L.F. Gao, G.Y. Zhao, Y.X. Song, J.Z. Jia, Cloning and genetic mapping of cytokinin oxidase/dehydrogenase gene (TaCKX2) in wheat, Acta Agron. Sin. 33 (2007) 1419–1425(in Chinese with English abstract).
[22] Z.P. Yang, J. Gilbert, G. Fedak, D.J. Somers, Genetic characterization of QTL associated with resistance to Fusarium head blight in a doubled-haploid spring wheat population, Genome 48 (2005) 187–196.
[23] L. Gervais, F. Dedryver, J.Y. Morlais, V. Bodusseau, S. Negre, M. Bilous, C. Groos, M. Trottet, Mapping of quantitative trait loci for field resistance to Fusarium head blight in an European winter wheat, Theor. Appl. Genet. 106 (2003) 961–970.
[24] J. Yu, G. Bai, W. Zhou, Y. Dong, F.L. Kolb, Quantitative trait loci for Fusarium head blight resistance in a recombinant inbred population of Wangshuibai/Wheaton, Phytopathology 98 (2003) 87–94.
[25] J. Yang, G. Bai, G.E. Shaner, Novel quantitative trait loci (QTL) for Fusarium head blight resistance in wheat cultivar Chokwang, Theor. Appl. Genet. 111 (2005) 1571–1579.
[26] R. Draeger, N. Gosman, A. Steed, E. Chandler, M. Thomsett, J. Schondelmaier, H. Buerstmayr, M. Lemmens, M. Schmolke, A. Mesterhazy, Identification of QTLs for resistance to Fusarium head blight, DON accumulation and associated traits in the winter wheat variety Arina, Theor. Appl. Genet. 115 (2007) 617–625.
[27] Z.X. Ma, B.J. Steffenson, L.K. Prom, N.L.V. Lapitan, Mapping of quantitative trait loci for Fusarium head blight resistance in barley, Phytopathology 90 (2000) 1079–1088.
[28] H. Ellis, W. Spielmeyer, K. Gale, G. Rebetzke, R. Richards,
“Perfect”markers for theRht-B1bandRht-D1bdwarfing genes in wheat, Theor. Appl. Genet. 105 (2002) 1038–1042.
[29] D.J. Somers, P. Isaac, K. Edwards, A high-density microsatellite consensus map for bread wheat (Triticum aestivumL.), Theor. Appl. Genet. 109 (2004) 1105–1114.