Wealth Concentration over the Path of Development:
Sweden, 1873–2005
∗Jesper Roine♣ and Daniel Waldenström
SSE/EFI Working Paper Series in Economics and Finance No. 677
October 15, 2007
Abstract:
We study the development of wealth concentration in Sweden over 130 years, from the begin-ning of industrialization until present day. Our series are based on a wide array of new evi-dence from estate- and wealth tax data, estimates of foreign and domestic family firm-wealth and of pension and social security wealth. We find that the Swedish wealth concentration was at a historically high level in the agrarian state and that it did not change much during early in-dustrialization. From World War I up until about 1950, the richest percentile lost ground to the rest of the top wealth decile where relatively income rich households accumulated new wealth. In the postwar period, the entire top decile lost out relative to the rest of the population, much due to the spread of owner-occupied housing. Around 1980, wealth compression stopped and inequality increased. We introduce new ways of approximating the effects of international flows and find that the recent increase in Swedish wealth inequality is likely to be larger than what official estimates suggest.
Keywords: Wealth concentration, Wealth distribution, Inequality, Income distribution, Swe-den, Welfare state, Pension wealth, Augmented wealth
JEL codes: D14, D31, N33, N34
∗ We would like to thank Bo Bergman, Gunnar Blomberg, Annika Sundén and participants at the European
His-torical Economics Society Conference in Lund, 2007 for suggestions and comments. A special thanks to Henry Ohlsson who has been a valuable contributor to parts of this project.
♣ SITE, Stockholm School of Economics, P.O. Box 6501, SE-113 83 Stockholm, Ph: +46-8-7369682, E-mail: [email protected]
1 Introduction
Theories about the dynamics of the wealth distribution are typically concerned with the long run, as most famously exemplified by Kuznets’ hypothesis about the rise and fall of inequality over development. However, comparable data covering sufficiently long periods to evaluate such theories are scares.1 The main contribution of this paper is to provide new series of wealth concentration in Sweden for the years 1873–2005, thus covering a period from the beginning of industrialization to present day. By constructing alternative series using both estates and wealth tax data we believe our data gives a robust representation of the develop-ments over time.2
Besides allowing us to study changes in inequality over the transition from an agrarian to an industrial economy, there are other reasons for why the case of Sweden is particularly inter-esting. First, over the 20th century Sweden developed the world’s most extensive welfare state with a strong egalitarian emphasis. Putting wealth equalization in historical perspective is crucial for understanding the achievements of the Swedish welfare state but also to get fur-ther insights to the society in which it gained popular support. Second, comparing wealth con-centration over time in Sweden with the patterns for France (Piketty, Postel-Vinay and Rosen-thal, 2006), Switzerland (Dell, Piketty and Saez 2007), and the United States (Kopczuk and Saez, 2004) is interesting as Sweden was not affected by the main economic and geopolitical shocks that have been identified as major causes of decreased top wealth shares in these coun-tries.3
Several important findings come out of our analysis. Our main series suggest that the period 1873–2005 can be divided into three broad phases based on how wealth concentration has
1 Recent studies on long run wealth concentration are Piketty, Postel-Vinay and Rosenthal, 2006 (France); Dell,
Piketty and Saez, 2007 (Switzerland); and Kopczuk and Saez, 2004 (US). Out of these it is only the data for France that covers the whole industrialization. Lindert (2000) provides an overview of previous work on histori-cal wealth statistics.
2 Spanning 130 years our series are the longest available estimates of the evolution of wealth distribution in
Swe-den to date. Spånt (1979, 1987) cover the years 1920-1983. Our main series are, due to availability of data, lim-ited to shares of total wealth held by the top decile of the distribution (and fractiles within this group). This is, however, not very restrictive in terms of capturing most of the wealth since concentration has been very high for most of the period. Furthermore, the share held by the rest of the population is of course captured as a residual.
3 Sweden did not participate in any of the World Wars and was not affected much by the great depression (but
did experience a different stock-market crash in 1932 with important consequences for top wealth holders). Swit-zerland, of course, did not participate in the World Wars either but on the other hand Sweden and Switzerland differ on many other accounts, in particular with respect to the size of government
evolved. First, though data are scarce for the period before World War I, our estimates sug-gest that wealth was concentrated in the agrarian economy but also that it did not change much during the initial phase of industrialization. The slight increase that we find is limited the top one percent gaining at the expense of the other groups, hence, giving only limited sup-port to the idea inequality increases in the early stages of industrialization. Second, from the 1910s up to the early 1980s, wealth became significantly less concentrated. In the beginning of this period a number of major institutional changes in society took place. The franchise was extended, first to all men in 1907 and then universally in 1921, progressive taxation was in-troduced, first for income, in 1903, and then extended to include wealth in 1911. However, none of these changes seem directly related to the initial phase of wealth compression, which was characterized by wealth being more evenly spread within the top decile as the top percen-tile lost out to the following nine. Instead it looks as if the development before 1950 was mainly driven by accumulation among groups with relatively high incomes but little previous wealth. Thanks to the way in which income and wealth taxes were reported we can calculate the wealth share for different income groups and we find that the wealth shares of high in-come earners - but not for the very top – increase in the first half of the twentieth century. After 1950 the wealth compression looks different, with sharp increases in “popular wealth” (mainly owner-occupied housing) among the broader population (the P0–90 group). Between 1950 and 1980, the entire top decile loses ground to the rest of the population. Overall, this development of gradual leveling, first based on accumulation among relatively income rich groups and then moving down the distribution, is consistent with a Kuznets-type process. It also suggests that what happened in Sweden was different, from, for example, the French ex-perience where the decline was mainly driven by exogenous shocks as shown by Piketty et al. (2006).
Finally, in the early 1980s the long period of wealth leveling came to a halt. According to official wealth tax-based estimates inequality has, however, remained at historically low lev-els with only slight increases in the past decades. At the same time there are reasons to believe that these statistics underestimate the recent increases in wealth concentration. The period after 1985 was characterized by a surge in stock market-listed financial asset values, increas-ing by over 20 percent per year in real terms (and known to be concentrated in ownership) as well as with the removal of capital controls. There is also plenty of anecdotal evidence of Swedes moving themselves or their wealth abroad to avoid high wealth and inheritance taxes.
We use the official national statistics over the balance of payments and the financial accounts to estimate the size of “unexplained” financial savings (or “capital flight”) of households and use these estimates to get a sense of their possible impact on wealth inequality. Naturally, the great uncertainty associated with these numbers forces us to present a collection of estimates where we use alternative sources and different assumptions about the size and the distribution of foreign wealth, as well as rates of return on accumulated foreign holdings. Our basic find-ing is that official statistics are likely to underestimate the recent increase in wealth concentra-tion, possibly quite substantially, and that we may have entered a new phase of increased wealth concentration where the measurement of this becomes more difficult as capital in more internationalized. Our analysis also point to a number of more conceptual problems with measuring wealth (or income) inequality of a country when residency and even citizenship may be “internationalized”.
2 Measurement issues and data 2.1 Measurement issues
Our main concept of wealth is net worth, or net marketable wealth, defined as the sum of real and financial assets less debts. This is the standard measure of personal wealth in wealth ine-quality research and it is also the by far most common measure in historical tax-based sources of wealth inequality for most countries.4 In the case of Sweden, net worth is what has been specified in the taxation of estates and of wealth.5
The concept of net worth does not include pension wealth in the form of public pension rights, nor does it include human capital wealth. Pension rights are relatively important in the case of Sweden, not only when comparing current inequality estimates across countries, but also when considering the historical development in Sweden as these systems have grown from non-existence to being important parts of personal wealth. For this reason we will also present some estimates of the Swedish wealth concentration when using augmented wealth,
4 For an overview of international wealth concentration data, see Ohlsson et al. (2006).
5 Naturally, there is a discrepancy between the conceptual and practical contents of net worth. Although they
include the same items there are potentially vast differences in how they have been valued. Spånt (1979) dis-cusses how the differences between market values and tax-assessed values have influenced the composition of wealth. Historically, however, the distributional differences turn out to be relatively small in the aggregate for most items. In the robustness section of the paper we also address the impact of this on our estimated wealth shares.
which is the wealth concept that includes contributions into pension schemes and future social security payments.
The measurement of net worth is also sensitive to the valuation of assets. For example, taxa-tion values may be quite different from market values and this naturally affects the absolute value of an individual’s wealth. But if this discrepancy is similar across the distribution, the effect on the wealth shares may be small. We use a number of alternative estimates of aggre-gate wealth (taxation or market values as well as estimates including items which have not been taxable) and different assumptions about the distribution of the difference between these alternative reference totals and our baseline. This exercise suggests some differences in the levels of wealth shares but the trends remain unchanged. Overall, we believe that the compa-rability of our estimated shares is good over time, while the compacompa-rability of the absolute val-ues over time would be more problematic.
The concept of wealth owner used in the study varies depending on what data source is used. The Swedish wealth tax always refers to taxed “households”. Married couples count as one tax unit as do children 18 years or older living at home. The estate data is individual-based.6 These units of analysis may not be the most appropriate ones if one is mostly interested in welfare analysis when instead defining households according to living arrangements could be preferred.
Our chosen measure of wealth distribution is the wealth share held by some fraction of the population, i.e., the share of total wealth held by the wealthiest five percent or the wealthiest one percent of the population. As is typically the case when using historical data we face a problem with measuring the reference total of net personal wealth of the whole population. The wealth tax data typically only cover the households in the top 5 percentiles that have paid wealth tax and we must therefore limit our observations to years when attempts to measure the corresponding total for the whole population have been maid. This has been done in some
6 In some cases the estate reports, however, include joint property if there is a surviving spouse and the property
of the past Censuses and in a few special public investigations but there are many years for which we have distributional information for the top but no reliable reference total..7
2.2 Data
Our main series on the Swedish wealth concentration are based on information about personal wealth statements in estate tax returns (various years in the period 1873–2003) and wealth tax returns (various years in the period 1911–2005).8 Both tax and estate data are problematic in several ways (as we discuss below), but they are the only viable alternative for studying wealth concentration over longer time periods. Also, the fact that we can compare trends based on wealth tax and estate tax data, respectively, means that we can be more confident in the accuracy of our findings. In addition to these standard sources, our study also introduces the use of foreign household wealth data drawing on statistical estimates in the balance of payments and the financial accounts from the 1970s. As a consequence of Sweden’s high wealth taxes and liberalized capital account (after 1989) these foreign holdings have been claimed to be substantial. We also use journalistic estimates of wealth of super rich Swedes in order to assess the possible influence of closely held family firms (that do not show up on tax returns) on the standard measures of inequality. Finally, we present some estimates of the level of augmented wealth concentration, but due to data limitations these estimates are lim-ited to a few years in the last decades.
2.2.1 Estate data
Estate data is probably the most commonly used source for deriving measures of wealth dis-tribution. The time of death is often the only time when an individual’s total assets and debts are revealed for the purpose of estate division and estate or inheritance taxation. Assuming that those who die in any given year constitute a random sample of the living population of the same sex and age, one can convert the distribution of wealth among those who died into the distribution for the living using a mortality multiplier, which weights the individual estates in different age groups (controlling for sex and sometimes also for social status) by the death rates in the respective groups.9 Our Swedish estate data are mainly in the form of grouped
7 For example, Flodström (1914) presents data on the very top for the year 1912 and for all years since 1945
Statistics Sweden published annual reports on wealth tax returns for the top, but with no indications about reli-able reference totals for net personal wealth.
8 There are some other sources of wealth data, in particular household surveys, which we do not use. The reason
is mainly that they contain too few observations to allow a comprehensive analysis of the top of the distribution.
distributions for the diseased, except for 1908 when mortality multipliers were applied. Hence, our estate-based wealth concentration estimates do not reflect the living population, but whether this matters much in terms of level or trends is an open question.10 Judging from the behavior of the estate series when compared to our tax based series for periods when they overlap they should at least give a correct indication of the trends in inequality. Another po-tential problem with estate data is that for single observations, large individual estates may have a large impact on the estimates, but as we are able to use consecutive years the risk of having influential outliers becomes smaller. Our dataset draws on estate tax reports, beginning in 1873-77, which are the earliest years for which tabulated estate distributions are available, and continuing with 1906-08, 1942, 1943, 1954/55, 1967, and 2002-03, covering a total of 130 years.11
2.2.2 Wealth tax data
Compared to estimating the wealth distribution based on estate data, wealth tax data is a more direct way to measure what we really wish to estimate: the distribution of wealth in the (liv-ing) population. Wealth tax returns have also been the main source for studies of Swedish wealth inequality due to its relative availability. However, there are important problems asso-ciated with this data source which severely impedes the study of wealth concentration. First, only a minority of the population has paid wealth taxes and the construction of reference wealth totals for the whole population is therefore problematic.12 Second, consumer durables are quite imperfectly covered in the wealth tax returns, which could imply a significant un-derestimation of “popular wealth”.13 Third, pension wealth is not included in our analysis mainly because it is mostly not controlled directly by the households but rather a claim of
10 According to data from France in Piketty et al. (2006) the differences seem to be marginal. Atkinson (2006),
however, point to British wealth studies using estates where the differences have been sizeable.
11 The sources of the estate data are the Ministry of Finance (1879, 1910) and SOU (1946, 1957, 1969, 2004).
Only for the year 1908 is there data based on applying the estate multiplier method to the estate data, see the Ministry of Finance (1910: 14-34). For the other years we can only calculate top wealth shares at death. Estate taxes were being levied already in the eighteenth century but from these early years there is no compiled distri-butional evidence available on the national level (see Ohlsson, 2006).
12 Survey data are better since the survey can be designed so as to include (or exclude) items regardless of the tax
law and the sample can be drawn so as to represent the whole distribution, but at the same time this particular feature is a major problem when it comes to studying wealth concentration. Wealth is typically very concentrated and, therefore, a randomized sample of the whole population must be very large to cover sufficiently many in the very top to get a reliable picture.
13 The absence of consumer durables (furniture, household appliances, machinery, art, antiquities etc) could
reduce wealth concentration notably. Estimates in Jansson and Johansson (1988, ch. 7) indicate that they would decreases the top wealth percentile’s share in 1985 by a third. This is, however based on the assumption that durables not included in the tax material are relatively evenly distributed in the population, which we do not think is likely to be the case (see the further discussion below).
future cash flows (net of tax). This is perhaps our most problematic coverage issue since ten-tative analyses suggest that pension wealth could reduce the concentration of wealth most substantially. Fourth, the wedge between tax-assessed and market-based values of personal assets has varied over time. Prior to the 1980s market values in the heavily regulated Swedish economy were in general not much above tax-assessed values, but after 1980 market values have increased dramatically.14 Our main series are based on market value-adjusted wealth data computed by Statistics Sweden for various years from 1975 onwards.15 For the historical data, we use tabulated wealth distributions reported in the Censuses in 1920, 1930, 1935, 1945, 1951, wealth tax tabulations published by Statistics Sweden for 1927, 1937, 1938, 1940, 1951 and 1956, and finally some specific investigations from 1966, 1970, and 1975, all based on wealth tax returns. Notable is that in all of these surveys, rich households are over-sampled and their coverage for studying wealth concentration is hence likely to be good.
2.2.3 Foreign household wealth data
Sweden has had a high-wealth tax during the entire postwar period. However, it was not until drastic increases of real and financial asset values of the 1980s and the removal of capital con-trols in 1989 that we see indications of substantial tax-driven outflows of private wealth from the country. No previous studies have analyzed the extent to which this foreign wealth would influence the measured domestic inequality if added to the disclosed domestic wealth.16 We therefore introduce an approach to analyze this by combining the standard estimates of
14 Spånt (1979, pp. 87-93) gives estimates for real asset values based on Census information and miscellaneous
historical price statistics. In the case of financial asset values, Waldenström (forthcoming) shows that the de-flated composite stock price index at the Stockholm Stock Exchange was a basically constant level between the first observation in 1906 and 1986 when prices took off.
15 For 1975 we use numbers from Spånt (1979). For single years in 1978–1997 we use data from Jansson and
Johansson (1988) and Jansson and Johansson (2000) who have employed micro-data evidence in the HINK database (a representative sample of about 10,000 households for which wealth tax returns and interview mate-rial are available), with a full sampling of the richest 1,500 households. One of the most problematic items in these data are condominiums, whose market values are quite difficult to assess (see further Jansson and Johans-son, 1988, pp. 68-73, 140-141). For 1999–2005 our data come from Statistics Sweden’s household surveys (HEK), based on a sample population of about 19,000 households, and wealth information drawn from the Wealth Register (Förmögenhetsregistret), an individual-based database using personal tax assessment and con-trol information from authorities, banks and so forth (see further Statistics Sweden, 2005, 2006, 2007). in which all assets are adjusted to market values.
16 Jansson and Johansson (1988, pp. 163-165) come the closest in their discussion of how the emigration of 100
rich families (assuming different sizes of their wealth) would affect domestic wealth inequality. Unlike them, we analyze the foreign wealth of households that have remained in Sweden (i.e., residents). Moreover, we actually do analyzes the emigrated Swedes as well in the robustness section, and then make use of the journalistic esti-mates of the wealth of the about 30-50 named super rich Swedish households residing in foreign countries. In their study of wealth concentration in Switzerland, Dell et al. (2007) data on foreigner’s wealth in the 1990s as reported to Swiss authorities are analyzed. However, the wealth is not related to country of citizenship or sys-tematically linked to inequality estimates in other countries.
mestic household wealth (discussed above) with similarly standard estimates of foreign household wealth in the Balance of Payments (B.o.P) and Financial Accounts (F.A.) statistics. In the robustness section, we also present a third source of foreign household wealth. This is households who have taken both their wealth and themselves out of the country.17 The main reason for not including them in our main analysis is that they are not tax residents, as in our main series.
These sources can be used to estimate the size of foreign household wealth. In the B.o.P., real sector savings (in the current and capital accounts) and net financial flows (in the financial account) should equal each other, but from the late 1980s onwards the Swedish Riksbank (the authority responsible for reporting the B.o.P. statisics) noted a drastic increase in the residual between these two entries. This residual, called net errors and omissions, and consists of more than just household wealth transfers, e.g., statistical and valuation errors.18 We therefore subtract 35 percent of them in order to reach a plausible value of foreign household wealth. This particular figure has been reached through discussions with those who compile these data.19 Furthermore, in the F.A. there is a concept called unexplained financial savings which can also be used to approximate foreign household wealth.20 This is also a residual, defined as the difference between the financial savings in the National Accounts (i.e., the difference be-tween disposable income and the sum of consumption and investments) and financial savings, (i.e., the aggregate value of bank deposits, securities portfolios, cash etc.). We examine the F.A. series in the robustness section.
Beside the information on the total amounts of foreign wealth we need to make some assump-tions about who the residents owning the foreign wealth are. Throughout we attribute the for-eign wealth to the households in the domestic top wealth percentile. After discussions with people at Statistics Sweden and the Swedish Riksbank we think this is a reasonable guess and,
17 For example, the majority of Swedes appearing in the Forbes magazine lists over the richest people in the
world reside outside of Sweden. Examples of these individuals or households are Ingvar Kamprad (owner of IKEA, living in Switzerland) and the Rausing family (owners of Tetra Pak, living in England and Denmark).
18 Data on net errors and omissions for Sweden since 1975 come from the Swedish Riksbank.
19 Blomberg et al. (2003) are able to attribute about 14 percent of the net errors and omissions to known
valua-tion errors in the export statistics. Above from that, the authors believe that there are other errors of at least those amounts. We decide to remove 35 percent of the observed sums for our estimated household share.
20 Bergman and Rylander (1984), Persson (2002) and SOU 2002 (p. 298) all use the unexplained savings in the
if anything, this group consisting of about 40–50,000 households (varying over time) is too large (i.e., we underestimate the concentration in the top).21
2.2.4 Journalistic wealth estimates for the super rich
Tax authorities have great problems assessing the wealth of citizens who own large closely held companies. These wealthy households therefore often end up paying very low or no wealth taxes at all.22 In the absence of objective information on these fortunes, journalists in several countries have created alternative wealth estimates of the wealth of the super rich based on subjective valuations. Examples of such listings are the Forbes 400 in the U.S. and the Sunday Times Rich List for the U.K. Because of their subjectivity in the valuation of the fortunes one must treat these numbers with great caution.23 Nevertheless, when carefully treated these lists hold information not otherwise available and they have been used previ-ously by researchers interested in studying the wealth of the super rich (e.g., Kopczuk and Saez, 2004; Atkinson, 2006; Guriev and Rachinsky, 2006).
We use data on the wealth of super rich Swedes from the Swedish journalistic “rich lists” published by Affärsvärlden, Månadens Affärer and Veckans Affärer for single years between 1983 and 2005.24 From these lists we primarily study the wealth of residents, i.e., the rich Swedes living in Sweden (domestic super rich) while analyzing also the substantial fortunes of Swedes living abroad (foreign super rich) in the robustness section.
2.2.5 Retirement wealth data
Pension wealth and social security wealth are important sources of income for most people at their retirement. For this reason, researchers sometimes estimates of the retirement wealth of households to their net marketable wealth in order to create a wealth concept called
21 There are clearly a number of objections that can be raised to these assumptions. Our main purpose is,
how-ever, not to come up with an alternative measure of wealth concentration but rather to get a sense of the order of magnitude by which foreign wealth could affect the distribution.
22 In Sweden, some large family firm-owners (those who owned more than 25 percent of a company’s shares by
the end of 1991) were even exempt from wealth taxation in the Wealth Tax Act of 1997 (1997:233). This rule is generally considered to have been specifically designed for the Persson family (main owners of H&M).
23 For example, their methods comprise of a subjective and typically undisclosed selection of valuation
tech-niques and comparisons with similar companies for which financial information is more openly disclosed. Jour-nalists collect most of their information from publicly available sources such as newspapers, company reports and financial market prices, but at times also interviews with the rich themselves are used. See further the dis-cussions in Davies and Shorrocks (2000) and Atkinson (2006)
24 In fact, earlier calculations of the richest Swedish families were done by Hermansson (1959, 1962) and by the
public investigation SOU 1968:7. In all these cases, tax returns formed the basis of personal wealth which is reasonably comparable with today’s market-valued numbers as we argue elsewhere in this paper.
mented wealth.25 Conceptually, however, it is not unproblematic to count retirement wealth in as personal wealth. On one hand, it is a fairly well-defined future benefit stream accruing to each individual in society that highly influences the incentives of individuals to save for re-tirement. On the other hand, individuals cannot freely access their pension wealth (e.g., to realize it before retirement age), which violates one of the fundamental aspects of private property rights to personal assets. For this reason, the distribution of augmented wealth should be treated separately from the conventional wealth inequality measurement.
There are many conceptual and practical problems associated with measuring retirement wealth and its distribution. First, parts of it are defined in collective form and hence not well-defined for all individuals (or households) in the system. Second, the calculation of today’s claims on future pensions concerns a number of complex assumptions of people’s life expec-tancy, future rates of return on the capital markets and so forth. Third, there are public and private parts of the pension system, funded and un-funded parts, and some of these are more easily observed and measured than others, which may create systematic measurement errors in the data. Fourth, the distributional features of the different parts of the pension system dif-fer considerably and are also complicated to measure, e.g., in the case of mapping the pen-sions across the income distribution onto households in the contemporaneous wealth distribu-tion.
Our estimates of the distribution of augmented wealth come from different sources. In gen-eral, historical data on Swedish retirement wealth and its distribution are scarce. We use in this paper two estimates that have been made with specific application to the distribution of net personal wealth: Ståhlberg (1981) for 1978, and Jansson and Johansson (1988) for 1985 (largely building on Ståhlberg’s estimate). We have ourselves computed a rough estimate for 2004. The calculations are based on arriving at net present values of all individuals’ current and future claims on the different parts of the pension system. For details see the respective sources.26
25 This approach was first suggested by Feldstein (1976) and has then been applied by several others.
26 The concentration of Swedish augmented wealth in 2004 was calculated in the following four steps. First, we
take the estimated public pension wealth (pensionsskuld) of all Swedes in the old-age pension system as calcu-lated by the Swedish Social Insurance Agency (Swedish Social Insurance Agency, 2006, pp. 21-23, 74). This amount includes the sum of current and estimated future pensions in the basic and supplementary (ATP) pen-sions as well as the sum of the funded part (PPM), in total 6,244 billion SEK (2004 current prices). From this we subtract a latent tax debt of 30 percent since pensions are treated as taxable income, resulting in a net-of-tax
3 Wealth concentration 1873–2005
This section presents our main results. We begin by showing the long-run evolution of wealth concentration for groups in the top of the Swedish distribution over the entire period. Then we divide the 130 years into three subperiods based mainly on the observed patterns but also on instances of important structural changes. For the first period, the 1870s–1900s which roughly corresponds to the industrial take-off, we rely entirely on wealth tax data. In the subsequent period, the 1910s–1970s which covers the entire build-up and expansion of the Welfare State, we can compare results from estate data with wealth tax data, and, finally, in the period after 1980 when internationalization increased and capital flows were liberalized we also make use of our estimates of foreign household wealth as well as journalistic sources.
3.1 Long-run trends
Figure 1 shows the development of the wealth share for the top decile over the period 1873– 2005, based on estate data as well as wealth tax data. According to this measure wealth con-centration was high and relatively unchanged almost until 1945, with a small drop in the 1930s (in the wealth tax data). Given that 1930s marks the start of the long era of Social De-mocratic rule under which the welfare state was created (with much of the early implementa-tion interrupted by World War II) this seems to fit well with broad stylized facts.
[Figure 1 about here]
public pension wealth of 4,271 billion SEK. Second, we take the sum of all funds in the private pension-related complementary benefits system (ITP). This amounts to almost 887 billion SEK as reported by Sjögren Lindquist and Wadensjö (2007). Specifically, these include funds without individual options of 478 billion SEK in the AFA and Alecta funds (table 6.2, p. 170) and all funds with individual options summing to about 408 billion SEK (table 6.5, pp. 177ff). In total, the public and private Swedish pension wealth net-of-tax amounts to 4,991 billion SEK. Third, we calculate the shares that accrue to the top percentile for all of these different amounts. To do this, we use tabulated data on the Swedish labor income distribution in 2004 from Roine and Waldenström (2007). In the public system (basic, ATP and PPM) all income earners receive about a fifth (18.5% for all and an additional 4.5% for the top nine deciles) of their earned income up to 317,250 SEK (7.5 basic income amounts,
inkomstbasbelopp) as public pension. In the private system (ITP), income earners get 30 percent of their incomes
above 294,750 SEK in pension. Since 317,250 SEK in 2004 represented the income of the 75th percentile in the income distribution, this means that only the highest quartile received pensions in the ITP system. By combining all this distributional data for both public and private systems, we land at the following retirement wealth shares in 2004. In the case of public (public + private = total) pension wealth, the share was for P0-75 51.6% (31.7%), for P75-90 22.7% (15.2%), for P90-99 20.3% (17.4%) and for P99-100 5.4% (5.8%). In other words, the total retirement wealth was slightly more unequally distributed than the public retirement wealth only. Fourth, and finally, we compute the augmented wealth distribution by adding these amounts of retirement wealth for the fractiles in the income distribution to the net marketable wealth of the respective fractiles in the wealth distribu-tion, hence assuming that they are approximately the same.
However, as has been pointed out several times in recent work on top incomes and wealth, when only looking at the evolution of top decile, one typically fails to see a number of impor-tant aspects of the data. Figure 2 shows the development of the top percentile (P99–100), the next nine per cent (P90–99) and the residual remaining population (P0–90), revealing a num-ber of interesting facts. The development between the 1870s and the 1900s is now character-ized by a slight increase for the top percentile at the expense of the rest of the population. From the 1910s and onward, until around 1980, the wealth share of the top percentile drops by a factor three. However, until around 1950, this leveling happens within the top decile, giving the impression – seen in Figure 1 above – that no big changes occur. In the period 1910 to 1950 the wealth share of the P90–99 increases by a factor of 1.5 while the share of the top percentile is divided by about as much. The rise of “popular wealth”, mainly owner-occupied housing held by the lower nine deciles (P0–90), seems to start around 1930 with the major increases coming after the Second World War, and after 1950 the increase for the P0– 90 group happens at the expense of the entire top decile. Around 1980 the leveling seems to come to a halt, and the wealth shares for the top groups have increased slightly in the recent past.
[Figure 2 about here]
Our data also allows us to analyze the long-run patterns of wealth shares in the very top of the wealth distribution. Figure 3 displays the shares of groups within the top vintile: the lowest four percentiles (P95–99), the bottom nine tenths of the top percentile (P99–99.9), the top 0.1 percentile (P99.9–100) and the top 0.01 percentile (P99.99–100).27 It confirms the previous finding of the very rich losing ground throughout the twentieth century and gives more infor-mation about the order of magnitude by which this compression took place. The top 0.1 per-centile’s share plummeted from 28.1 percent in 1908 to only 5.1 in 1978. The fall of the top 0.01 percentile was even more drastic, from 13.6 percent to 1.7 percent. This pattern becomes even the more striking when contrasted against P95–99 which increased its share until 1950, then experienced a relative fall until around 1980, and has then recovered only to land at a wealth share in 2000 which is almost exactly the same as in 1908.
27 The estimates for the richest groups may be associated with some uncertainty in the earlier periods as they
consist of only some 300–500 households. Recall though that the shares for 1975 onwards draw on complete sampling of roughly the top 0.1 percentile.
[Figure 3 about here]
Overall the Swedish development suggests a gradual process, with wealth slowly spreading from the top down as development progresses, possibly with a period of slightly increasing concentration in the first phase of industrialization, much in line with Kuznets’ basic idea. Even though our data does not allow us to identify precisely what has been driving this proc-ess we can get a number of clues and also get a more precise picture by analyzing the data in some more detail. We do so by looking separately at three sub-periods: 1870s–1900s, 1910s– 1970s, and 1980s–today.
3.2 1870s–1900s: Wealth concentration during the industrial take-off
Sweden was a latecomer in the process of industrialization, with its industrial take-off being dated sometime in the second half of the nineteenth century.28 Since our first observation of wealth concentration is 1873 our series capture the evolution of wealth concentration over the whole era of industrialization in Sweden.29 This is particularly important since Kuznets’ in-fluential hypothesis about industrialization is explicit about inequality increasing during the initial stages of economic development.
Our data suggest that between the 1870s and the first decade of the 20th century, the top one percent increased their wealth share by approximately five percentage points from about 55 percent to around 60. The losses for the rest of the population was relatively evenly spread with the share for the P90–99 and P0-90 groups dropping by about three and two percentage points respectively. While these movements are small they indicate a development consistent with the idea that industrialization initially created wealth which was concentrated in the top
28 For example, according to the growth-rate based definition in Maddison’s (1982) ‘Phases of capitalist
devel-opment’ Sweden achieved growth rates averaging above one percent for the first time in the 1850s and 1860s.
29 There exists one isolated observation from a wealth survey in 1800 thanks to Soltow (1985). We have not been
of the distribution.30 However, it should also be noted that for this period we have to rely on estate data without being able to make any mortality multiplier adjustments.31
Even though we want to be cautious when it comes to drawing conclusions over this period, especially about the levels, we find it interesting to note two stark differences in the case of Sweden when compared to France, as recently studied in Piketty et al. (2006). The first is that the series for France show a much larger increase for the top percentile over industrialization. The French top one percent wealth share (looking at the concentration at death which is com-parable with our estimates) increased from between 50 and 55 percent over most of the nine-teenth century, to well above 70 percent just before World War I. In comparison the Swedish increase is small. A second interesting detail to note is that while the top decile in France con-stantly held more than 95 percent of the wealth (in the early 1900s as much as 99 percent), this group had around 90 percent in Sweden even at the peak of inequality. Consequently the rest of the population had a comparatively high share of the total wealth in Sweden according to our series. This observation is in line with the well-known fact that Sweden historically as a result of the wide-ranging enclosures of the late eighteenth and early nineteenth centuries had a relatively large class of peasant proprietors.32 On a highly speculative note one may also think of the possible implications for political developments at the time and in particular the rise of social democracy. It could be argued that a situation where a relatively large share of the population has some wealth of their own is more conducive to political change which es-sentially respects initial property rights, while a situation where almost all wealth is concen-trated in the very top of the distribution political conflict is more likely to be polarized and even more prone to revolutionary change (or status quo).
3.3 1910s–1970s: Wealth equalization and the rise of “popular wealth”
Starting in the 1910s and continuing up to the early 1980s, Swedish top wealth shares experi-enced a substantial overall decline. For example, the top percentile went from having owned about 60 percent of all personal wealth in 1908 to less than 20 percent in 1980. As shown in
30 While we study very different aspects of inequality, our findings are compatible with Söderberg (1991) who
finds an increasing inequality in salaries over the period 1850-1914. However, at this time it is not likely that the top percentile in the wealth distribution was affected much by increased salaries. Rather, a more likely interpre-tation is that the reason for why the top percentile in the wealth distribution did not go up more, was that some of the gains from industrialization actually went to skilled workers.
31 Only in 1908 do we have both the non-adjusted and the adjusted shares. 32 See, for example Cameron and Neal (2003, p. 272).
Figure 3, however, between 1908 and 1950 it was only the top 0.1 percent that experienced a steady decrease whereas the wealth share of the next 0.9 percent (P99–99.9) remained con-stant until 1930 and the 4 next percentiles (P95–99) even increased their wealth shares.
These patterns suggest two things. First, the Swedish economic and financial shocks in the early 1920s (a banking and deflation crisis) and the early 1930s (the Kreuger-crash of 1932) had a negative effect on the top fortunes. This is unsurprising, however, this effect seems to have been more limited than the effects of the world wars and the Great Depression in other countries where a larger share of the wealth was affected (see Ohlsson et al., 2006).
Second, a more important driver behind the changed distribution of wealth seems to have been the new wealth creation occurring among the relatively income rich who previously held less wealth. This can be seen by studying a unique feature in Swedish tax data between the years 1911 and 1948 when Sweden practiced a form of progressive income and wealth tax which operated through adding a fraction of taxable wealth (in principal equal to net wealth) to individual income to calculate what was called the “taxable amount”.33 This information on the size of wealth holdings by income class is tabulated for a number of years and gives im-portant information on changes in wealth concentration. Table 1 shows how the wealth share of top percentile in the income distribution decreased before 1950, in particular in the inter-war period. By contrast, the “high-wage” income earners in the P90–95 income fractile in-creased their wealth share substantially over the same period, mainly in the 1910s and 1930s. The natural interpretation of these changes is that wealth as a source of income for the very rich declined in this period while, at the same time, moderately rich groups with high incomes accumulated new wealth. Historically, these patterns are in line with the descriptions in Glete (1994, ch. 2 and 3) about the emergence of new corporate owners during the expansive 1910s and the successes of corporate executives in the 1930s.
[Table 1 about here]
After 1950 the trend of increased accumulation continues down the distribution. A continued equalization of incomes certainly contributed to this development. Already in 1950 Sweden had established its position as one of the most equal countries in the world in terms of
comes and this trend continued until around 1980.34 Other sources of continued wealth equali-zation can be found in the composition of total wealth. Between 1950 and 1980 the share of owner occupied housing in total wealth increases from being 17 percent of all wealth to 45 percent in 1975.35 This was partly due to increasing values of existing housing (which in turn was partly based on increased infrastructure investment) but mainly due to new developments of owner occupied housing for which the government provided generously subsidized loans.36 At the same time the fraction of rental property as well as that of shares (listed and unlisted), both highly concentrated in the very top of the distribution, decreased from 17 to 4, and from 14 to 7 percent respectively. The combined effect of these changes was an increase in the share held by the nine “poorest” deciles (P0-90) from just above 20 percent in 1950 to around 45 percent in 1980, with a corresponding fall in the share held by the richest decile (P90– 100).
3.4 1980s–present: Globalization and higher concentration
Around 1980 the long period of wealth compression came to a halt. A number of previous studies have analyzed Swedish wealth inequality in this period, finding the lowest inequality in the early 1980s and a moderate increase thereafter.37 Much of the fluctuations in wealth shares in the period after 1980 have been found to depend on asset price movements, with increases in real estate values reducing inequality since many Swedes own their houses, while increases in share prices make the top shares larger as share ownership is concentrated. Still, the official estimates of top wealth shares do not seem to capture the dramatic increases in stock returns at the Stockholm Stock Exchange between 1980 and 2000, with an average an-nual real rate of return of above 20 percent.38
34 See Roine and Waldenström (forthcoming).
35 This share has remained relatively constant since when adding owner occupied apartments, houses, and
vaca-tions homes (consumer durables also increased a lot but stay a relatively small share of the total), see Spånt (1979, pp 78-80) and Jansson and Johansson (2000, pp 19-21).
36 See Englund (1993).
37 According to the official estimates at Statistics Sweden (Jansson and Johansson, 2000, and Ohlsson et al.,
forthcoming), the wealth share of the top percentile increased about ten percent over the 25-year period between 1978 (16.6 percent) and 2002 (18.4 percent). For other recent studies of the Swedish wealth inequality, see Spånt (1987); Jansson and Johansson (1988); Kashefi (1989); Bager-Sjögren and Klevmarken (1998) and Klevmarken (2004, 2006).
38 The remarkable value growth at the Stockholm Stock Exchange is not dependent on choice of starting or
end-ing year. In fact, the real stock returns index (see Waldenström, forthcomend-ing) at year-end were 75.4 in 1980, 689.0 in 1990, 4826.3 in 2000 and 5817.5 in 2005, which results in average increases of between 20 and 25 percent per year.
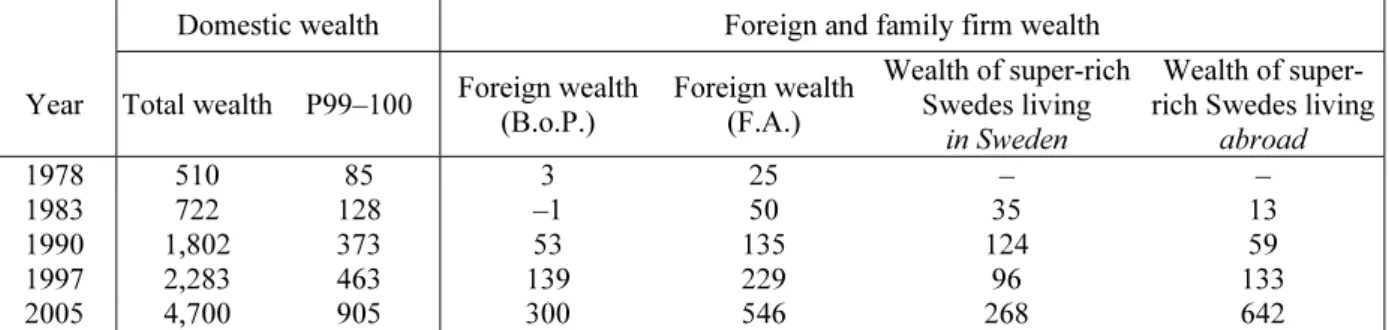
We believe that there are two main reasons for why some of the potentially most important changes in the Swedish wealth distribution are not captured in the tax statistics (or in sur-veys). First, over the past decades there has been a substantial increase in wealth holdings outside of Sweden and second, there are large privately held family firms (not captured by the tax statistics) which have grown in value over this same period. We examine the potential impact of these non-disclosed fortunes on the official wealth inequality estimates of Statistics Sweden by adding estimated sums of foreign household wealth (from the net errors and omis-sions in the Balance of Payments) and of domestic wealth of super rich residents (from the journalistic listings) to the observed domestic wealth of the top wealth percentile in the offi-cial statistics. Table 2 shows these sums for some years between 1978 and 2005 as well as the corresponding official wealth amounts of the whole Swedish household population and its top percentile. The net errors and omissions were basically zero before 1989 after which it started to increase and landing at an accumulated outflow in 2005 of 456 billion SEK, or 66 billion USD in constant 2006 prices.39 The unexplained financial savings in the F.A. also shows on increasing outflows over the period, but increases already in the early 1980s which might re-flect increased domestic unobserved wealth.40
[Table 2 here]
Figure 4 shows the distributional effect of adding foreign and super-rich wealth to the wealth of the domestic top wealth percentile. This adjustment causes a notable trend break in the share of the top percentile around 1980, with the share increasing from about 20 percent to almost 30 percent by 2005. Much of this increase occurs in connection with Sweden’s finan-cial liberalization in 1989 and continues thereafter, in line with the amounts presented in Ta-ble 2. Note that these data do not contain any assumed accumulated interests on the foreign capital, why they should be interpreted as cautious estimates. Note also the increasing wedge between the new series and the basically flat trend in the official wealth tax-based series.
39 The fact that the net errors and omissions are zero in 1978 does not imply that there was no Swedish private
capital placed abroad for tax reasons. It only means that there were practically no “omitted” capital outflows in the balance of payments statistics during this period, since the Swedish Riksbank had indeed approved of some very large capital transfers by private individuals (see further Lindkvist, 1990).
40 Another potential explanation is, of course, statistical errors in the calculations. See Rylander and Bergman
The sizeable impact of foreign wealth on the domestic wealth concentration is probably a phenomenon that is, if not unique, unusually important for Sweden (and possibly for the other Nordic countries). The combination of high taxation of wealth, large increases in especially financial wealth beginning in the early 1980s and the lowered cost of avoiding wealth taxes by moving wealth abroad would suffice to explain the observed patterns. When doing the same additions for the U.S., i.e., adding foreign wealth (in the net errors and omissions in the Balance of Payments) and the often closely held wealth of the super-rich (in the Forbes list-ings), there is no similar effect on the domestic wealth concentration.41
[Figure 4 about here]
4 Robustness of our estimates and alternative measures of concentration 4.1 Taxation values or market values, taxable wealth or “all” wealth
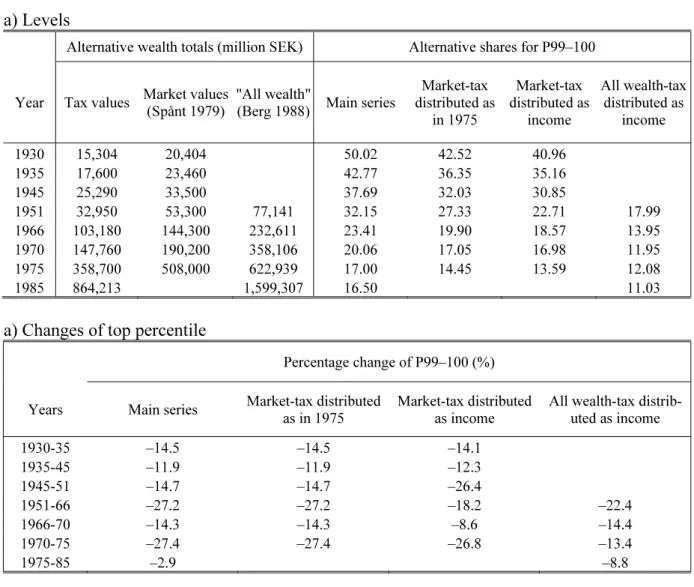
As discussed above there are a number of potential problems in the translation from data to wealth shares. When using tax data, the main types of concern stem from differences between tax values and actual (market) values and differences in what items are included in the wealth taxation. Both of these aspects can (but do not necessarily) affect the wealth shares. While our main series after 1975 are wealth shares calculated based on market values (arguably what should be used), such data does not exist for the period before. There are, however, estimates of the market value of the total (taxed) wealth starting in 1935 as well as the effects of market valuation on the wealth shares in 1975.42 There are also estimates of market values of “all” household wealth (including items which are not part of taxable wealth) for the period 1950– 1987.43 Using these alternative reference totals and various assumptions about the distribution of the difference between our main reference total and these alternatives we can get a sense of how our main series could change.
41 Adding these wealth items increases the 2004 share of the U.S. top wealth percentile increases its share from
33.4 to 34.6, an increase of about 3 percent which is to be compared to the more 50 percent increase in the Swed-ish case. The calculation is based on top wealth share in the Survey of Consumer Finances (Kennickell, 2006). Then we add 80 percent (assumed share of capital owned by households) of the accumulated net errors and omissions (“Statistical Discrepancy”) in the U.S. international transactions accounts data (Bureau of Economic Analysis, 2007), with no rate of return on foreign wealth. Second we add the domestic wealth of the top 400 individuals in the Forbes 400, and an additional 1.2 percent of their wealth which is the assumed amount held by rich Americans abroad (based on comparisons between the Forbes 400 and the Americans living aborad in the Forbes listings of the world’s richest people).
42 Spånt (1979) where historical figures from 1945 onwards are based on actual data while the values for 1935
are calculated using the relations in 1945.
Table 3 shows the difference in reference totals and what we consider to be the lower bound for the top percentile share, P99–100 (the qualitative differences are the same for all top shares). The shares are based on the assumption that the amounts which are not included in the tax data (or the difference between tax and market values) are distributed according to the income distribution (we think that the true distribution is likely to be more uneven but this gives a lower bound to the estimates). We also include shares based on the assumption that the difference between tax values and market values are the same as in 1975. The resulting shares are lower than our main series, especially when looking at the alternative based on “all wealth” including what is not taxed.44 This is hardly surprising given that the totals according to Berg (1988) are about twice our reference total and we assume that the difference is dis-tributed according to income. However, as can be seen by the percentage changes between years, the trend is very similar over time.
[Table 3 about here]
4.2 Comparing our series with findings in other studies of wealth concentration
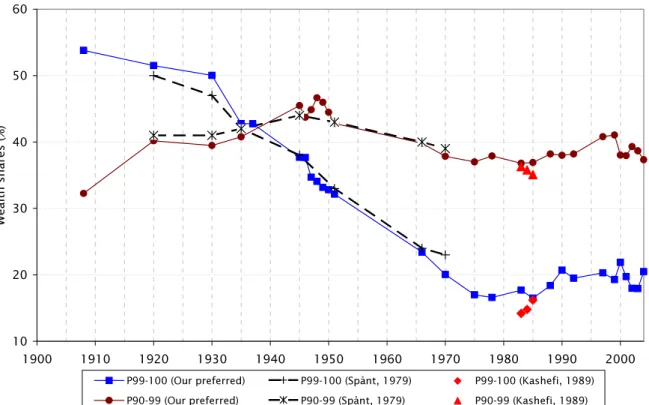
An important check of our findings is to contrast them with previous estimates of the Swedish wealth concentration based on slightly different methodologies or sources. Earlier attempts to estimate the distribution of household wealth have used either the same wealth tax sources as we do or completely different sources based on household surveys. Figure 6 shows three al-ternative wealth tax-based estimates of the top wealth percentile (P99–100) and the next nine wealth percentiles in the top decile (P90–99): our main series, those of Spånt (1979) for 1920–1975 and those of Kashefi (1989) of 1983–1985. The main trends and levels are basi-cally the same in all three cases, which maybe is not so surprising given the fact that they all derive from the same wealth data source. Yet it is worth noting that the differences in interpo-lation techniques, reference wealth and popuinterpo-lation totals do not seem to have an important impact on the estimates.
[Figure 5 about here]
44 The substantially lower shares when including “all wealth” (including consumer durables) are in line with
4.3 Shares within shares
Our top wealth shares may contain measurement error through the estimated reference total wealth held by the full population. An alternative way of studying wealth concentration with-out having to rely on the reference wealth total of the whole population is to express the con-centration in terms of the wealth share of certain top groups within the wealth share of an-other, larger, top group. For example, by dividing the top wealth percentile by the top wealth decile, P99–100/P90–100, we get a “shares within shares” ratio that eliminates the reference total.45
[Figure 6 about here]
Figure 5 depicts the evolution of wealth concentration using shares within shares estimates and hence without any potentially bias from reference wealth totals. Overall, the patterns con-firm some of our previous conclusions. The very top of the distribution experience a falling share relative to the group just below, especially in the first half of the century. However, the magnitudes are similar to those observed in our main series, that is when the top is related to the wealth of the whole population, implying that the group below the very top behaves simi-larly to the rest of the population. After around 1950 there is much less change in the concen-tration within the top group, while top wealth shares in our main series fall. This implies that in this period most of the change is driven not by the changes of the very top in relation to those just below, but by the change of the entire top decile in relation to the rest of the popula-tion.
4.4 Altering the definitions of foreign wealth and super rich wealth
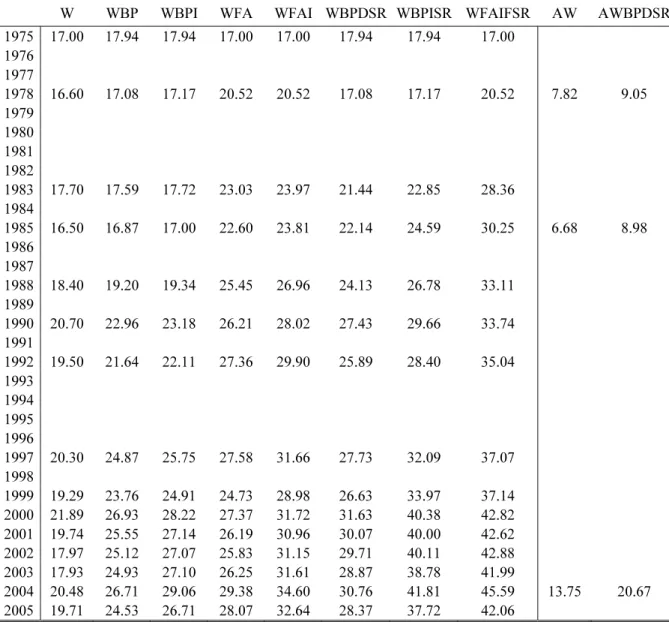
Our main analysis showed that foreign household wealth and large domestic family-firm for-tunes have a first-order effect on the Swedish wealth concentration after 1980. As was stated, however, the added series were only a subset of all available estimates and also based on re-strictive assumptions regarding the return to foreign capital. In the present section we there-fore present a number of alternative series using combinations of all available wealth sources (both B.o.P. and F.A. foreign household wealth series as well as journalistic estimates of
45 Too see that this removes the influence of reference totals, note that P99-100 = W
Top1/WAll (with W = Wealth)
eign and domestic wealth of super rich Swedes) and different assumptions about the yield of foreign capital (zero and five percent nominal rate of return).
Figure 7 depicts the evolution of the top wealth percentile since World War II when different alternative measures of foreign household and domestic family firm wealth are added to the market valued wealth tax data.46 The results confirm the sizeable impact on Swedish wealth inequality since 1980, but the degree of impact across the series is quite varying. For example, while the top percentile’s share in the unadjusted domestic wealth series is 18.4 percent in 2002, it is 23.9 after adding the (mainly) family-firm wealth of super rich residing in Sweden. Overall, these alternative measures suggest that the impact of foreign wealth and closely held firms is significant and also that the choice of how to view citizens of a country residing abroad can have a very large impact on measures of top wealth concentration.47.
[Figure 7 about here]
4.5 The role of pension and social security wealth
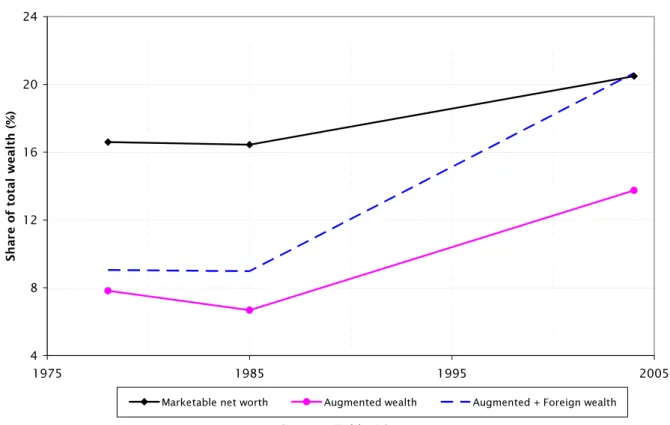
So far we have considered the distribution of net marketable wealth, i.e., market-valued real and financial assets less debts. However, as discussed in Section 2 researchers have some-times added the net present value of all current and future claims on the pension and social security systems to the net worth, creating a distribution of augmented wealth. The effect of adding the retirement wealth to marketable wealth has typically resulted in a most consider-able equalization of wealth (see, e.g., Feldstein, 1976; Feinstein, 1996; Wolff, 2005). For ex-ample, the top percentile in the U.K. in 1991 owned 17 percent of marketable wealth but only 10 percent of augmented wealth.
Figure 8 depicts the top one percent wealth share in Sweden between 1978 and 2005 using three different concepts of wealth: net marketable wealth, augmented wealth and, to be able to
46 The domestic benchmark wealth, based on market-valued wealth tax data, is denoted “W”. Our alternative
series then come from adding combinations of different foreign and domestic wealth types to W of the top per-centile (P99–100) and, of course, to the reference total. We use the following acronyms: BP (B.o.P.-based esti-mates of foreign household wealth), FA (F.A.-based estiesti-mates of foreign household wealth), BPI and FAI (the two previous but when a 5 percent rate of return is added), DSR (domestic super rich wealth, mainly closely held family firms), FSR (foreign super rich wealth) and SR (sum of DSR and FSR). There are discontinuous jumps in some of the series, in 1978 for those containing F.A.-based foreign wealth (for which we have data from 1978) and in 1983 for those containing domestic super rich wealth for the same reason.
compare the distributional impacts of retirement wealth and foreign wealth, the sum of aug-mented and foreign wealth. Two findings stand out. First, adding retirement wealth generates a much lower level of concentration, which was expected. Second, the increasing trend in wealth concentration found when adding foreign wealth to the top percentile is not affected by also considering retirement wealth. The trend in augmented wealth concentration follows the largely flat trend in marketable wealth concentration, whereas adding foreign wealth to aug-mented wealth (the dotted line in the figure) shows that the increasing trend remains unaf-fected.48
[Figure 8 about here]
5 International comparison
How does the Swedish wealth concentration over the path of development match similar evi-dence for other countries? In particular, was the distributional impact of industrialization as marginal elsewhere as it seems to have been in Sweden? And was the dramatic wealth com-pression over the twentieth century a specific Swedish phenomenon based on the develop-ment of the extensive Welfare State? In this section we make an attempt to address these questions by mapping the Swedish long-run experience on that of three other major Western countries: France, the United Kingdom and the United States.
Figure 9 depicts the top wealth percentile in these four countries between 1740 and today. The extraordinarily long time period is motivated by the fact that the English industrialization be-gan somewhere around the middle of the eighteenth century while it started some 50-100 years later in the U.S. and France and about 150 years later in Sweden. Great caution should be taken when comparing these series as they are not based on the same wealth data sources and in all cases but France the outcome of splices between different compilations. Still we are not the first to combine these pieces of evidence and therefore believe that some conclusions can be drawn about the long-run developments we study here.
48 In fact, the trend increase between 1985 and 2004 is larger when using augmented wealth than when using
marketable wealth. A similar result that the equalizing role of retirement wealth has diminished over the past decades has been found for the U.S. in Wolff (2006). However, due to the great uncertainty in the Swedish esti-mates we refrain from making such a conclusion and content ourselves with the observation that the trend is basically flat in both the marketable wealth and augmented wealth cases.
[Figure 9 about here]
Two broad results can be drawn from the series. First, we do not think that the evidence un-ambiguously supports the idea that wealth inequality increases in the early stages of industri-alization. Looking at the development of the wealth share of the top percentile among the countries analyzed here, the Swedish series exhibit a fairly stable inequality level over the initial stages of industrialization (in the late nineteenth century). The U.K. series (England and Wales) show increasing wealth shares for the top percentile in the period of the two industrial revolutions (1740–1911), as do the U.S. and French series over the nineteenth century. Over-all this suggests that going from a rural to an industrial society, with entirely new stocks and types of wealth being created, may, but does not necessarily, give rise to a large increase in wealth concentration.
Second, while the series do not indicate a clear common pattern over the nineteenth century when industrialization took place the development over the twentieth century seems more uniform. The top percentile wealth share decreased sharply in all countries studied and the order of magnitude seems to be a decrease by about a factor two on average (from around 40-50 per cent in the beginning of the century to around 20–25 per cent today). It also seems that the lowest point in most countries was around 1980 and that the top percentile wealth share has increased in most countries after that. The exception is the U.S. household series which first increases up to 1929, then falls sharply up to 1950 and then goes up and down up to the 1980s when it stabilizes on an internationally high level.
6 Concluding remarks
This paper has presented new evidence on trends in wealth concentration in Sweden over the period 1873–2005. Spanning such a long period of time our series allow us to address ques-tions regarding the dynamics of wealth distribution over the path of Sweden’s development from an agrarian to a modern economy. It also allows us to put the achievements and the role of the Welfare state, as well as the recent increases in wealth concentration, in historical per-spective.
The picture that emerges is one of a development with many similarities to what has been found in previous studies for other countries, but also one with some important differences.
Overall, our findings suggests that over the path of transition from being a poor agrarian economy to a rich industrialized one, wealth gradually spread to wider and wider groups. In terms of how Sweden differs from other countries, and in particular when it comes to the role of the welfare state in explaining this process, two aspects stand out. On the one hand, welfare state policies undoubtedly played an important role in the latter stages of this development. In this sense the expansion of the welfare state caused the equal distribution of wealth that we observe around 1980. On the other hand, the gradual Swedish wealth levelling started much before that. Already around 1910 do we see evidence of the groups just below the very top increasing their wealth share and over time the increases move down the distribution. These changes can not be attributed mainly to exogenous shocks to top wealth holders – making the Swedish case different from France, the U.K. and the U.S. – but rather to increased accumula-tion of wealth among the relatively income rich, but at the same time it is also hard to point to policies that would explain this pattern. In this sense the process of gradual wealth levelling started before the expansion of the welfare state, and it did so by a process which was driven by neither exogenous shocks, nor by policy.
After 1980 wealth concentration has increased, but only slightly according to standard official estimates. The commonly held view is that wealth concentration is still at a historically low level. At the same time there has been an ongoing debate about much of wealth leaving the country (mainly for tax reasons) and also of much wealth being concealed through closely held family firms not captured in tax statistics. Adding what we believe to be cautious esti-mates of the accumulated wealth that has left the country over the past 25 years as well as estimating the impact of the wealth in large family firms we have shown that Swedish wealth concentration has probably increased by more than what is revealed in the official estimates. We also think that these effects are more important in Sweden than in many other countries. Beside attempting to estimate the magnitudes of these well-known, but typically neglected aspects, these figures also raise some increasingly important questions about how to treat for-eign wealth (and income) when thinking about distributive questions. Should we consider the distribution of all wealth in a country or of those who live in a country (including their wealth abroad) or should we consider the wealth of all citizens of a country regardless of where they live or have placed their wealth? Regardless of what position one takes on issues such as these, our estimates of recent changes in Sweden suggest that the answer matters a lot for the picture one gets of the wealth distribution.
References
Atkinson, Anthony B., and Alan Harrison (1978), The Distribution of Personal Wealth in Britain, Cambridge University Press: Cambridge.
Atkinson, Anthony B., J. P. F. Gordon, and Alan Harrison (1989), “Trends in the Shares of Top Wealthholders in Britain: 1923-1989”, Oxford Bulletin of Economics and Statistics 51(3): 315-32.
Bager-Sjögren, Lars and N. Anders Klevmarken (1998), “Inequality and Mobility of Wealth in Sweden 1983/84–1992/93”, Review of Income and Wealth 44(4): 473–495.
Blomberg, G., L. Forss and I. Karlsson (2003), “Restposten i betalningsbalansen - ett pro-blem?”, Penning- och valutapolitik No. 2, 40–49.
Cameron, R. and L. Neal (2003), A Concise Economic History of the World. From Paleolithic Times to the Present. Fourth Edition, Oxford University Press: Oxford.
Englund, P. (1993), “Bostadsfinansieringen och penningpolitiken” in Werin, L. (ed.), Från räntereglering till inflationsnorm, SNS, Stockholm.
Feldstein, M. (1976), “Social Security and the Distribution of Wealth”. Journal of the Ameri-can Statistical Association, 71, 800-7.
Feinstein, C. (1996), “The Equalizing of Wealth in Britain since the Second World War”, Oxford Review of Economic Policy 12(1), 96–105.
Glete, J. (1994), Nätverk i näringslivet. Ägande och industriell omvandling i det mogna indu-strisamhället 1920–1990, SNS, Stockholm.
Guriev, S. and A. Rachinsky (2006) “The evolution of Personal Wealth in the Former Soviet Union and Central and Eastern Europe”,UNU-WIDER Research Paper No. 2006/120. Hermansson, C.H., (1959), Koncentration och Storföretag. Arbetarkulturs förlag, Stockholm Hermansson, C.H., (1962), Monopol och Storfinans. Arbetarkulturs förlag, Stockholm
Jansson, K. and S. Johansson (1988), Förmögenhetsfördelningen 1975 - 1987, Statistics Swe-den, Stockholm.
Jansson, K. and L. Johansson (2000), Förmögenhetsfördelningen i Sverige 1997 med tillba-kablick till 1975, SCB Rapport 2000, Statistics Sweden: Stockholm.
Kaldor, N. (1956), “Alternative Theories of Distribution”, Review of Economic Studies, 23(2): 83-100.
Kashefi, B. (1988) “Hushållens förmögenhet och sparande 1983-1985” in Agell, J., B. Kashe-fi and P.-A. Edin, Hushållens portföljval och förmögenhetsfördelning, SOU 1989:11, del 3, Allmänna förlaget, Stockholm.
Kennickell, Arthur (2006), “Currents and Undercurrents: Changes in the Distribution of Wealth, 1989–2004”, FRB Working paper 2006-13.