present
August 2017
Cropping systems in Iowa past and present
Edgar B. Hurd
Iowa State College
Follow this and additional works at:
http://lib.dr.iastate.edu/bulletin
Part of the
Agricultural Economics Commons
This Article is brought to you for free and open access by the Extension and Experiment Station Publications at Iowa State University Digital Repository. It has been accepted for inclusion in Bulletin by an authorized editor of Iowa State University Digital Repository. For more information, please contactdigirep@iastate.edu.
Recommended Citation
Hurd, Edgar B. (2017) "Cropping systems in Iowa past and present,"Bulletin: Vol. 23 : No. 268 , Article 1. Available at:http://lib.dr.iastate.edu/bulletin/vol23/iss268/1
AGRICULTURAL EXPERIMENT STATION IOWA STATE COLLEGE OF AGRICULTURE
AND MECHANIC ARTS
C. F. Curtiss, Director
AGRICULTURAL ECONOMICS SECTION
April, 1930 Bulletin No. 268
Cropping Systems in Iowa
Past and Present
By Edgar B . Hurd
CONTENTS
Page
Introduction ... ... ... ...135
An answer to a letter...:...135
The divisions of the cropping system... 135
The geography of the cropping system... 138
Oats are the Iowa small grain... ... ... 138
Barley is a weak competitor of oats...138
Rye occupies a very small comer of Iowa.... ... .139
Flax is raised on few farms in Iowa... ...140
Iowa is not a wheat state... ... .140
The small grains as a unit... ... ...143
Grain land variable...;... ...149
Summary of the cropping system by sections of the state 152 History of cropping systems since 1900__________ ______ 154 History of grain ... ... ...154
Historical comparison of corn and small grain...156
History of the small grains...,... 157
Historical summary of the cropping system... ... 158
;e 5 5 5 8 8 8 9 0 0 3 9 2 4 4 6 7 8 9
Cropping Systems in Iowa, Past and Present
1
By Edgab B. Hubd2
AN A N S W E R T O A L E T T E R
A prospective Iowa farmer wrote to the Agricultural Ex periment Station for advice on what crops to grow on a 120- acre farm near Fort Dodge. It is unwise to plan a definite farm program without a thoro understanding of the farm con ditions and the ability and resources of the farmer. However, in our reply to this farmer and to others with similar difficul ties, we have tried to give suggestions which would help in solving their problems. This bulletin is our answer, not only to this farmer, but to all others who care to think with us in planning their cropping systems.
T H E D IV IS IO N S OF T H E CR OPPING SYSTEM
In attacking the problem of what crops to grow and in what proportions, it is desirable to group the crops into classes.. The farm land may then be allocated to each class and re-allo cated to individual crops. Altho a perfect classification for this purpose is impossible, it is believed that the following will be helpful.
The classification:
A. Grass and legume forage. 1. Pasture.
2. Hay of all kinds. a. Roughage. b. Seed. B. Grain. 1. Corn. 2. Small grain. a. Oats. b. Barley. c. Spring wheat. d. Flax. e. Winter wheat.
1This is the third bulletin in a type of farming series prepared by the Agrcultural Economics Section of the Iowa Agricultural Experiment Station. The first, Types of Farming in Iowa,” Bui. No. 256, analyzes the geographical distribution^ of the important farm enterprises found in Iowa and shows why the farmers in each section of the state have combined their farm enterprises in just the proportions that they have. The second, “The Corn Enterprise in Iowa,” Bui. No. 259, is devoted entirely to the corn enterprise. This bulletin presents the cropping systems that exist in different parts of th<i state together with the historical development of these systems. Other bulletins contemplated for this series will treat of Iowa livestock feeding systems, hogs, the dairy industry and beef cattle.
2Acknowledgment is made to Prof. H. D. Hughes of the Farm Crops Section and to Dr. A. G. Black of the Agricultural Economics Section, both of the Iowa Agricultural Experiment Station for many valuable and constructive criticisms and suggestions. Credit is also due Dr. C. L. Holmes of the U. S. D. A. for having outlined the series of bulletins of which this one is a part and for many valuable suggestions during the progress of the work.
The basis of this classification is the relation between the different crops and the character of the crop land awarded to each. Different small grains tend to occupy the same place in the rotation and to demand labor at the same period of the year. This competitive relationship between the small grains tends toward an inverse relationship between them. For example, in a cropping system with a high percentage of farm land in oats, usually a low1 percentage is in barley and winter wheat.
Opposed to the competitive relationship existing between the small grains, We find a supplementary relationship exist ing between corn and the small grains considered as a unit. Corn and small grain do not conflict in the nmin for use of labor or machinery, and they occupy distinctly different places in the crop rotation. As a rule farmers who have a high percentage of. farm land in use for corn also have a high per centage in use for small grain.
Hay and pasture tend to be complementary crops. Hay requires man and horse labor in curing and buildings for storage, \yhile pasture is utilized directly by livestock, altho it must be fenced. Hay replaces pasture in the winter as a roughage for livestock unless the pasture is, used entirely for hogs. Since the amount of pasture needed for hogs on most Iowa farms is small, there can not be a great expansion in pasture without an accompanying expansion of hay. There are some variations in the proportions between hay and pasture owing to variations existing in the carrying capacity of pasture and the yield and quality of hay, but in general there is a positive relationship between the acreage of hay land and pasture land in Iowa.8
The above classification of crops harmonizes well with the type of land used. Ordinarily we think of two types of land with reference to the cropping system, the tillable and the non-tillable. This division is not exact because the same land is subject to a different classification by different indi viduals, /Or by the same person at different times. Land which is classified as tillable in the rougher parts of the state would be classified as non-tillable in the smoother portions. Further, the same type of land may be: classed either as tillable or non- tillable depending upon the ever-changing relative value of grain and grass. However, the percentage of land on the border between tillable and non-tillable is a small part of the total. Non-tillable land, if it is used for farming purposes, must be used either for permanent pasture or for wild hay. Permanent pasture, in a sense; is not a part of the cropping
Coefficient of correlation = +.68. Regression equation: % farm land in hay — .2% farm land in pasture +3.4% of the farm land.
system, but in this bulletin this technicality will be disre garded. Ordinarily in Iowa it is more economical to use the non-tillable land and the land which can be tilled only oc casionally without excessive erosion to furnish. the bulk of the pasture rather than to use tillable land for this purpose. In case a farm is all tillable a small part of the tillable land will be used for pasture owing to the fact that some pasture is usually necessary for the most profitable farm organization. Exception must be made for woodlots which may not be pas tured. The amount of grain sold depends upon the amount produced in excess of that required to balance the hay and pasture consumed in livestock feeding.
Grass and grain differ in respect to the type of feed pro duced as well as the type of land they occupy. Pasture can not be sold off the farm. Hay, in order to be profitable usually must be fed near where it is produced because when fed to livestock the product can be transported more cheaply than the hay itself. Sometimes hay may be sold advantageously locally, but this opportunity is limited to a few individuals. Grains, on the other hand, are more concentrated and are relatively more valuable per unit of bulk or weight than hay and for that reason may be sold -to advantage where little roughage is produced.
Some exceptions to these generalizations need to be made on account of the high yielding hay and pasture crops, such as alfalfa, soybeans and sweet clover, which are rapidly being introduced at present. They might easily replace some 'of the lower yielding forages in the rougher parts of the state, but they can not replace grains in such sections because grains at present occupy a comparatively small percentage of th© total farm land and .consequently are valued highly per ilrtit. These high yielding forages can compete successfully for a part of the grain acreage in the more level sections but only up to the point where there will be no grain available fot sale. However, this process will not revolutionize the cropping system even on the best land owing to the fact, that one .acre of these h ig h ,yielding forage» will do th e1 duty of a t least two acres Sown to less productive forage and- thus necessitate a large supplement of grain. * * • -.
-Thus far we have, said nothing of grass .seeds. In some parts of Iowa clover ándi timothy seeds are $mporfarft crops. However, they tend to be raised on the poorer land and for the most part are joint products with hay and pasture. For example, a given field may be. .used for pasture, hay, and clover and timothy seed in a single year,' Where a crop is raised solely for seed, we would class it as a grain.
The Geography of the Cropping System.
OATS A R E T H E IO W A S M A L L G RAIN
Figure 1 shows the percentage of small grain acreage in oats for 1925 by townships. Ninety percent or more of the small grain grown in two-thirds of the area of the state is oats. It is largely along the rivers that the oats acreage amounts to less than 90 percent of the small grain acreage. A few islands in the sea of oats are located in the northern part of the state as shown in fig. 1. In general oats do not constitute as high a percentage of the small grains in the southern part of the state as in the northern, except on the divides between streams and where a high percentage of the crop land is rolling or rough. In many townships in the southern part of the state, the oat acreage amounts to less than one-half of the small grain acreage.
B A R L E Y IS A W E A K C O M P E T IT O R OF OATS
Figure 2 shows the percentage of small grain in barley for 1925 by townships. Barley can be substituted for oats without changing the crop rotation or affecting the field expenses. Normally it has had a slightly higher per acre value than oats, grain alone considered, and is superior as a fattening feed. Up to the present barley has been disagreeable to har vest, but with the smooth awn varieties available this dis advantage will disappear. Some farmers recognized the
super-Fig. 1. Percentage of small grain acreage in oats by townships, 1925. Basic data secured from Iowa State Department of Agriculture.
ior monetary value of barley and made considerable substi tution between 1925 and 1928. During these years the barley acreage increased 453 percent, but it is still a small factor in the cropping systems of the state. Barley acreage amount ed to only 13 percent of the oat acreage in 1928. In 1928 barley was not as profitable a crop under most Iowa^ condi tions as oats because of increased acreage and scab infesta tion. The economical substitution of more barley for oats at this time is problematical. While it is true that barley may be considered equally as good as oats as a supplement to corn from a production standpoint, yet barley does not supple ment corn at all from a feeding standpoint. Barley is, in fact, a substitute for corn. On the other hand, oats tend to furnish protein and minerals that are lacking in corn, and thus when oats and corn are fed together a more balanced ration is secured than when corn is fed alone. Oats are especially good in a dairy ration4. Recent experiments I in feeding comparatively small amounts of oats to growing pigs also have proved ecoliomical5. These facts help to Explain why farmers raise oats instead of barley.
RY E O CCUPIES A V E R Y S M A L L CO R N ER OF IO W A
The world over, rye h&s its greatest comparative advant age over other grain crops on sandy land. Since there is not
4. E arlW eaver and Burt Oderkirk, “Feeding Dairy Cattle.” Iowa Agr. Exp. Sta. Circ. 107 (Revised), p. 25. 1927. , .
5. J. M. Ew ard and others, “Corn Belt Rations for Fattening Spring Pigs on Pasture and in Dry Lot.” Iowa Agr. Exp. Sta. Leaflet 19.
very much sand in Iowa we do not find very much rye. Some sandy areas may be found along the Mississippi, the Cedar and the Iowa rivers, and in these limited areas rye is im portant. In one sandy township the rye acreage amounts to almoist one-half of the small grain acreage.
F L A X IS RA IS ED ON F E W F ARM S IN IO W A
Flax has been considered a pioneer. It is the custom of settlers on virgin soil to sow flax on breaking. But the frontier has passed, the virgin soil is no more and old land must now be used to satisfy the demand for linseed oil. The price of flax has been and will continue to be very attractive as long as the government continues its high tariff policy. In southwestern Minnesota arid on a few farms in northern Iowa, considerable flax is produced. Since flax is primarily a cash crop, areas which need all of their small grain for feed will not be interested in it. Contrary to popular belief, flax can be sown the same time $s oats, which gives it time to get ahead of the weeds, which normally germinate in hot weather. There is a general impression that flax is hard on the soil and that yields of succeeding crops are reduced, but experimental work at the Wisconsin and Montana stations shows that flax has no harmful effects on the following crops.6 At the present time so little flax is produced in Iowa that a 'farmer raising only, a small acreage of it may find marketing difficult. Lo calities producing less than car load lots can not market the seed economically. Farmers wishing to raise flax should con sider it as an experiment and raise only a little until such a time as the merits of the crop and its culture have been as certained.
IO W A IS NO T A W H E A T S T A T E
Figure 3 shows the percentage of small grain land seeded to winter wheat in 1925 by townships. Altho winter wheat amounts to only 5.7 percent of the small grain area of the state, its importance as a small grain in the parts of the state where it is grown is. greater by far than this figure would in dicate. I t so happens that where winter wheat is most im portant, the total amount of small grain is comparatively small. This fact explains the apparent discrepancy between the percent of small grain in wheat for the state as a whole and that shown in fig. 3.
The Iowa wheat grower finds himself in the unfortunate position of being too far north for optimum winter wheat pro duction and too far south for optimum spring wheat pro duction. The winter wheat producer’s difficulty arises from
Fig. 3. Percentage of small grain acreage in winter wheat by townships, 1925. Basic data secured from Iowa State Department of Agriculture.
winter killing which is not due to excessive cold, but to alter nate freezing and thawing without snow covering which frac tures the roots. Figure 4 shows the 10-year average, 1920 to '1929, in the percentage of winter wheat acreage abandoned in counties of the state where the acreage planted was large
Fig.. 4. Winter wheat abandonment, percentage o f acreage sown, 1920 to. 1929. Data from Iowa State Department of Agriculture.
enough to be significant. For the state as a whole, 6.4 per cent of the acreage planted is normally abandoned.
Of the two types of wheat, winter varieties compete more sue cessfully with oats in the southern part of the state than spring varieties do in the northern part. For this reason nearly all the wheat in Iowa is sown in the fall.
Winter wheat yields are higher in comparison with oat yields in the southern section than in the northern. The ratio of oat yields to wheat yields is shown in fig. 5, which illustrates the relative superiority of winter wheat over oats in the southern part of the state as compared to the northern. A comparison between fig. 5 and fig. 1 or fig. 3 illustrates the effect of this difference in comparative yields on the percent of small grain in oats and in winter wheat.
The high relative wheat yields in the southern part of the state are due to a variety of natural conditions, which may be classed under temperature, soil and surface. The southern part of the state is a little warmer than the northern and also has a lower elevation by several hundred feet, which is especially true of the crop land in the river valleys. The difference in Latitude and elevation results in hotter days and nights in the south than in the north. Winter wheat escapes more of this excessive heat than the oats by ripening earlier.
Winter wheat tends to be located principally on the Wabash silt loam, as can be determined by comparing soil maps of coun ties with the wheat map. Wabash is a flat river bottom soil high in phosphorus and nitrogen. The water table usually
lies close to the surface, especially in the spring when spring work needs to be done. This rich soil, which in many cases is replenished by overflow or by erosion from adjoining up lands, is ideal for wheat, but unfavorable soil conditions for field work in early spring may so delay the seeding of oats that the crop encounters excessive heat at a critical period in its development. Winter killing of wheat is not so likely to occur on the flat land of the river bottom as under other conditions. This may be because snow does not tend to blow off or because a high percentage of moisture in the soil is beneficial. Oats on this type of soil often lodge badly because of the high percentage of nitrogen.
Altho it is easy to understand why more winter wheat is raised in the southern part of the state than in the northern, it is not so clear why more winter wheat is not raised in all parts of the state. The method of figuring values of winter wheat and oats by multiplying the average yield by the average price shows that winter wheat normally exceeds oats in value per acre by approximately 25 percent7. The costs of production are not greatly dissimilar. The most important reason for the limited acreage of winter wheat is no doubt the difficulty of fitting it into the typical Iowa rotation of corn, corn, oats and clover. Under the Iowa system of farming, if winter wheat were fitted into the rotation, it would of necessity follow oats. Iowa farmers do not remove their corn early enough to follow corn with winter wheat. Under the ordinary rotation one-half of the crop land is in corn, but under a modified system with winter wheat only 40 percent of the,crop land would be in corn. Inasmuch as corn is usually a more valuable crop than winter wheat, we find little tendency to reduce corn acreage in favor of the latter grain.
In those sections of the state where the winter wheat acreage is important in the cropping system, corn also is important, but oats are negligible. The bottom land soils of the areas pro ducing winter wheat enable the farmers to grow many crops of corn in succession. Other land which is too wet to grow corn is used year after year for winter wheat. These practices result in a high percentage of both corn and winter wheat. However, culture of this type is not economical in most parts of the state.
T H E S M A L L G RAINS AS A U N I T
We have seen that there is a rather large variation in the different parts of the state in the proportion o f. land devoted
7. Winter killing does not enter into the calculations of acre values, because only the acreage harvested is used in determining winter wheat yields and not acres planted. The cost of planting abandoned acreage together with the disruption of the farm plans should be deducted from the acre value for winter wheat in order to get a figure comparable with the acre value of oats.
to different small grains. This, we have noted, is partially due to differences in natural conditions. We must also recognize that part of the variation is due to the competitive relationships existing between the different small grains. If a farmer desires to raise more barley or wheat he will usually reduce his oat acreage. Contrasted with the competitive relationship existing between each of the small grains, we find the relationship exist ing between corn and the small grains taken as a unit to be mutually, supplementary. There are six rather self-evident rea sons why this is tru e :
1. It m akes possible a more uniform distribution of labor
than is possible with either corn or sm all grain alone.
2. Larger yields are secured when the land is used alternatively by different crops than when planted continuously to the same crop.
3. Small grains act as nurse crops for the seeding of legum es
and other grasses, which restore fertility to the soil or form a sod which checks erosion, thus benefiting corn indirectly.
4. Small grains and corn may supply a more balanced ration
for livestock than corn alone.
5. Land rotated with corn and sm all grain is not as subject
to erosion as land planted to corn alone.
6. A mixed cropping system results in greater diversification of income than a system consisting of either corn or sm all grain alone.
go JO 40 SO 60 TO to SO
raticm
PERCENT Or GROIN LNND IN SHNLL GROIN.
Fig. 6. Contrast between the variation in the type of small grain and the amount of it by townships, 1925. Basic data from Iowa State Department of Agriculture.
For these reasons Iowa farm ers divide their grain land into somewhat constant proportions of corn to small grain regardless of the amount of grain they have. This tendency is one of the most uniform features of Iowa farming. In regions where the com acreage is much over 50 percent of the crop land, not enough land remains for a full complement of small grâih and a minimum amount of hay and pasture, therefore, we find the proportion of small grain acre age to be less than in regions where the corn acreage amounts to only 40 percent of the crop land. Other conditions may be found which are favorable for corn production but unfavorable for small grain production. Va riations in these conditions will necessarily produce variations in the percentage of grain land in small grain. However, the
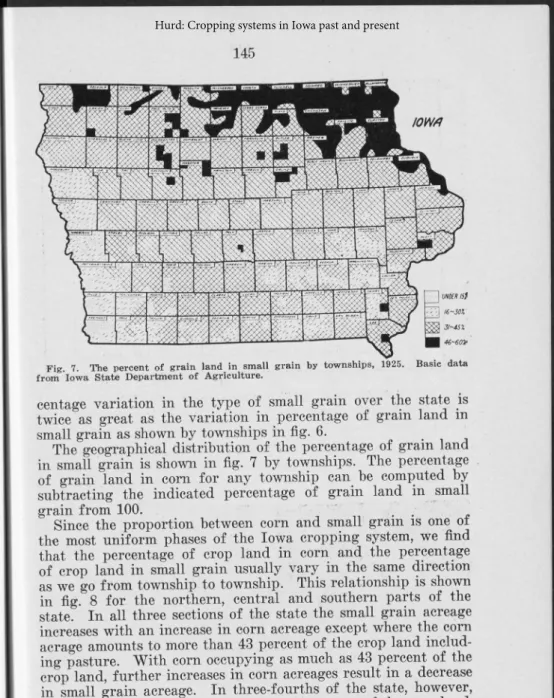
per-Fig. 7. The percent of grain land in small grain by townships, 1925. Basic data from Iowa State Department of Agriculture.
centage variation in the type of small grain over the state is twice as great as the variation in percentage of grain land in
small grain as shown by townships in fig. 6. _
The geographical distribution of the percentage of gram land in small grain is shown in fig. 7 by townships. The percentage of grain land in com for any township can be computed by subtracting the indicated percentage of grain land in small
grain from 100. \ .
Since the proportion between corn and small gram is one of the most uniform phases of the Iowa cropping system, we find that the percentage of crop land in corn and the percentage of crop land in small grain usually vary in the same direction as we go from township to township. This relationship is shown in fig. 8 for the northern, central and southern parts of the state. In all three sections of the state the small grain acreage increases with an increase in corn acreage except where the com acrage amounts to more than 43 percent of the crop land includ ing pasture. With com occupying as much as 43 percent of the crop land, further increases in corn acreages result in a decrease in small grain acreage. In three-fourths of the state, however, the corn acreage amounts to less than 44 percent of the crop land. Figure 8 shows the decrease in the importance of small grain as compared to com as one goes from the northern part of the state to the southern, and the influence of the typical Iowa rotation of corn, com, oats, and clover. This rotation calls for twice as much corn as small grain. For the three-fourths of the state having less than 44 percent of its crop land in corn, the small
Fig. 8. Relationship between the percentage of crop land in corn and the per centage of crop land in small grain by sections of the state for 1925. Basic data from Iowa State Department of Agriculture.
grain acreage amounts to slightly more than one-half that of the corn acreage. This condition comes about because com paratively few farmers have a corn-oats rotation. As we go
I0 W 4
Percentage of crop land including pasture in small grain by townships, 1925. Basic data secured from Iowa State Department of Agriculture.
I 1UNDER
IOWA
Fig. 10. Percentage of crop land including pasture in com by townships, 1925. Basic data secured from Iowa State Department of Agriculture.
_J UNDER.m
Q 2 0 -3 0 %
40-S0X OrtNSOX
from areas having a small corn acreage to areas of larger corn acreage but having less than 44 percent of the crop land in corn, we find that the small grain acreage increases one-half as fast as the corn acreage. This is due to the tendency of farmers to keep the same'proportion between corn and small grain. Figures 9 and 10 show the percentage distribution of small grain and corn respectively by townships.
The geographical difference
PERCENT CORN
Fig. 11. Relationship between the per cent corn yields are of oat yields, and the percent of grain land in small grains by counties, 1918-1927. Basic data from
Iowa State Department of Agricultude. H H . w These relationships have been tested by multiple jm d Partial correlation.
in the proportions of the crop land occupied by corn or small grain can he explained largely in terms of differences in (1) ratio of corn yields per acre to small grain yields, (2) quality of corn compared to quality of small grain and (3) yield of small grain. These points are illustrated with reference to oats, the chief small grain. Fig ure 11 shows the relationship be tween the percentage that corn yields are of oat yields and the percentage of grain land in small grain by counties.8 A county having equal yields of corn and oats has about 48 percent of its grain land in small grain, while
- ...1 'm m The 8. lnese reutnuiiamjj» ~ --- - . r._
cent of corn merchantable and the per* cent of grain land in small grain by counties, 1923-1927. Basic data from Iowa State Department of Agriculture and United States Department o f Agriculture.
counties having com yields equal to a 110 percent of their oat yields have about 41 per cent of their grain land in small grain.
We do not have data on qual ity of small grain by sections of the state, therefore in our comparisons we shall have to be content only with quality of com. Figure 12 shows the in fluence of quality of corn as measured by the percentage of corn merchantable on the per centage of grain land in small grain by counties. Counties having 70 percent of their corn merchantable have about 47 percent of their grain land in small grain, while counties having 80 percent of their corn merchant able have on the average only 37 percent of their grain land in small grain.
The relationship between the average yield of oats and the percent of grain land in small grain is shown in fig. 13. Counties having a 30 bushel average yield of oats have about 28 percent of their grain land in small grain, while counties having an average yield of 40 bushels per acre have about 49 percent of their grain land in small grain.
Farmers tend to grow those crops which give them the highest returns. Figures 11, 12 and 13 illustrate this fact indirectly with respect to oats. Where oats return relatively more than com both in terms of amount
and quality, we find a higher place given to them in the crop ping system than where the re verse is true. Oats, like other small grains, are supplemen tary to corn in the crop rota tion, which is probably one of the main reasons for their im portance in Iowa. However, the amount of a supplementary crop like oats which farmers find profitable is directly pro
portional to the yeild. This is Krw '* " PCR XRe
shown in fig. 13. For corn, the ,Fte- 13- Relationship between average , . ft i yield of oats per acre and the percent of
HI8»JOr enterprise, we lino, no grain land in small grains by counties,
Fig. 14. The percent of crop land including pasture in grain in 1925 by townships. Basic data from Iowa State Department of Agriculture.
yield per acre and the percent of land planted.9
GRAIN L A N D V A R IA B L E
The geographical stndy thus far shows that grain land is made up of corn and small grain fn rather refinite proportions, depending upon natural condi tions. In fig. 14 the percent of farm land in grain in 1925 by townships is considered.
The most striking variation in the Iowa cropping system is the difference in the amount of land used for grain. Union Town ship, Appanoose County, has less than one-fifth of its land in use for grain, while Twin Lake Township, Calhoun Coun ty, has over four-fifths. These two townships represent the
ex-__ tremes of two types of
farm-_ .. ing found in Iowa.10 Townships
taSf-tad
Which have four times as muchthis land planted to grain crops, by coun- ffraj n ag other tOWnsMpS of
t/i&s 1924. ®
9! Edgar B. Hurd, “The Corn Enterprise in Iowa,” Iowa Agr. Exp. Sta. Bui.
259! 1929. ( P I . ■ ■ H
equal size can be found in only a few places. However, very im portant geographical differences exist as shown in fig. 14. In general northwestern and western Iowa raise more grain than eastern and southeastern Iowa. Exceptions may be found by look ing closely at the may, but in the main the former area uses one- fourth more land for grain than the latter.
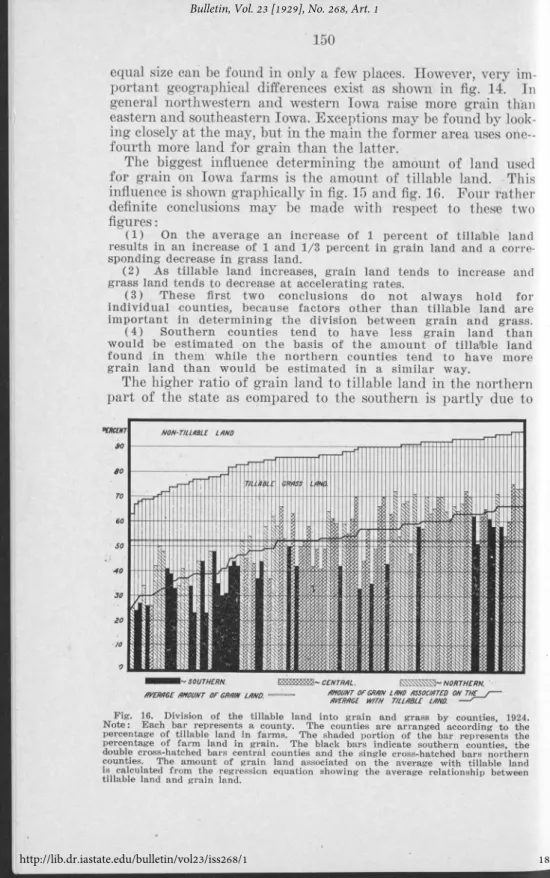
The biggest influence determining the amount of land used for grain on Iowa farms is the amount of tillable land. This influence is shown graphically in fig. 15 and fig. 16. Four father definite conclusions may be made with respect to these two figures:
(1 ) On the average an increase of 1 percent of tillable land
results in an increase of 1 and 1/3 percent in grain land and a corre sponding decrease in grass land.
(2) As tillable land increases, grain land tends to increase and
grass land tends to decrease at accelerating rates.
(3 ) These first two conclusions do not always hold for
individual counties, because factors other than tillable land are important in determining the division between grain and grass.
(4 ) Southern counties tend to have less grain land than
would be estim ated on the basis of the amount of tillable land found in them while the northern counties tend to have more grain land than would be estim ated in a sim ilar way.
The higher ratio of grain land to tillable land in the northern part of the state as compared to the southern is partly due to
O/EROGE M OUNT OE GROIN LOND OMOUNT OE GROIN LORD OSSOCIOTED ON T H E / OVEROGE WITH T/UOBLE LONO. --- '
Fig. 16. Division of the tillable land into grain and grass by counties, 1924. N o te: Each bar represents a county. The counties are arranged according to the percentage of tillable land in farms. The shaded portion of the bar represents the percentage of farm land in grain. The black bars indicate southern counties, the double cross-hatched bars central counties and the single cross-hatched bars northern counties. The amount of grain land associated on the average with tillable land is calculated from the regression equation showing the average relationship between tillable land and grain land.
PERCENTAGE OF GRAIN LAND IN SMALL GRAIN NO. OF
1 1
PERCENTAGE OF CROP LAND I G R A I N .
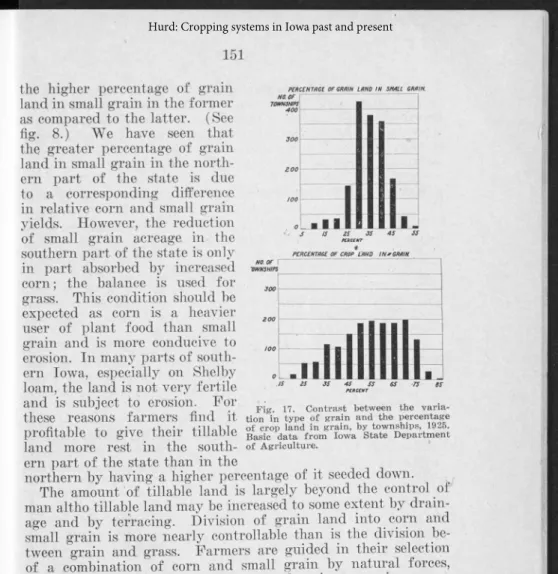
t r i the higher percentage of grain
land in small grain in the former as compared to the latter. (See fig. 8.) We have seen that the greater percentage of grain land in small grain in the north ern part of the state is due to a corresponding difference in relative corn and small grain yields. However, the reduction of small grain acreage, in the southern part of the state is only in part absorbed by increased corn; the balance is used for grass. This condition should be expected as corn is a heavier user of plant food than small grain and is more conducive to erosion. In many parts of south ern Iowa, especially on Shelby loam, the land is not very fertile
and is subject to erosion For w * ■ Contrast between the varia_ these reasons farmers find it tion in type o f grain and the percentage
profitable to give their tiUable i
land more rest in the south- of Agriculture,
ern part of the state than in the
northern by having a higher percentage of it seeded down. The amount of tillable land is largely beyond the control of man altho tillable land may be increased to some extent by drain age and by terracing. Division of grain land into corn and small grain is more nearly controllable than is the division be tween grain and grass. Farmers are guided in their selection of a combination of com and small grain by natural forces, but natural forces influence the type of grain grown in a more indirect manner than they influence the proportion between grain and grass. For instance a farmer can not produce corn on nonbillable land, but he'can rotate corn and small grain in almost any proportion he desires on tillable land. We might expect from these observations that the percentage of grain land in small grain would be more variable than the percentage of crop land in grain, which is no doubt true between farms within a small area such as a township. However, if we con sider variations between townships over the state, the percentage of grain land in small grain varies less than, one-half as much as the percentage of crop land in grain. This is illustrated in fig, 17 which shows in contrast the .variation in type of grain and the percentage of crop land in small grain.
2 and 3. The large variation in proportionate acreage existing between grain and grass shows that these differences are deter mined by factors largely beyond the control of man. On the other hand, the uniformity existing between the proportions of corn and small grain shows that these two land uses are essentially a part of the larger classification, grain.
S U M M A R Y OF T H E CR OPPING SYS T E M BY SECT IO N S OF T H E S T A T E
Township maps show rather large contiguous areas in which there is a high degree of uniformity in the cropping systems. The state may be divided into four areas in which the townships do not show marked variation in their cropping systems. How ever, there is a rather large area in east central Iowa in which the variation in cropping systems between townships is ap proximately as large as is found in the entire state. This area has been designated as a mixed cropping area.
The northeast corner is a grass and small grain area. In this section very nearly all the townships have less than 30 percent of their crop land in corn. The Small grain acreage runs about the same as that of corn, and grass takes up .over 50 percent of the crop area.
In the central and northern part of the state there is a large area in which approximately all townships have corn acreage in excess of 30 percent of the crop land, small grain in excess of 20 percent and grass less than 50 percent. This area is classed as a grain area.
Fig. 18. The cropping areas of the state. Basic data from Iowa State Department of Agriculture.
In the southwestern corner of the state is a born and grass area. Here approximately all the townships have com in excess of 30 percent of the crop area, small grain less than 20 percent and grass 50 percent or less depending upon how .much corn is present.
The south central and southeastern parts of the state compose a grass area. Here approximately all the townships have grass in excess of 50 percent of the crop area, corn less than 30 per cent and small grain less than 20 percent.
These areas are shown in fig. 18 together with bar diagrams which show the average amount of corn,- small grain and grass in each area. The bar diagram was omitted from the east central area on the map because it was felt that an. average for this area would be misleading.
While it is true that the bar diagrams in fig. 18 represent the average cropping system of similar townships, it must be borne in mind that individual farms vary materially in their cropping systems from these-averages; However, the most common system of cropping in the township resembles very closely the mean for the township. Therefore, the typical crop ping system in each township from the standpoint of individual crops and from the standpoint of crop combinations has been studied. The various crop combinations shown in fig. 18 are the result of the joint judgment of farmers concerning the most profitable way the land should be used. Altho this type of study does not test out the degree to which the most common system of cropping represents the most profitable system, it does relate the variation in the cropping system which exists between town ships and the variation in some of the known natural conditions of these townships. For one beginning farming the safest plan of procedure is to follow the most common type of farming found on his type of land until he has had time to determine the greater
profitableness of a different type.11 ■ .
It must not be assumed that there is one most profitable system of farming for all individuals having the same set of environ mental conditions. The ability of- the farmer himself along all lines of production must be considered. Furthermore, the most profitable system of farming changes from time to time as prices change and new techniques develop. Thus far we have not discussed the influence of changing prices and technique upon cropping. While these forces are about constant over the state at any particular time, they vary from year to year. Therefore, their infliience will be noted &nd correl&ted^witn the cropping system in the historical section of this bulletin.
U . For »»<>™ « » » * 1 S Æ I i ' S S S t a M t a t a 25TafoUow very roughly the cropping system areas shown in this bulletin. Type of farm ^ g is m e ^ r e d by the proportion of the crop sold and to what type of livestock the remainder is fed, as well as by the cropping system.
60%
grain,' 1899 S ? development in percent of crop land, including pasture in
History of Cropping Systems Since 1900.
Changes in the cropping systems of the state since 1900 are largely proportional. They have occurred in some sections of the _ state, but in other sections almost no changes have been made. No new crops have been added or old ones discarded.
H I S T O R Y OF G RAIN
Figure 19 shows that the percentage of crop land, including pasture, in grain from 1899 to 1928 has varied within narrow limits. This historical variation may be contrasted with the geographical by comparing fig. 19 with fig. 17. Most of the increase in grain acreage has taken place in western and northern Iowa. From 1909 to 1927 western and northern Iowa increased its grain acreage in some sections 9 percent of the crop area including pasture and in others 17 percent. During this period eastern and southern Iowa increased its percentage of crop land in grain including pasture in only a few counties. All of the increase in the southern and eastern part of the state took place during the war. After the war 14 of these counties fo their former position with respect to grain, and by 1927 thé remaining three had lost about one-half of their gain. Most of the variation in grain acreage which took place in the southern part of the state during the war was due to an
expan-sion of wheat acreage. After the war wheat became relatively less profitable and most of this land was returned to grass.
In the northern and western parts of the state most of the increase in grain acreage has probably resulted from drainage, especially the increase which took place between 1909 and 1919. Since 1919 the influence of drainage has not been ns im portant as before, altho this factor no doubt has contributed to increase the land in grain in many northern and western counties.
In some counties of northern Iowa, as recently as 1920, wild hay occupied as much as 6 percent of the entire farm area. This wild hay amounted to one-half of the total hay in several counties of the northern part of the state. In the western tier of counties in 1920 the percentage of land in wild hay varied from 1.0 to 3.7 percent of the entire farm area. Practically all of the wild hay of Iowa is on land which if drained could be used for grain. There has been a big decrease in the amount of land devoted to wildThay in those sections of the state for merly having large amounts of it. In northern Iowa from 1919 to 1927 the decrease amounted to 2 percent of the total farm area or about half of the wild hay area existing in 1919. If we assume that only a part of the wild hay land was used for hay in 1919 and the rest for pasture, it would follow that most of the increase of grain land in this section is due to the draining of this type of land.
Developments in farm machinery have enabled farmers to handle more crop acres with the same amount of labor. The two row corn cultivator is more common in the heavy corn pro ducing sections than formerly. Small general purpose farm tractors are widely used in areas of the state where^ the per centage of grain land is large. In these sections in recent years, a large number of corn pickers have come into use. These machines have not been adopted in southern Iowa be cause the soil and topographical conditions do not permit their use. The acid condition of the soil combined with the high cost of liming does Uot permit the growing of sweet clover except at a much higher cost than in regions where the soil is naturally sweet. Further, in southern Iowa it is not possible to reclaim land for cropping by drainage as it is in northern Iowa, the big problem being erosion instead of drainage. Iti fact, the fear of erosion is probably the main reason for the lack of expansion of the grain acreage in southern Iowa, which has made impossible the introduction of new machinery on the scale that is profitable in the northern and western parts of the state.
H IS T O R IC A L COMPAR IS O N OF CORN A N D S M A L L G RAIN
In general, two developments have taken place. (1) In the northern part of the state the small grain acreage relative to that of corn has declined. (2) In the southern part of the state the percentage of grain land in small grain in 1919 had increased over that of 1909 by about 15 percent, but by 1927 about two-thirds of this increase was lost. The change in the ratio of corn to small grain which took place in the southern part of the state was due largely to the increased wheat acre age in this section. The northern part of the state did not increase its wheat acreage materially during the war because natural conditions were more favorable for grains other than wheat: Oats and barley are the small grains which have com peted with corn in the northern part of the state since 1900. Since the war, the prices of both oats and barley have not been very attractive when compared with the price of corn as is Shown in fig. 20.
The newly drained land in the northern part of the state is often very rich in nitrogen. Corn on this type of land has its greatest comparative advantage over small grain. Partly due to superior land and partly to improved varieties of corn, the northern section of the state has increased its yield of corn per acre about doubly as fast as has the southern section. Figure 21 shows the trend in yields of each of the grains by geographical sections. The increase in corn yields in southern Iowa apparently measures the extent to which better cultural
Fig. 20. Comparison of farm price trends of Iowa grains before and after the war. Basic data from United States Department of Agriculture.
methods and better varieties have been able to overcome the known decreased fertility.
H I S T O R Y OF T H E S M A L L GRAINS
At present oats amount to over 80 percent of all small grain grown in the state as is shown in fig. 1, but in pioneer times wheat was the most important grain crop in all parts of Iowa. At that time barley was also important. Northeast Iowa, except for the rough counties on the Mississippi river, has had an oat acreage in excess of 80 percent of its small grain since 1900. Prior to 1880, however, wheat was its most important crop12.
North central and northwestern Iowa were settled later than northeastern Iowa and the influence of the pioneer stage of agriculture could still be seen in 1900. Wheat still amounted to one-fourth of the small grain in these two sections in 1900, and barley was important as late as 1910 in the three extreme northwest counties.
Wheat has always been an important crop in the southern part of the state. The southwestern counties have occupied first place in wheat acreage as far back as 1900. They never have had less than 25 percent of their small grain acreage in wheat, and in 1920 they had over 50 percent when all of the southern counties responded to the cry for wheat because, of the war. "Wb have seen m fig. 5 that wheat yields are
relative-19 Albert Michell. A Study of the Organization and Management of Dairy Farms in 1 Nor Oleaster n Iowa,’ ’ pp. 64. Iowa Agr. Exp. Sta. Bui. 243. 1927.
1 y low as compared with oat yields in the northern part of the state and relatively high in the southern part. For this reason, it takes extremely high comparative wheat prices to draw northern Iowa into wheat production, but the price structure ex isting during the war was sufficient stimulus to southern Iowa to induce it to raise more wheat.
Since 1919 wheat acreage has declined relatively to all small grains in southern Iowa. This decline has taken place in spite of the fact that wheat has not declined in price as much as oats or barley. ^ In fact by projecting the upward trend of wheat prices existing before the war to the present, we find wheat prices closely following this trend. On the other hand barley prices and oat prices are far below their projected pre war trends. We may next ask why southern Iowa has reduced its percentage of small grain in wheat when wheat is relative ly the highest priced small grain. Southern Iowa farmers have responded to high prices for beef and butterfat by in creasing their cattle enterprises, which has called for more grass land. Since wheat is a cash grain and oats a feed grain, the wheat acreage has been reduced to make room for the expanded grass area. What little oats are rasied in this section can be profitably fed.
Oats, except on the river bottoms in the southern part of the state, is the leading Iowa small grain. I t; has won this position over wheat because it is better adapted to the Corn Belt rotation and is a feed crop instead of a cash crop. ' It has won its position over barley because it is a better supple ment to corn, is less difficult to harvest and its straw is worth more' per acre. Oats has won in spite of continued relatively low prices. The comparatively low oat prices have been brought about by replacing horses with tractors and auto mobiles. However, the comparativly lower prices for oats have been offset to some extent by greater increases in the yield per acre than of barley, while winter wheat yields have actually declined since 1915-. (See fig. 21).
H I S T O R IC A L S U M M A R Y OF T H E CROPPING SY S T E M
Figure 22 shows the cropping areas of the state for the years 1899, 1909, 1919 and 1928. They were determined in the same way as those in fig. 18.
It niust be understood that counties near the boundary line of a. given cropping area are very similar to those just across the. border. It very, frequently happens that a slight change in the proportions of crops in a county will be enough to place it in a different cropping area. Altho fig. 22 accentuates the changes which have occurred in the cropping system, we
159
should not discount them too much. Very obviously the small grain-pasture area is being changed to a grain area. Soil improvement, -drainage and the selection of better adapted varieties of corn are bringing about this change. The grass area of southern and eastern Iowa is being changed to a corn and grass area. I t is possible that farmers are finding a long rotation such as corn, corn, small grain, clover, timothy and timothy, profitable on- very rolling soil. Rotations of this type are common on rough land in Iowa County.13
• T H E F U T U R E OF T H E IO W A CR OPPING SYST EM
The above historical study has demonstrated the influence of prices and of changes in methods of production upon the cropping system. These forces are just as important as soil and topography in shaping the .cropping systems of the state. The soil and topographical conditions on the farm are the static elements of the business. They can be determined once and for all. But the technique of farm production is constant ly changing as are prices of farm products. However, the United States Department of* Agriculture in its outlook work is making progress in predicting ■-what the trends in farm prices will be for one year in the future. This information is made available early enough to be of »use to the farmers in planning their cropping programs. A given price change may mean that considerable reorganization is desirable. On the other hand, even tho prices have changed, no important modification of the cropping system may be warranted. Fluc tuations in prices from year to year need to be distinguished from more permanent changes. A certain amount of adjust ment can be made to meet yearly fluctuations in prices, but complete reorganization is. not profitable -unless ' tKë price changes have become permanent. The individual farmer must judge for himself in the light' of his own conditions -what changes he should make as a result of prospective prices.
The price of oats seems destined to remain at'] a compara tively low level. The tractor and the automobile have elim inated so many horses that the demand for oats has been greatly diminished. The horse population is ;still declining. According to the Federal Outlook Report for 1929 the present horse and mule population for the country as a whole is about 19 million as compared tq 25 million in-1920. The Iowa farmer has been meeting this situation by cutting down the total acreage in small grain, substituting to .a minor extept barley for oats and increasing the com acreage. The yields of corn per acre have been maintained by better seed selection,
grow-13. J. A. Hopkins, Jr., “The Crop System in Iowa Cpunty,” Iowa Agr. Exp. Sta. Bui. ’ 261, 1929.
NUMBERS REPRESEN1 PERCENTAGE OF CROP AREA LN CORN AND SMALL GRAIN.
COWLESS-Tt/mOMFCROP/im Sm GmHESSmNMOFΞmh
3 o J CORN-LESSm MhMCfCfíOP-Mñ
vol Sn-GMiii-rmto-TOMmopMfl.
Fig. 22 (D) Cropping areas of Iowa, 1928.
CORN-JOZ-Ofí-MOPE-OF-CROP-flRM Srn-GRmLESS-mN-2ÛZ-(fCR0Mm
CORN-JOZ-OR-MOREOE-CROPEIREfí Sm-GMINEOZ-OfHfOREOKfïOPRm
ing more legumes and better cultural methods. These pro cesses will probably continue until all of the oats produced will be fed within the state. At the present time 35 percent of the oats crop is sold out of the state. A small increased acre age of legume hay and corn would enable Iowa farmers to feed profitably all of the oats that they produce.
It is probable that changing technique will have as much or perhaps more effect on the Iowa cropping system as changes in prices. Many of these influences can be seen at work at the present time. The introduction of sweet clover into areas of the state having naturally sweet soil is tending to increase the corn acreage. Soybeans are proving of value as a hay and seed crop in areas needing lime and are tending to replace oats and barley and make more room for winter wheat. A common rotation with soybeans is corn, corn, soybeans, winter wheat and clover with timothy, the latter remaining in sod as many years as is necessary to prevent erosion. If much permanent pasture is available in addition to the crop land, this rotation does not provide enough concentrates for the livestock that can be raised. Under such circumstances corn and oats may be purchased to advantage.
Recent experiments at the Iowa Experiment Station have proved the profitableness of phosphate fertilizer, and in recent years an increasing amount has been applied. It is possible that liberal use of this fertilizer will bolster up the declining wheat yields in southwest Iowa and make possible a higher proportion of wheat in this section. The advantages of lime and drainage are well known. These two improvements will continue to be made where needed.
Weeds also have their effect. We ’learn to live with or partially exterminate the old ones, but new noxious weeds when they become well established often permanently change the cropping system. Marsh cress is a winter annual threat ening to take the winter wheat acreage in the western part of the state. It is probable that this weed will cause much of the winter wheat land in this section to be drained in order that crops niay be rotated and the weed exterminated.
Inserts sometimes change cropping systems also. If the corn borer arrives we may see some reduction in corn acreage in those parts of the state where corn makes lowest return relative to other crops. In such sections barley m#y replace corn, as barley is a more acceptable corn substitute than other small grains,
New equipment is helping to reduce the peak labor load on corn in our heavy corn producing areas. This improved
machinery pins sweet clover and in some cases phosphate fertilizer may result in a higher percentage of corn. Of course no one can look very far into the future. Each farm is more or less an experiment station where new developments are being tried out, but as these developments prove worth while, they will affect the cropping system and the type of farming.