Graphs ’n Glyphs as Professional Transitional Software to Assist
Middle School Students in Rational Number Reasoning Topics
Alan Maloney, Kenny Nguyen, and Jere Confrey
North Carolina State University, USA
[email protected], [email protected], [email protected]
Abstract. Graphs ’n Glyphs, a mathematics and animation microworld, was used in two workshops with upper elementary and middle schools students. The workshops taught students to create animations along with solving congruent matching exercises, and mazes using geometric transformations. Initial results indicated that students became more proficient in the relevant mathematics. We report on student investigation which revealed misconceptions about scaling and describe how those interactions led students to change from additive to multiplicative approaches to scaling.
Introduction Graphs ’n Glyphs (Confrey & Maloney, 2006), a mathematics and animation software was designed to assist students in becoming proficient in rational number reasoning and mathematical modeling, and in gaining proficiency with the technologies required for employment in the new economy (COSEPUP, 2005; Wilson, 1996). Grounded in learning progressions (Clements & Sarama, 2004; Simon, 1995), conceptual corridors (Confrey, 2006), modeling approaches (Confrey & Maloney, 2007; R. Lehrer & Schauble, 2006), and production and revision of inscriptions (Latour, 1990), the multi-representational software provides a microworld environment in which students learn the mathematics underlying computer animation. The mathematics includes measurement, Cartesian graphing, multiplicative reasoning, distance, ratio, proportion, similarity and scaling, congruence, fractions, and decimals. Planned future expansions of Graphs ’n Glyphs will focus on early trigonometric reasoning and periodic functions within the context of optics (modeling the behavior of light) and acoustics (modeling the behavior of sound).
Graphs ’n Glyphs was first used in a three-week teaching experiment with urban students in St. Louis (Confrey et al., in press). We report here on some of the design decisions embedded in Graphs ’n Glyphs, including concerns which arose from the 2006 experiment, the concept of “Professional Transitional Software” (Confrey et al., 2007), and introduce findings from a new teaching experiment that we conducted during the spring of 2008 with middle school students in Raleigh, North Carolina.
Professional Transitional Software. Graphs ’n Glyphs is an initial example of Professional Transitional Software (Confrey et al., 2007). Such software incorporates learner-centered and pedagogically sound design that facilitates specific content development, while introducing learners to features and functional metaphors of software used in occupations (such as graphics and animation) that are attractive to students. In the case of Graphs ’n Glyphs students create narratives expressed as animations via digital modeling on two-dimensional screen surfaces, which are facilitated by increasingly sophisticated mathematical understanding. Four salient characteristics of professional transitional software are 1) incorporation of design features and operational metaphors representative of professional-level applications, 2) standard file-management structures, menus, and controls (to build fluency in routine IT skills), 3) coherent staging to ease students’ transition to professional software, and 4) design features that promote robust content conceptual development.
Prior Work. A three-week summer workshop lasting three hours per day was attended by eight rising 6th graders. Pre-assessments and initial discussions with students revealed that they were well-versed in whole number, place value, and addition and subtraction of whole numbers, but were weak in multiplication and division, had difficulty working with negative integers, had not used the number line to develop further number and operation sense, and had
only basic understandings of angles, fractions, and coordinate graphing. The first week was dedicated to introducing subtraction as a model for measurement, coordinate graphing, and negative numbers as tools for representing position relative to zero, operating in addition and subtraction of integers, and indicating directionality of motion. By the end of the workshop, students were skilled in coordinate graphing (though some students still reversed the x- and y -coordinates). They had also developed explicit understanding of a) translations and reflections and the consequences for object and coordinate pair position as a result of those transformations, b) rotations (though their understanding of angle measure or rotational transformation was not robust), and c) the relationship of the pivot point (origin of an object’s local coordinate plane and point of invariance for scaling and rotation) to rotational motion, and were able to design animations with all those transformations as well as scaling. In the final session, students explained to an adult lay audience (parents and others) why they chose particular transformations for their animations’ designs. Equally important, based on pre-surveys, many of the students in the workshop generally did not like their mathematics classes and had been apprehensive about attending a “math class” during the summer. By the end of the workshop, these students and their parents expressed increased confidence in students’ abilities and their enjoyment of math. Additionally, all of the students experienced reasonable success in creating animations. Student pretest scores ranged from 1.5 to 13 on a 25 point scale. Posttest scores ranged from 6.5 to 19.5. The median posttest gain was 3.6 which was significantly greater than zero (S = 17, P = .008, Wilcoxon signed rank).
Current Investigations using Graphs ’n Glyphs. Currently, two primary research questions serve to focus our research centered on Graphs ’n Glyphs: 1) How can making visible the mathematics underlying an animation environment support student learning of mathematics?, and 2) To what extent does the animation software environment engage students and enhance student learning of mathematics? During the 2006 workshop, we observed that the students had difficulties incorporating the mathematics efficiently into their activities within the software relying instead on counting and trial-and-error. Nonetheless, they reported that seeing the mathematics related to animations increased their interest in pursuing further study. Due to weak mathematical backgrounds, our first workshop included only minimal attention to multiplicative reasoning, particularly scaling. Therefore, the new study sought to elucidate the role of Graphs ’n Glyphs in students’ reasoning about scaling. Workshop Format. Four 6th grade and two 7th grade students participated in the 2008 workshop, which met after school for 1.5 hours per day, twice weekly for six weeks. Student work included paper-and-pencil and computer-based mathematics and animation tasks. Pre and post-assessments consisted of 4th and 8th grade NAEP items obtained from the NAEP item databank (http://nces.ed.gov/nationsreportcard/itmrls/startsearch.asp). Pretest scores ranged from 21 to 27 on a 32 point scale. Posttest scores ranged from 26.5 to 31.25 and the median of the gains was 3.1 (S=10.5, P=.02, Wilcoxon signed rank). Formative assessments were used to monitor student learning and will be reported on within the relevant section of the paper. Class sessions were videotaped to capture interactions and dialogue among students and instructors. In the final session, students presented their animations to their parents and other guests, explained their animation designs, and guided their parents in solving a new Graphs ’n Glyphs maze.
Instruction and student activities. Pre-assessment results indicated student proficiency with addition and subtraction of integers and basic coordinate graphing skills, but confusion over tic-marks and spaces in quantitative measurement problems. The instruction team reviewed a number of these skills in the opening class sessions.
During the first two weeks, the instructors introduced activities that were directly relevant both to solving mathematics problems and to animation and modeling of 3-dimensional space on 2-3-dimensional surfaces. Students engaged in a “directed drawing” activity, in which one student drew a figure based on verbal instructions (and progressively less feedback) from another student. This activity was used to emphasize the importance of accurate and specific instructions in both computer applications and in mathematical problem solving. Students viewed video clips from three different animated features and debated the characteristics of animations and graphics that made such videos more or less realistic, three-dimensional, and “alive” and engaging. These various representations on 2-dimensional surfaces were discussed in the context of modeling the three-dimensional world, and students were repeatedly engaged in discussion of what a model is, what purposes models can serve in different contexts, and the criteria one might establish for judging the quality of models.
The final four weeks of the workshop were comprised of mathematics activities and discussions and Graphs ’n Glyphs tasks, conducted in parallel. Students constructed objects in Graphs ’n Glyphs (sequences of points on coordinate points forming an enclosed shape), while learning coordinate graphing by playing “Battleship,” a game of “hide and seek” played by two or more players.
To introduce students to individual and combinations of transformation types, students were asked to solve matching challenges, in which they transformed an object in order to superimpose it exactly onto a target object. Transformations included translation, reflection, rotation, and eventually, scaling. In addition, the local coordinate plane in Graphs ’n Glyphs includes a pivot point which acts as the origin of that plane, the point of invariance for rotation and scaling, and which establishes the lines of invariance for reflection and uni-dimensional scaling. Moving the pivot point occasionally contributed to solutions to matching problems. Students identified the necessary transformations and predicted their parameter values. After making their predictions, they created an animation to verify whether their predictions were correct. They used this feedback to modify incorrect predictions and to explain any errors.
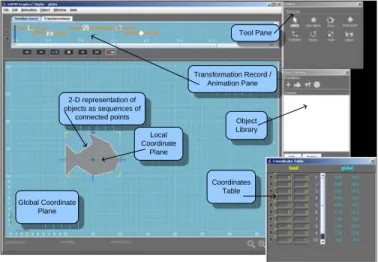
2-D representation of objects as sequences of connected points Global Coordinate Plane Local Coordinate Plane Coordinates Table Transformation Record / Animation Pane Tool Pane Object Library
Figure 1. The user interface and various tool panes of Graphs ’n Glyphs.
Students were continually experimenting with the software. The instructors asked them to begin constructing objects of their own design, and to begin designing animations. Students were introduced to the local (object-specific) and global (backdrop) coordinate planes of Graphs ’n Glyphs. They learned to use the Toolbar (the “doodle pane”) that includes a new object (a square), a clone tool (replicates an selected object), and the transformational “doodle tools,” allowing single mouse action-driven transformation and tracking of parameter values, which are used to change the permanent state of an object and to
experiment with individual transformations. They also learned to use the transformation dialog boxes (in which the numerical parameter values for the transformations must be specified for incorporation into the animation timeline) and began to create animations.
The matching activities served to introduce students to specific transformations, and required at most two or three transformations. The other main structured tasks in the workshop, requiring students to use multiple transformations, predict and specify parameter values, and sequence the transformations, were mazes. Students were required to provide the solution to each maze in the form of an animation. They then recorded the number of transformations they used on a large chart, which motivated the other students to revise their solutions to each maze to require fewer steps, and to eventually come to consensus as to the fewest possible transformations needed to solve the particular maze. These activities generated a great deal of excitement and discussion among the students.
Exploration of Scaling. Previous research has illustrated students’ difficulty with scaling embedded within the contexts of proportional reasoning and similarity. Understanding how objects change under an aspect-preserving scaling factor (i.e., a scaling factor that is applied in both the x and the y directions) is difficult because it requires coordination of similarity along with understanding the multiplicative nature of a scaling factor. Research by Hart (1988), Lehrer et al. (2002), and Lamon (1993) has shown that students believe proportional reasoning is an additive, not a multiplicative, concept. Of the four proportional reasoning problem types identified by Lamon, sixth grade students had the most difficulty with stretcher and shrinker problems because they believed that stretchers and shrinkers worked additively.
Those previous studies investigated scaling in relation to proportional and ratio reasoning and involved paper-and-pencil problems, not a dynamic software environment. Graphs ’n Glyphs incorporates scaling tools, so that students not only see what happens holistically to an object under a scaling factor but also what happens to individual points in that object. The design was informed by research on stretching a function in Function Probe (Confrey & Maloney, 1991). Borba (1993) found that students recognized that multiplicative changes in functions became visible when they vertically stretched sampled point sets on a continuous function and noted that y-values changed more the farther the points were from the axes. Therefore, we knew in working with students in Graphs ’n Glyphs, that we were likely to encounter challenges in helping them understand the connections between scaling and multiplication. We illustrate one set of exchanges in which the animation environment, student narrative design, and student collaboration all contributed to students changing from additive misconceptions to multiplicative reasoning to explain growth in a positive direction (without, however, their resolving issues of shrinking).
M, a sixth-grader, wanted a behavior that required a transformation (scaling) that the students had not used before. She experimented and made a conjecture which while it proved to be incorrect, led to an important discussion and investigation. Another student (D) and the instructor (I) participated in the discussion:
M: [to I] You have to…help me make the objects disappear because Arnold’s [a giraffe] got to eat the grass and go munch, and then munch and then it’s [the grass] gotta disappear.
D: Shrink it!
I: Shrink it.
D: No, you can’t shrink it … you can only make it go bigger.
M: How do I get it to animate shrinking?
I: Do you know what shrinking is?
D: [thinks for a moment, and then says:] Yeah. Scale…but if I hit the negative it will go BOOM! …
I: Okay, don’t go negative … well … so if you can’t scale with a negative …
M: Negative … listen! Scaling is shrinking, right?
I: Shrinking or growing…
D: Well, that doesn’t work.
D: [demonstrates what he has experienced when scaling using a negative scaling number. The object shrank to a point and then expanded to twice its size (reflecting across the pivot point), but D was not able to describe this.]
D: I’m going to go [use a scaling number of ] -1000!
I: Oh, don’t go -1000. Go -2.
D: What?
I: It [-1000] really will blow it out.
D: See, watch. [Types in a scale factor of -2 and applies the transformation.]
D: That was cool!
I: What happened?
D: It went BOOM, BOOM! [The object got bigger, not smaller.]
I: Seriously, what happened?
D: It went into it and then out to it.
I: Why did you choose negative? M, why do you think D chose negative?
M: Because he thought it would make it smaller.
I: Sounds like we need to talk about scaling.
M: Sounds like I really don’t know what it is … cause I don’t.
The instructor then explored with M and D what happened to the coordinates of the points in the object. The original square contained four points, (-2, 2), (2, 2), (2, -2), and (-2, -2), and thus sides of length 4 and the pivot point at the center of the square. Both M and D postulated that the square would “grow” by 2 on each side, which could be interpreted to mean doubling or adding two, unfortunately. Therefore, the instructor asked them what would happen with a scaling factor of 3 and it became evident that their conception of scaling was additive rather than multiplicative.
I: Can you predict what will happen when you do a scaling factor of 3?
M: It’s going to be 3 on each side.
I: Okay … so you’re saying that this now goes 3?
M: No … it’s 3 further than the (2, 2) point.
D: It’s going to be 3 diagonal out. For what you put in, it goes that number out. So if you say five out it’s going to go one, two, three, four five [pointing at the corners of five consecutive unit squares.]
M: Yeah! Three points out from the corner diagonal! I get it!
I: [motions to the corner point] But it didn’t go three points out …
D: It did! See … one, two, three, four, oh …
I: Okay, you [D] said it was going to go three out. She [M] said it was going to go out this direction [indicating that each side translates 3 units further out from the pivot point].
M: Wait, it’s going to be three this way, and then three that way, and then three that way, and three that way. [pointing in each case to indicate the direction in which the corner points of the square move] Are the original points (2, 2)?
I: Yes they are.
M: Then the points would end up (5, 5).
D: What?
M: Yeah!
I: See what he did? He counted them and he found that these are now six instead of two. Not five. Not three … so what happens?
M: I don’t know!
I: Come on, think about it: if these points become six and not five like you predicted …
M: It triples it!
I: Is that right?
D: Yes!
I: It triples it.
D: Can I say it?...Okay, it takes your original point which is 2 and multiplies it by …
M: Whatever you’re scaling it!
D: Which is 3. So if I put in 4 it’s going to be 2 times 4, which is going to make it (8, 8). So it’s going to make it go out. See … one, two, three, four, five, six, seven, eight.
I: Do you believe that?
M: Yeah, I think.
I: Okay, so what’s going to happen if he uses a scaling number of five?
M: It’ll quintuple it.
I: So what are your final coordinates going to be starting with (2, 2)?
M: (10, 10).
Now that the students seemed to understand that scaling by a factor, F, (F>1, F∈Z), they returned to address two questions: 1) How do they explain the outcome of scaling factor of -2?, and 2) How do they shrink an object? Tackling the first of the two questions, M observed that with a negative scaling factor the, “negatives go positive and the positives go negative. Once it switches points, it goes to the smallest place, and the object had to then get bigger.” They tried to explain why a negative scaling number caused the object to get smaller and then bigger. The instructor assigned them to think about the problem (without conferring with their parents). They returned with the explanation that: 1) the negative scaling factor reversed all the coordinates (because multiplying by a negative number reverses the signs) and 2) the object got bigger because the magnitude of the scaling factor determines the size of the object relative to the original size. Resolving the question of how to shrink the object required further instructional interventions.
Conclusion. The use of professional transitional software on the topic of animation is highly motivating to students. Not only did they demonstrate an ability to master the intended curricular goals, but they initiated independent explorations of mathematical ideas when they sought to meet their own goals in animating their narratives. Nonetheless, it is important to note that motivation alone is not sufficient to overcome well-known misconceptions. It still requires instructional intervention, even though students’ motivation improves their persistence, and a dynamic environment provides the feedback to support their active conjecturing and development of explanations.
Acknowledgment: Programming and revisions of Graphs ’n Glyphs, in Java, were expertly conducted by Mr. Pedro Larios. The design and research team takes this opportunity to express our gratitude for his friendship and his continuing enthusiastic support for education.
References
Borba, M. (1993). Students' understanding of transformations of functions using multi-representational software. Unpublished Ph.D. Diss., Cornell University, Ithaca, New York.
Clements, D. H., & Sarama, J. (2004). Learning trajectories in mathematics education.
Confrey, J. (2006). The evolution of design studies as methodology. In R. K. Sawyer (Ed.),
The Cambridge handbook of the learning sciences (pp. 135-152). New York: Cambridge University Press.
Confrey, J., Hoyles, C., Kahn, K., Maloney, A., Noss, R., Nguyen, K., et al. (in press). Designing software for mathematical engagement through modeling. In C. Hoyles & J.-B. Lagrange (Eds.), Technology revisited: The 17th ICMI study. New York: Springer.
Confrey, J., & Maloney, A. (1991). Function probe [software]. Santa Barbara, CA, U.S.A. Confrey, J., & Maloney, A. (2006). Graphs 'n Glyphs: Unpublished software.
Confrey, J., & Maloney, A. (2007). A theory of mathematical modelling in technological settings. In W. Blum, P. L. Galbraith, H.-W. Henn & M. Niss (Eds.), Modelling and applications in mathematics education: The 14th ICMI study. New York: Springer. Confrey, J., Maloney, A., & Nguyen, K. (2007, April 10). Integrating mathematics and
animation: Catching content instruction up with urban sixth graders’ interests and expertise. Paper presented at the Annual Meeting of the American Education Research Association, Chicago, IL.
COSEPUP. (2005). Rising above the gathering storm: Energizing and employing America for a brighter economic future. Washington, DC: National Academy Press.
Hart, K. (1988). Ratio and proportion. In J. Hiebert & M. J. Behr (Eds.), Number concepts and operations in the middle grades (pp. 198-219). Mahwah, NJ: Lawrence Erlbaum. Lamon, S. J. (1993). Ratio and proportion: Connecting content and children's thinking.
Journal for Research in Mathematics Education, 24(1), 41-61.
Latour, B. (1990). Drawing things together. In M. Lynch & S. Woolgar (Eds.), Representation in scientific practice. Cambridge, MA: MIT Press.
Lehrer, R., & Schauble, L. (2006). Cultivating model-based reasoning in science education. In R. K. Sawyer (Ed.), Cambridge handbook of the learning sciences (pp. 371-388). Cambridge: University Press.
Lehrer, R. L., Strom, D., & Confrey, J. (2002). Grounding metaphors and inscriptional resonance: Children's emerging understanding of mathematical similarity. Cognition and Instruction, 20(3), 359-398.
National Assessment of Educational Progress. (2005). The nation's report card: Mathematics 2005. Washington, DC: National Center for Educational Sciences.
Simon, M. (1995). Reconstructing mathematics pedagogy from a constructivist perspective.
Journal for Research in Mathematics Education, 26(2), 114-145.
Wilson, W. J. (1996). When work disappears: The world of the new urban poor. New York: Knopf.