195
Pooled-sample testing as a herd-screening tool for detection of
bovine viral diarrhea virus persistently infected cattle
Claudia A. Mun˜ oz-Zanzi, Wesley O. Johnson, Mark C. Thurmond, Sharon K. Hietala Abstract. The study was conducted to develop methodology for least-cost strategies for using polymerase chain reaction (PCR)/probe testing of pooled blood samples to identify animals in a herd persistently infected with bovine viral diarrhea virus (BVDV). Cost was estimated for 5 protocols using Monte Carlo simulations for herd prevalences of BVDV persistent infection (BVDV-PI) ranging from 0.5% to 3%, assuming a cost for a PCR/probe test of $20. The protocol associated with the least cost per cow involved an initial testing of pools followed by repooling and testing of positive pools. For a herd prevalence of 1%, the least cost per cow was $2.64 (95% prediction interval 5$1.72, $3.68), where pool sizes for the initial and repooled testing were 20 and 5 blood samples per pool, respectively. Optimization of the least cost for pooled-sample testing depended on how well a presumed prevalence of BVDV-PI approximated the true prevalence of BVDV infection in the herd. As prevalence increased beyond 3%, the least cost increased, thereby diminishing the competitive benefit of pooled testing. The protocols presented for sample pooling have general application to screening or sur-veillance using a sensitive diagnostic test to detect very low prevalence diseases or pathogens in flocks or herds.Bovine viral diarrhea virus (BVDV) infection has been described as one of the most important cattle dis-eases in America.4Cattle that are immunotolerant and persistently infected (PI) with the virus are believed to shed the virus for life and may be responsible for maintaining the infection in the herd by continued ex-posure of susceptible animals to the virus.14,15,25 An important element of BVDV control, therefore, is identification and removal of PI cattle from the herd.1,3 Unfortunately, the many diagnostic techniques avail-able to detect individual BVDV-infected cattle are costly, often making their application impractical for identifying PI cattle in large herds, especially when the prevalence of persistent infection can be expected to be as low as 1–2%.12,13Pooled testing to estimate prev-alence and to identify infected individuals has been proposed as a cost-efficient approach for diseases with low prevalence,8,11,24 including HIV, Chlamydia
tra-chomatis, and hepatitis B infections in hu-mans.2,6,7,9,10,16,18–20,26In veterinary diagnostic medicine, pooled testing has been used to identify Salmonella
enteritidis in eggs, Trichinella spiralis in pigs, and
hy-podermosis and bovine leukemia virus infection in cat-tle.5,17,22,23
Among diagnostic techniques available for detection of BVDV, polymerase chain reaction (PCR) is well
From the Department of Medicine and Epidemiology, School of Veterinary Medicine (Mun˜oz-Zanzi, Thurmond), and the Division of Statistics (Johnson), University of California, Davis, CA 95616, and the California Veterinary Diagnostic Laboratory System, Davis, CA 95616 (Hietala).
Received for publication December 14, 1998.
suited to pooled-sample testing based on the ability to detect very low levels of virus. Results can be obtained in a relatively short time, and according to preliminary validation, the technique has a very high diagnostic sensitivity and specificity. A critical step in designing a diagnostic approach involving pooling of samples is determining the procedure with the fewest number of tests required, thus with the lowest possible cost, to identify all animals persistently infected with BVDV (BVDV-PI animals) in a herd. If pool size is too large, there is an increased chance that any single pool will test positive, requiring additional testing to identify the 1 or 2 viremic individuals in the positive pool. If the samples are grouped in unnecessarily small pools, the cost benefit of pooling samples is lost to the large number of negative pools tested for each positive pool identified.
The objective of the present study was to identify and characterize testing protocols and corresponding optimal pool sizes that minimize the number of PCR tests required to identify all BVDV-PI cattle in a herd having prevalences of infection ranging from 0.5% to 3.0%.
Methods
The general approach taken was to estimate the cost as-sociated with 5 protocols applying different strategies of pooling samples, including splitting and repooling of posi-tive pools for various herd prevalences of BVDV-PI. The goal was to find the most cost-effective strategy for identi-fying BVDV-viremic animals, presumed to be PI, in a herd by comparing the least cost per cow obtained for different sample pooling protocols. The least cost was obtained by
finding the pool size that, on average, would require the fewest PCR tests to detect all BVDV-viremic cattle in a herd with a given prevalence of infection.
BVDV PCR/probe assay
BVDV genome was detected in whole blood samples us-ing previously published primer sequences.21During
devel-opment of the pooling procedure, single PI animals were detectable in pools of 200–250 negative samples. To de-crease the probability of false-negative results due to virus dilution in the pooling protocols, the maximum number of samples assigned to a pool was 80. For the purpose of pre-senting the pooling methodology in the simplest mathemat-ical form, sensitivity and specificity of BVDV PCR were assigned values of 100%.
Assumptions. The cost of one BVDV PCR/probe test, c,
was assigned $20, based on estimates of reagent cost and technician time for sample extraction, PCR, and detection by probe. The cost was considered to be the same whether the PCR and subsequent probe detection test was performed on a pool of samples or on an individual animal sample. The total cost of testing a herd was represented as Cherd, and the
cost of testing a pool as Cpool. The probability of disease,
Pr(D)5 p, was the true prevalence of BVDV viremia in the herd, evaluated at 0.5%, 1.0%, 1.5%, 2.0%, 2.5%, and 3.0% for each protocol. The total number of animals tested was represented as N, the number of samples per pool (pool size) as k, and the number of pools as r, where r5N/k, assuming
the quotient N/k is an integer. To simplify calculations, herd size was set at N5 1,000, and average cost per cow was calculated as E(Cherd)/N, where E(Cherd) is the expected cost
of testing the whole herd. Each pool was assumed to con-stitute a random sample, where each individual animal blood sample would have probability p of testing positive by BVDV PCR/probe. The number of positive samples in a pool was j, where 0#j#k. Because BVDV infection
prev-alence is typically expected to be no greater than 2%12,13and
samples are randomly allocated to pools, the probability of
.2 positive samples in a pool is negligible (,1310226). A
positive pool was assumed to have at least 1 viremic animal in the pool, and the probability that a pool would test posi-tive was the binomial probability, p512 (12 p)k, which
is a monotonically increasing function ofp; the higher the prevalence, the more likely a pool will test positive.
The maximum likelihood estimator for p is pˆ5 x/r (the
proportion of positive pools),26 where x is the number of
positive pools obtained from r tested pools, and x has a bi-nomial distribution (r, p). If a pool tested negative, it was assumed that none of the cows represented in the pool were viremic, which occurs with probability (12 p)k.
Estimation of cost. Total cost for identifying all individual
BVDV-infected animals in a herd was estimated by 2 ap-proaches; an analytic approach using probability theory, and another approach using Monte Carlo simulations. By prob-ability theory, the expected or ‘‘average’’ total herd cost is calculated as the number of initial pools tested multiplied by the expected or ‘‘average’’ cost per initial pool. The expected or ‘‘average’’ cost per initial pool is calculated as the cost per PCR/probe test multiplied by the ‘‘average’’ number of PCR/probe tests per initial pool. The ‘‘average’’ number of
PCR/probe tests per initial pool includes the first PCR/probe test of the pool plus the subsequent PCR/probe tests required to identify all infected animals in the initial pool. Total herd cost calculated by the analytic approach was used to validate costs obtained by the Monte Carlo simulations.
Monte Carlo simulations were generated to mimic the ac-tual pooled testing process of herds of size N, with a BVDV prevalence ofp, using r pools of size k. A computer program was written in S-Plusathat randomly selected r pools, each
of size k, from a binomial (k, p) distribution, which would mimic the random allocation in the laboratory of N samples to r pools of size k. (Computer programs written for Monte Carlo simulations are available upon request from C. Mu-n˜oz-Zanzi.) The total cost for each of the 7 protocols is ob-tained by applying the strategy of each testing protocol to the r pools generated. This procedure of randomly selecting
r pools was repeated 5,000 times, which would be equivalent
to testing a large number of herds with the same BVDV prevalence. The total cost obtained from each iteration would be similar to the actual selection of a herd and sub-sequent total cost calculation, and the collection of all 5,000 total costs should be distributed about the expected total cost obtained using probability theory. Simulations also provided a prediction interval for the total cost, where a 95% interval was the 2.5 and 97.5 percentiles of the total cost distribution. The 95% prediction interval corresponds to the range in which the total cost would fall 95% of the time and thus gives a range of costs that would be highly likely to occur in testing an actual herd.
Because true herd prevalence for any infectious agent is unknown and some presumption or educated guess of the prevalence is necessary to determine the least-cost pooling strategy, the effect on cost of differences between presumed and true prevalence was characterized. The effect on cost was described for a population of herds with the same true prevalence among all herds and for a population of herds where the prevalence of infection is concentrated at about 1% and the probability of herds with prevalences .3% is very small. The prevalence of the latter herd population was assumed to have a statistical distribution b(4.63, 360.6), which corresponds to a distribution of herds with a mode of 1% and a 99% certainty that the prevalence is,3%.
Strategies for testing
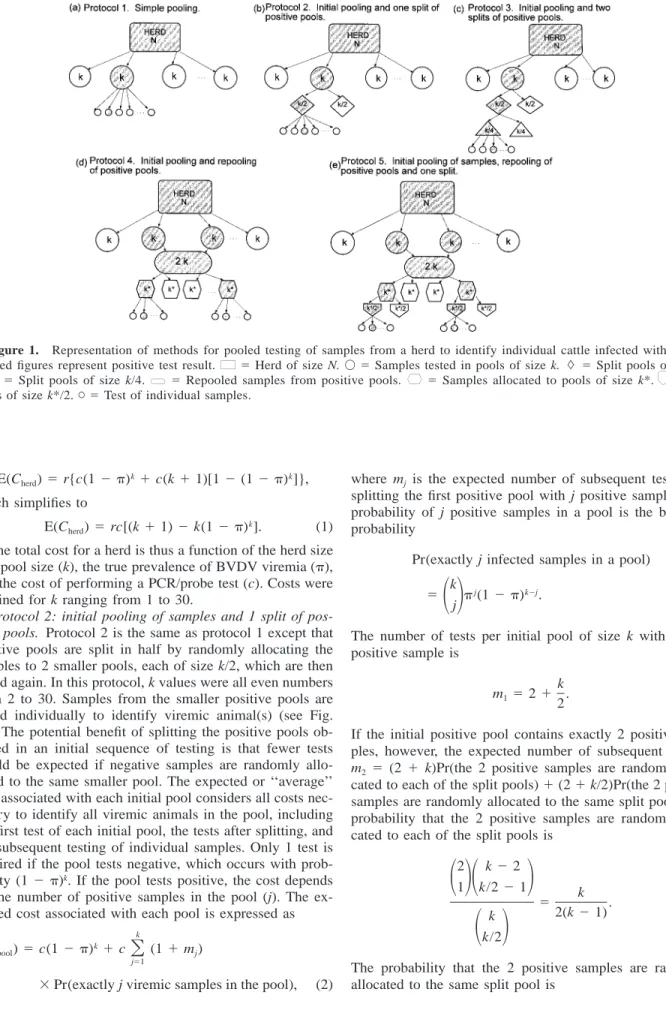
Protocol 1: simple pooling. The simplest method
evalu-ates the samples in pools of size k from a herd with preva-lence p. If the pool is PCR/probe positive, all the samples in the pool are tested individually to identify the viremic cow(s) (Fig. 1a). The total expected cost of pooled testing with this protocol, E(Cherd), is the product of the number of
initial pools (r) times the expected cost per pool, where E(Cpool) is the cost (c) times the expected number of tests.
As determined elsewhere,10the expected number of tests is
1 times the probability that the pool tests negative, (12 p)k,
plus the number of tests for a positive pool, (k1 1), times the probability that the pools test positive, [12 (1 2 p)k].
Therefore, the expected total cost for simple pooling is ex-pressed as
Figure 1. Representation of methods for pooled testing of samples from a herd to identify individual cattle infected with BVDV. Shaded figures represent positive test result.75Herd of size N.V5Samples tested in pools of size k.#5Split pools of size k/ 2.n5 Split pools of size k/4.9 5Repooled samples from positive pools. 85 Samples allocated to pools of size k*. *5Split pools of size k*/2.C5Test of individual samples.
k k
E(Cherd)5r{c(12 p) 1c(k11)[1 2(12 p) ]}, which simplifies to
k
E(Cherd)5rc[(k11) 2k(12 p) ]. (1) The total cost for a herd is thus a function of the herd size (N), pool size (k), the true prevalence of BVDV viremia (p), and the cost of performing a PCR/probe test (c). Costs were obtained for k ranging from 1 to 30.
Protocol 2: initial pooling of samples and 1 split of pos-itive pools. Protocol 2 is the same as protocol 1 except that
positive pools are split in half by randomly allocating the samples to 2 smaller pools, each of size k/2, which are then tested again. In this protocol, k values were all even numbers from 2 to 30. Samples from the smaller positive pools are tested individually to identify viremic animal(s) (see Fig. 1b). The potential benefit of splitting the positive pools ob-tained in an initial sequence of testing is that fewer tests would be expected if negative samples are randomly allo-cated to the same smaller pool. The expected or ‘‘average’’ cost associated with each initial pool considers all costs nec-essary to identify all viremic animals in the pool, including the first test of each initial pool, the tests after splitting, and the subsequent testing of individual samples. Only 1 test is required if the pool tests negative, which occurs with prob-ability (12 p)k. If the pool tests positive, the cost depends
on the number of positive samples in the pool (j). The ex-pected cost associated with each pool is expressed as
k k
E(Cpool)5c(12 p) 1c
O
(1 1m )j j513Pr(exactly j viremic samples in the pool), (2)
where mj is the expected number of subsequent tests after
splitting the first positive pool with j positive samples. The probability of j positive samples in a pool is the binomial probability
Pr(exactly j infected samples in a pool)
k
j k2j
5
1 2
p(12 p) . (3)j
The number of tests per initial pool of size k with only 1 positive sample is
k
m15 21 . (4)
2
If the initial positive pool contains exactly 2 positive sam-ples, however, the expected number of subsequent tests is
m2 5 (2 1 k)Pr(the 2 positive samples are randomly
allo-cated to each of the split pools)1(21k/2)Pr(the 2 positive
samples are randomly allocated to the same split pool). The probability that the 2 positive samples are randomly allo-cated to each of the split pools is
2 k22
1 21
1 k/2212
k 5 . 2(k21) k1 2
k/2The probability that the 2 positive samples are randomly allocated to the same split pool is
2 k22
1 21
2 k/2222
k22 k 2 5 5 12 . 2(k21) 2(k21) k1 2
k/2 Therefore, k k 1 k22 m25 (21k) 11 2 1 2
21 2(k21) 2 2 k 21 1 3 3 2 51
k 1 k2 2 .2
(5) (k21) 4 2Because the probability of j5 3 or more positive samples in a pool would be very small for smallp(for example, the probability of j53 in a pool of size k520 for a prevalence ofp 53% is 2.37310228), we approximated the expected
cost of a pool, E(Cpool), as
k k k21 E(Cpool)8c (1
[
2 p) 1(11m )11 2
p(1 2 p) 1 k 2 k22 1(1 1m )21 2
p (12 p)]
. (6) 2The expected total cost of testing the herd, E(Cherd), is the
number of initial pools (r) times the expected cost associated with each initial pool, which is rE(Cpool).
Protocol 3: initial pooling of samples and 2 splits of pos-itive pools. This protocol extends the approach of protocol
2 by including a subsequent split of positive pools identified after a first split. Initial testing is done on pools of size k, which correspond to all multiples of 4 from 4 to 28. If a pool tests positive, the pool is split into 2 pools of size k/2. A positive split pool is split again to form 2 pools of size
k/4, and samples of positive pools obtained at this step are
tested individually to identify infected cow(s) (see Fig. 1c). The expected cost per initial pool, E(Cpool), with 2
subse-quent splits of positive pools is approximated as
k k k21 E(Cpool)8c (1
[
2 p) 1(31m )11 2
p(1 2 p) 1 k 2 k22 1(3 1m )21 2
p (12 p)]
, (7) 2provided thatpis small, where the expected number of tests for a positive pool is the sum of the first 3 tests plus the expected number of tests after the first split. For 1 positive sample in a pool, the expected number of tests after the first split of pools is
k
m152 1 . (8)
4
The expected number of tests per initial positive pool with exactly 2 positive samples is m25(41k/2)Pr(the 2 positive
samples are randomly allocated to each of the split pools at the first split)1 (21k/4)Pr(the 2 positive samples are
ran-domly allocated to the same split pool at the first and second split) 1 (2 1 k/2)Pr(the 2 positive samples are randomly
allocated to the same split pool at the first split and to each
of the split pools at the second split). The probability that the 2 positive samples are randomly allocated to each of the split pools at the first split is k/2(k21). The probability that the 2 positive samples are randomly allocated to the same split pool at the first split is
2 k22
1 21
2 k/2222
(k22) 2 5 . 2(k21) k1 2
k/2The probability that 2 positive samples are randomly allo-cated to the same split pool at the second split is
2 k/222
1 21
2 k/4222
(k24) 2 5 . 2(k22) k/21 2
k/4The probability that the 2 positive samples are randomly allocated to each of the split pools at the second split is
2 k/222
1 21
1 k/4212
k 5 . 2(k22) k/21 2
k/4 Therefore, k k m2 51 2
41[
]
2 2(k21) k k2 2 k24 11 2
2 1[
][
]
4 2(k21) 2(k 22) k k22 k 11 2
2 1[
][
]
, 2 2(k2 1) 2(k22) which simplifies to 1 7 11 2 m251
k 1 k22 .2
(9) (k2 1) 16 4The expected total cost of testing the herd will be the number of pools times the expected cost per pool, which is rE(Cpool). Protocol 4: initial pooling of samples and repooling of positive pools. As with the other protocols, pools of size k
from a herd with prevalence pare tested initially in a first stage to identify positive pools. Protocol 4 incorporates a second stage in which samples from the positive pools are randomly allocated to new pools of the same or smaller size than the first stage pools, where second stage pool size is
k*. The new pools are tested, and the individual samples
comprising the positive pools are tested to identify viremic cows (see Fig. 1d). The expected total cost for this method of pooled testing, using probability theory, is mathematically intractable because of the numerous different pathways pos-itive samples could follow. To avoid complex analytic cal-culations, the total expected cost for various prevalences and combinations of first and second stage pool sizes were
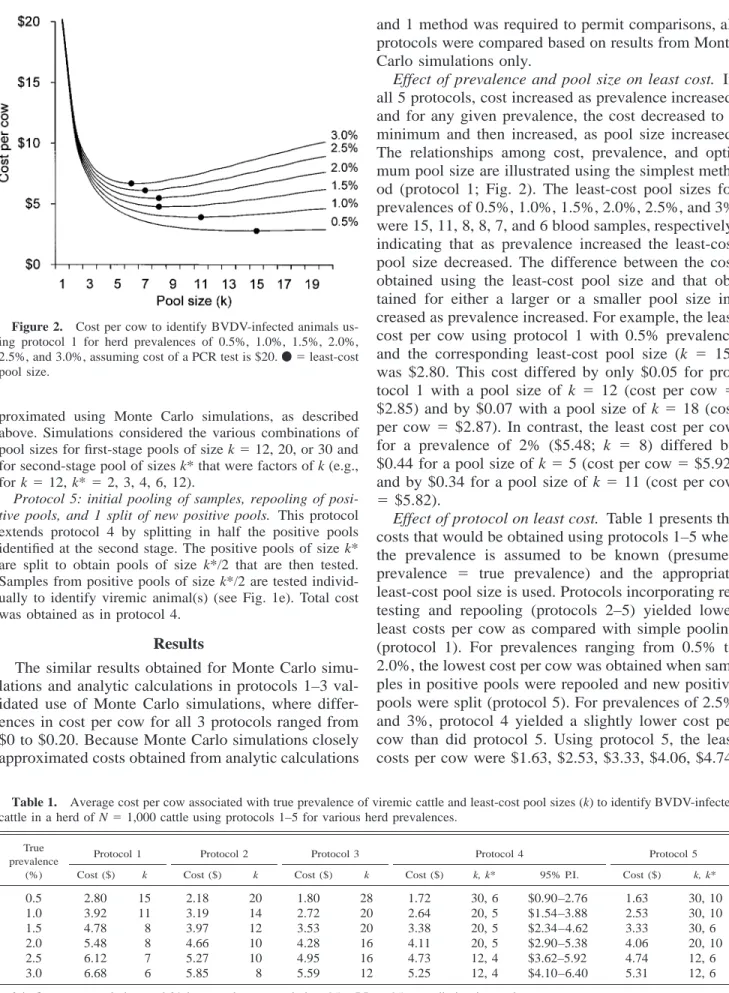
ap-Figure 2. Cost per cow to identify BVDV-infected animals us-ing protocol 1 for herd prevalences of 0.5%, 1.0%, 1.5%, 2.0%, 2.5%, and 3.0%, assuming cost of a PCR test is $20.v5least-cost pool size.
Table 1. Average cost per cow associated with true prevalence of viremic cattle and least-cost pool sizes (k) to identify BVDV-infected cattle in a herd of N51,000 cattle using protocols 1–5 for various herd prevalences.
True prevalence (%) Protocol 1 Cost ($) k Protocol 2 Cost ($) k Protocol 3 Cost ($) k Protocol 4 Cost ($) k, k* 95% P.I. Protocol 5 Cost ($) k, k* 0.5 2.80 15 2.18 20 1.80 28 1.72 30, 6 $0.90–2.76 1.63 30, 10 1.0 3.92 11 3.19 14 2.72 20 2.64 20, 5 $1.54–3.88 2.53 30, 10 1.5 4.78 8 3.97 12 3.53 20 3.38 20, 5 $2.34–4.62 3.33 30, 6 2.0 5.48 8 4.66 10 4.28 16 4.11 20, 5 $2.90–5.38 4.06 20, 10 2.5 6.12 7 5.27 10 4.95 16 4.73 12, 4 $3.62–5.92 4.74 12, 6 3.0 6.68 6 5.85 8 5.59 12 5.25 12, 4 $4.10–6.40 5.31 12, 6
k is first stage pool size, and k* is second stage pool size. 95% P.I.595% prediction interval.
proximated using Monte Carlo simulations, as described above. Simulations considered the various combinations of pool sizes for first-stage pools of size k512, 20, or 30 and for second-stage pool of sizes k* that were factors of k (e.g., for k512, k* 52, 3, 4, 6, 12).
Protocol 5: initial pooling of samples, repooling of posi-tive pools, and 1 split of new posiposi-tive pools. This protocol
extends protocol 4 by splitting in half the positive pools identified at the second stage. The positive pools of size k* are split to obtain pools of size k*/2 that are then tested. Samples from positive pools of size k*/2 are tested individ-ually to identify viremic animal(s) (see Fig. 1e). Total cost was obtained as in protocol 4.
Results
The similar results obtained for Monte Carlo simu-lations and analytic calcusimu-lations in protocols 1–3 val-idated use of Monte Carlo simulations, where differ-ences in cost per cow for all 3 protocols ranged from $0 to $0.20. Because Monte Carlo simulations closely approximated costs obtained from analytic calculations
and 1 method was required to permit comparisons, all protocols were compared based on results from Monte Carlo simulations only.
Effect of prevalence and pool size on least cost. In
all 5 protocols, cost increased as prevalence increased, and for any given prevalence, the cost decreased to a minimum and then increased, as pool size increased. The relationships among cost, prevalence, and opti-mum pool size are illustrated using the simplest meth-od (protocol 1; Fig. 2). The least-cost pool sizes for prevalences of 0.5%, 1.0%, 1.5%, 2.0%, 2.5%, and 3% were 15, 11, 8, 8, 7, and 6 blood samples, respectively, indicating that as prevalence increased the least-cost pool size decreased. The difference between the cost obtained using the least-cost pool size and that ob-tained for either a larger or a smaller pool size in-creased as prevalence inin-creased. For example, the least cost per cow using protocol 1 with 0.5% prevalence and the corresponding least-cost pool size (k 5 15) was $2.80. This cost differed by only $0.05 for pro-tocol 1 with a pool size of k 5 12 (cost per cow 5 $2.85) and by $0.07 with a pool size of k 5 18 (cost per cow 5 $2.87). In contrast, the least cost per cow for a prevalence of 2% ($5.48; k 5 8) differed by $0.44 for a pool size of k5 5 (cost per cow5 $5.92) and by $0.34 for a pool size of k5 11 (cost per cow 5 $5.82).
Effect of protocol on least cost. Table 1 presents the
costs that would be obtained using protocols 1–5 when the prevalence is assumed to be known (presumed prevalence 5 true prevalence) and the appropriate least-cost pool size is used. Protocols incorporating re-testing and repooling (protocols 2–5) yielded lower least costs per cow as compared with simple pooling (protocol 1). For prevalences ranging from 0.5% to 2.0%, the lowest cost per cow was obtained when sam-ples in positive pools were repooled and new positive pools were split (protocol 5). For prevalences of 2.5% and 3%, protocol 4 yielded a slightly lower cost per cow than did protocol 5. Using protocol 5, the least costs per cow were $1.63, $2.53, $3.33, $4.06, $4.74,
Table 2. Effect on cost per cow ($) of differences between the presumed and true prevalence of BVDV-infected cattle for true prevalences of 0.5% and 3.0% using protocols 1–5.
Presumed prevalence (%) True prevalence50.5% 1 2 3 4 5 True prevalence53% 1 2 3 4 5 0.5 2.80 2.17 1.80 1.72 1.63 8.71 7.17 6.42 5.78 5.67 1.0 2.90 2.33 1.88 1.84 1.63 7.52 6.30 5.78 5.46 5.67 1.5 3.29 2.48 1.88 1.84 1.66 6.82 6.07 5.78 5.46 5.54 2.0 3.29 2.69 2.05 1.84 2.07 6.82 5.87 5.62 5.46 5.45 2.5 3.55 2.69 2.05 2.33 2.33 6.70 5.87 5.62 5.25 5.31 3.0 3.93 3.10 2.38 2.33 2.33 6.68 5.87 5.59 5.25 5.31
Table 3. Effect of differences between presumed and true prevalence of BVDV-infected cattle on cost per cow* using protocol 4.
Presumed prevalence (%) k, k*† True prevalence (%) 0.5 1.0 1.5 2.0 2.5 3.0 0.5 30, 6 $1.72 $2.69 $3.58 $4.40 $5.20 $5.78 ($0.90, $2.66) ($1.56, $3.90) ($2.32, $4.92) ($3.00, $5.92) ($3.68, $6.80) ($4.12, $7.34) 1.0–2.0 20, 5 $1.84 $2.64 $3.38 $4.11 $4.82 $5.46 ($1.18, $2.62) ($1.72, $3.68) ($2.34, $4.54) ($2.88, $5.42) ($3.52, $6.20) ($4.04, $6.92) 2.5–3.0 12, 4 $2.33 $2.97 $3.58 $4.19 $4.73 $5.25 ($1.82, $2.94) ($2.24, $3.78) ($2.72, $4.56) ($3.20, $5.30) ($3.62, $5.92) ($4.10, $6.40)
* Values are mean cost per cow (95% prediction interval). † k is first stage pool size, and k* is second stage pool size.
and $5.31 for prevalences of 0.5%, 1.0%, 1.5%, 2.0%, 2.5%, and 3.0%, respectively. The costs per cow using protocol 4 for prevalences of 2.5% and 3% were $4.73 and $5.25, respectively. As prevalence was increased beyond 3%, the least costs per cow and 95% prediction intervals obtained for protocol 4 were $5.93 ($4.66– $7.26), $6.40 ($5.10–$7.78), $6.92 ($5.58–$8.30), $7.43 ($6.02–$8.88), $7.91 ($6.48–$9.40), and $8.40 ($6.94–$9.88) for prevalences of 3.5%, 4.0%, 4.5%, 5.0%, 5.5%, and 6.0%, respectively. The correspond-ing 95% prediction intervals for costs per cow, uscorrespond-ing protocols 1–5, for any given prevalence showed sim-ilar variation around the mean cost. The average dif-ference between the mean and lower and upper limits over all prevalences and pool sizes was $1.14.
Effect of selection of pool size on variation in cost.
Two situations were examined to determine pool size to be used and the associated variation in cost: one that used the least-cost pool size for a presumed herd prevalence of infection and, consequently, considered the variation in cost when presumed prevalence dif-fered from true prevalence and the other that used 1 pool size for all herds regardless of prevalence. Use of protocols 1–5 involves making presumptions of herd prevalence, where these presumptions may be correct as assumed above or not. The average cost per cow, if the true prevalence was higher than the pre-sumed prevalence, was more than the expected cost for a correctly presumed prevalence. Conversely, the
average cost per cow, if the true prevalence was less than the presumed prevalence, was less than the cost based on a correctly presumed prevalence. For proto-cols 1–5, protoproto-cols 4 and 5 yielded the lowest average costs when presumed prevalences were lower or higher than true prevalences (Table 2). The effect of differ-ences between presumed and true prevalence was also examined considering the variation around the average costs, as illustrated by the 95% prediction intervals in Table 3. For example, for a herd tested using protocol 4 with a presumed prevalence of 1.0%, the range of possible costs, according to the 95% prediction inter-val, was from $1.72 to $3.68 if the presumed preva-lence was correct (true prevapreva-lence51.0%). However, if presumed prevalence was 1.0% and true prevalence of the herd was 2.0% or 3.0%, the cost was as high as $5.42 or $6.92, respectively (Table 3).
The second situation examined involved no pre-sumption of herd prevalence, and fixed pool size was used for all herds. For a population of herds tested using protocol 4, where herd prevalences were distributed assuming a beta distribution, as previously described (1% mode and 99% certainty that prevalence is,3%), the fixed pool size that yielded the lowest average cost per cow was k 5 20 and k* 5 5, with average cost per cow of $3.02 and 95% prediction limit of $1.36– $5.36. The fixed pool size that yielded the lowest up-per prediction limit however was k5 12 and k* 5 4, with average cost per cow of $3.28 and 95% prediction
limits of $1.96–$5.18. Use of a fixed pool size was associated with less general uncertainty about the rang-es of possible costs, as indicated by the generally low-er upplow-er prediction limits as compared with the upplow-er prediction limits associated with an incorrectly pre-sumed prevalence (Table 3).
Discussion
The protocols for pooled-sample testing presented here show how pooling strategies, using a sensitive diagnostic test such as PCR/probe, could offer a com-petitive and cost-effective diagnostic alternative for identification of BVDV-infected cattle. A pooling ap-proach is expected to identify viremic animals at costs that are likely to be lower than those incurred by test-ing individual animals. As prevalence increases be-yond 3%, however, the competitive benefit of pooled-sample testing would be expected to diminish. Using protocol 4, which generally yielded the lowest costs, the average cost would increase substantially with in-creased prevalence ($5.25 for a true prevalence of 3% to $8.40 for a true prevalence of 6%), which would make the cost of pooled-testing comparable to that of alternative assays, with anticipated cost per sample possibly as low as $8.00. Although prevalences above 3% do not seem likely when testing an entire herd for BVDV-PI, the higher costs of pooled testing for higher prevalences indicate that pooling from high-risk ani-mal groups or use of pooling for routine diagnosis of clinical samples would not be expected to be cost ef-fective because of the high probability of infection (prevalence) for these type of samples.
Comparison of the cost per cow for protocols 1–5 using the least-cost pool size for a given true preva-lence showed that the protocol that included repooled and split positive pools (protocol 5) yielded the lowest average cost per cow for prevalences between 0.5% and 2.0%, whereas repooling with no split (protocol 4) yielded the lowest average cost per cow for prev-alences of 2.5% and 3%. The differences between the least average costs per cow for the 2 protocols, how-ever, were small. For a 1.0% prevalence, the least av-erage cost per cow for protocol 4 ($2.61) was only $0.08 more than that from protocol 5 ($2.53). Protocol 4 may be preferred, therefore, even for prevalences ,2.5% because protocol 4 would involve less labo-ratory handling of blood samples and would be ex-pected to produce final results in a shorter time period that would protocol 5.
Once a protocol is chosen, knowledge of the most probable herd prevalence of infection is required to take full advantage of the pooled testing method and to obtain the lowest possible cost. If the presumed prevalence is higher (lower) than the true prevalence, the respective average costs anticipated as if the
pre-sumed prevalence were true would be lower (higher) than the actual costs associated with the true preva-lence. As the difference between presumed and true prevalence increases, the difference between the antic-ipated average cost for the presumed prevalence and the actual average cost increases. Although use of a presumed prevalence that differs from the true preva-lence would not take full advantage of the lower cost of pooled testing, the average costs per cow incurred could still be lower than costs for individual testing. For example, in the extreme case examined here, if the presumed prevalence was 0.5% and the true preva-lence was 3%, the average cost per cow using protocol 4 would be $5.78 (Table 3), which may still be lower than individual animal testing with other diagnostic assays.
Factors to consider in establishing an appropriate diagnostic laboratory fee for pooled-sample testing in-clude the degree of certainty about prevalence and the margin of error between the fee charged and the actual cost that could be observed. The difficulty in deter-mining a standard fee when testing is performed using a presumption of the prevalence is the potential for an incorrectly presumed prevalence and random variation in cost from herd to herd. One option for determining a fee that considers these variations could be to use the highest probable cost. Using protocol 4, such a fee would be $7.34, which corresponds to the upper 95% prediction limit of the cost for a presumed prevalence of 0.5% and a true prevalence of 3.0% (Table 3) and would exceed laboratory costs most of the time. An-other option would be to use a standard fee that would cover the costs for testing using a fixed pool size, re-gardless of prevalence. Testing all herds using protocol 4 with fixed pool sizes of k 5 12 and k* 5 4 and assuming the b distribution described would yield a distribution of costs with a mean of $3.28 and lower and upper limits of $1.96 and $5.18. A fee of $3.28 would exceed the actual laboratory costs half of the time but would be lower the rest of the time, as op-posed to a fee of $5.18, for example, which would exceed the actual observed costs 97.5% of the time. Advantages of this option would be the simplicity in-herent in using the same pool size for all testing (as opposed to changing pool size for each herd situation) and the reduced uncertainty in the range of possible costs.
Under field conditions, the cost per cow would dif-fer from the estimates obtained here if infected animals were not randomly allocated to pools, as was assumed. Lack of random allocation might occur if infected an-imals are tested in some order based on a factor or attribute that is associated with infection, resulting in a subsequent clustering of positive samples in a few pools. For example, if for some reason heifers tended
to have a higher prevalence than cows and blood sam-ples were collected and tested using groups of heifers and of cows, estimated costs per animal and 95% pre-diction intervals would no longer be valid because positive pools from the heifers would have more pos-itive samples and pospos-itive pools from cows would have fewer positive samples than expected for a ran-dom allocation. Knowledge of differences in the prev-alence of infection according to such attributes or cov-ariates as age or previous exposure could be used to further refine methods proposed here and to improve the least-cost estimates. For example, samples of ani-mals from each group having different presumed prev-alences could be pooled according to the optimal pool size for their corresponding prevalences.
Pooled testing of blood samples obtained at 1 point in time would identify viremic cattle, which likely rep-resent persistent infection, but may include acute field infection or recent vaccination with modified live vac-cine. To confirm BVDV-PI animals, as with other di-agnostic assays for PI, a second positive sample taken 2–3 weeks later would be necessary; such costs were not considered in the pooling costs reported here. Also, sensitivity and specificity of PCR will likely not be perfect, resulting in some probably low level of mis-classification, either false-negative or false-positive re-sults. In preliminary evaluation of the PCR used in this study, 35 animals identified as PI were tested by PCR and virus isolation. Thirty-four of the 35 were positive by both PCR and virus isolation, providing a PCR sensitivity of 100% if virus isolation is consid-ered the gold standard. Samples provided from 1 cow maintained in a research herdb were negative by both PCR and virus isolation, providing a sensitivity of 97%, assuming the cow was PI and an intermittent shedder of virus. All individual samples positive by PCR were also detected using the pooling protocol de-scribed. Documentation of the sensitivity and specific-ity of PCR for detecting BVDV-PI based on a larger number of individual animals and sample pools is on-going. In evaluating the ultimate cost effectiveness of pooling methodologies, the implication of imperfect sensitivity and specificity should be considered.
The pooling methods described here for BVDV di-agnosis have general and broad applications to veter-inary diagnostics. Although new diagnostic technology such as PCR is known for its extremely high detection limits, the cost has precluded routine use, especially for screening or surveillance. Use of these methods would permit large-scale use of the diagnostic power of the PCR, particularly under conditions of very low prevalence where cost of individual animal testing with conventional assays would be prohibitive. The use of pooling procedures has practical implications, not only to reduce laboratory and user costs but also
to permit surveillance of populations for specific agents. Pooled-sample testing lends itself to screening and monitoring flocks or herds for low prevalence agents, as may be of interest in preharvest food safety programs, foreign animal disease surveillance, and herd or flock certification programs.
Acknowledgements
This work was supported in part by funds provided by the US Department of Agriculture (Regional Research Project W-112 and Formula Funds), by a National Research Initia-tive CompetiInitia-tive Award (98-35204-6390), by a block grant from the Graduate Group in Epidemiology, University of California, Davis, and by the American Association of Uni-versity Women.
Sources and manufacturers
a. S-plus 4.5 MathSoft, Seattle, WA.
b. Ronald D. Schultz, University of Wisconsin. Madison, WI.
References
1. Ames T, Baker J: 1990, Management practices and vaccination programs that help control BVD virus infection. Vet Med 85: 1140–1149.
2. Behets F, Bertozzi S, Kasali M, et al.: 1990, Successful use of pooled sera to determine HIV-1 seroprevalence in Zaire with development of cost-efficiency models. AIDS 4:737–741. 3. Bitsch V, Ronsholt L: 1995, Control of bovine viral diarrhea
virus infection without vaccines. Vet Clin North Am Food Anim Pract 11:627–640.
4. Bolin S, Ames I: 1996, Vaccination for bovine viral diarrhea virus. Proc Int Symp Bovine Vir Diarrhea Vir 1996:16–17. 5. Boulard C, Villejoubert C: 1991, Use of pooled serum or milk
samples for the epidemiological surveillance of bovine hypo-dermosis. Vet Parasitol 39:171–183.
6. Cahoon-Young B, Chandler A, Livermore T, et al.: 1989, Sen-sitivity and specificity of pooled versus individual sera in a hu-man immunodeficiency virus antibody prevalence study. J Clin Microbiol 27:1893–1895.
7. Cunningham R, Northwood JL, Kelly CD, et al.: 1998, Routine antenatal screening for hepatitis B using pooled sera: validation and review of 10 years experience. J Clin Pathol 51:392–395. 8. Dorfman R: 1943, The detection of defective members of large
populations. Ann Math Stat 14:436–440.
9. Emmanuel J, Bassett M, Smith H, Jacobs J: 1988, Pooling of sera for human immunodeficiency virus (HIV) testing: an eco-nomical method for use in developing countries. J Clin Pathol 41:582–585.
10. Gastwirth J, Johnson W: 1994, Screening with cost-effective quality control—potential applications on HIV and drug testing. J Am Stat Assoc 89:972–981.
11. Geisser S, Johnson W: 1992, Optimal administration of dual screening tests for detecting a characteristic with special refer-ence to low prevalrefer-ence diseases. Biometrics 48:839–852. 12. Houe H, Baker J, Maes R, et al.: 1995, Prevalence of cattle
persistently infected with bovine viral diarrhea virus in 20 dairy herds in 2 counties in central Michigan and comparison of prev-alence of antibody-positive cattle among herds with different infection and vaccination status. J Vet Diagn Invest 7:321–326. 13. Houe H, Meyling A: 1991, Prevalence of bovine virus diarrhea (BVD) in 19 Danish dairy herds and estimation of incidence of infection in early pregnancy. Prev Vet Med 11:9–16.
14. Houe H, Palfi V: 1993, Estimation of herd incidence of infection with bovine virus diarrhoea virus (BVDV) in herds previously without animals persistently infected with BVDV. Acta Vet Scand 34:133–137.
15. Innocent G, Morrison I, Brownlie J, Gettinby G: 1997, The use of a mass-action model to validate the output from a stochastic simulation model of bovine viral diarrhoea virus spread in a closed dairy herd. Prev Vet Med 31:199–209.
16. Kacena K, Quinn S, Howell M, Madico G: 1998, Pooling urine samples for ligase chain reaction screening for genital
Chla-mydia trachomatis infection in asymptomatic women. J Clin
Microbiol 36:481–485.
17. Kinde H: 1996, Salmonella enteritidis phage 4 infection in a commercial layer flock in southern California. Avian Dis 40: 665–671.
18. Kline R, Brothers T, Brookmeyer R, et al.: 1989, Evaluation of human immunodeficiency virus (HIV) seroprevalence in popu-lation surveys using pooled sera. J Clin Microbiol 27:1449– 1452.
19. Litvak E, Tu X, Pagano M: 1994, Screening for the presence of HIV by pooling sera samples: simplified procedures. In: Mod-eling the AIDS epidemic, ed. Kaplan E, Brandew M, pp. 137– 152. Karen Press, New York, NY.
20. Peeling R, Toye B, Jessamine P, Gemmill I: 1998, Pooling of urine specimens for PCR testing: a cost saving strategy for
Chlamydia trachomatis control programmes. Sex Transm Infect
74:66–70.
21. Ridpath J, Bolin S, Dubovi E: 1994, Segregation of bovine viral diarrhea virus into genotypes. Virology 205:66–74.
22. Rodake L, Granatova M, Vesely T, Nevorankova Z: 1997, Monoclonal antibody for the demonstration by ELISA of anti-bodies to protein p24 of enzootic bovine leukosis virus in in-dividual and pooled blood serum and milk samples. J Vet Med B 44:425–436.
23. Sachs J, Bolin S, Crowder S: 1989, Prevalence estimation from pooled samples. Am J Vet Res 50:205–206.
24. Sobel M, Groll P: 1959, Group testing to eliminate efficiently all defectives in a binomial sample. Bell Syst Technol J 38: 1179–1252.
25. Thibault J, Crevat D, Chappuis G: 1993, Control of bovine virus diarrhoea–mucosal disease in cattle: examples of the combined use of serological screening, viral antigen detection and vacci-nation. Rev Sci Tech Off Int Epizoot 12:471–481.
26. Tu XM, Litvak E, Pagano M: 1994, Studies of AIDS and HIV surveillance. Screening tests: can we get more by doing less? Stat Med 13:1905–1919.