South Dakota State University
Open PRAIRIE: Open Public Research Access Institutional
Repository and Information Exchange
South Dakota Beef Report, 2015
Animal Science Field Day Proceedings and
Research Reports
2015
SDSU Calf Value Discovery 2013/2014 Summary
Report
J.A. Walker
South Dakota State University
W.C. Rusche
South Dakota State University
Follow this and additional works at:
http://openprairie.sdstate.edu/sd_beefreport_2015
Part of the
Animal Sciences Commons
This Report is brought to you for free and open access by the Animal Science Field Day Proceedings and Research Reports at Open PRAIRIE: Open Public Research Access Institutional Repository and Information Exchange. It has been accepted for inclusion in South Dakota Beef Report, 2015 by an authorized administrator of Open PRAIRIE: Open Public Research Access Institutional Repository and Information Exchange. For more information, please [email protected].
Recommended Citation
Walker, J.A. and Rusche, W.C., "SDSU Calf Value Discovery 2013/2014 Summary Report" (2015).South Dakota Beef Report, 2015. Paper 12.
BEEF 2015-11
SDSU Calf Value Discovery 2013/2014 Summary Report1
J. A. Walker and W. C. Rusche
Department of Animal Science, South Dakota State University
SUMMARY
The Calf Value Discovery Program (CVD) allows cow‐calf producers to gain knowledge of the finishing segment of the beef cattle industry and the marketing of fed cattle. Specifically, CVD provides an
opportunity for cow‐calf producers to learn how their calves perform in a feedlot and their carcass value when sold in a value‐based marketing system. Each producer taking part in the program could consign 5 or more steers weighing between 500 and 800 pounds to the CVD program. Animals were finished at VanderWal Yards (Bruce, SD) in a calf‐fed program using typical diets and management protocols. Carcass and feedlot performance information from calves were returned to producers for use in making future management decisions to improve profitability.
MATERIALS AND METHODS
Seven cow‐calf operations in South Dakota and Minnesota consigned calves to the 2013‐2014 CVD program. The number of animals consigned by producers ranged from 7 to 74. Calves were received on November 6 and 7, 2013. Upon receipt, calves were vaccinated against viral and bacterial respiratory (Bovi‐Shield Gold BVD, Inforce 3, One‐Shot, Zoetis, Florham Park, NJ) and clostridial pathogens.
For each animal, individual BW was recorded at arrival at the feedyard, on d 37, d 106, and on the day of shipment to harvest. A pencil shrink factor of 4% was applied to all weights. Since cattle were fed in a single pen, individual feed intake was calculated based on animal performance and diet energy content using NRC (2000) equations. At harvest, individual identification was tracked through the plant and individual carcass camera data, including hot carcass weight (HCW), 12th‐rib fat thickness, ribeye area, percent kidney, pelvic, and heart fat (KPH), marbling score, and USDA Quality and Yield Grades, were reported by the plant.
Feeding expenses included feed costs, which were based on calculated individual intake as a fraction of actual feed delivery, yardage ($0.38 per animal per day), and veterinary expenses.
To estimate initial feeder calf values, weighted average feeder steer prices were obtained from the South Dakota Auction Market Summary report (USDA Agricultural Market Service report SF_LS795) for the two week surrounding November 6 and 7, 2013. These prices were regressed on selling weights. Using that equation and the actual weight at arrival, the estimated initial value of each calf was determined.
1 Project supported by registration fees paid by participants. Mention of a proprietary product does not constitute
a guarantee or warranty of the product by South Dakota State University of the authors and does not imply its approval to the exclusion of other products that may also be suitable.
57
Actual prices received were used to calculate carcass value and feeding period profitability for the grid based marketing method. To estimate what factors were associated with feeding performance or profit and quality grade for calves that finished the 2013‐2014 CVD program, calves were divided into thirds based on net profit from the feeding period. Profit or loss for this analysis was determined by
subtracting feeding expenses and the estimated initial calf value from the actual carcass value received. A general linear model was used to separate means between groups (PROC GLM, SAS Inst. Inc., Cary, NC). The association of USDA Quality Grade among profit groups was determined by χ2 (PROC FREQ, SAS). Means were considered different when P ≤ 0.05.
RESULTS AND DISCUSSION
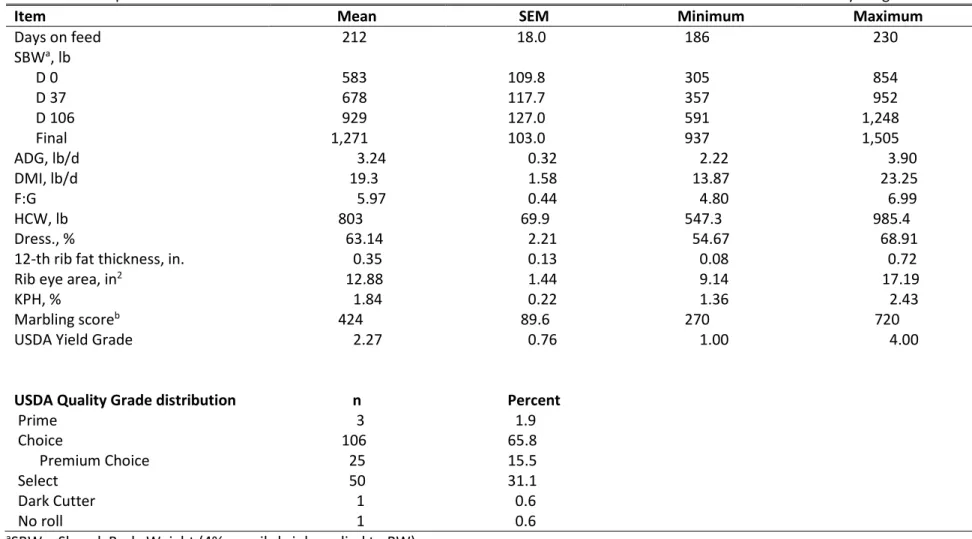
Two calves died and one calf (1.86%) was removed from the program due to chronic health issues and their data were excluded from the analysis. Overall cattle performance data is presented in Table 1. Calves were placed with an average weight of 583 ± 109.8 lbs. Some calves were accepted into the program whose initial weights were outside the recommended range of 500 to 800 pounds. Average final BW for steers (average DOF = 212) was 1,271 ± 103.0 lb, and ADG was 3.24 lb/d. Averages for daily dry matter intake (DMI) and F:G ratio were 19.3 lb and 5.97, respectively. On average, steers were harvested at slightly less than the target fat thickness (0.4 in).
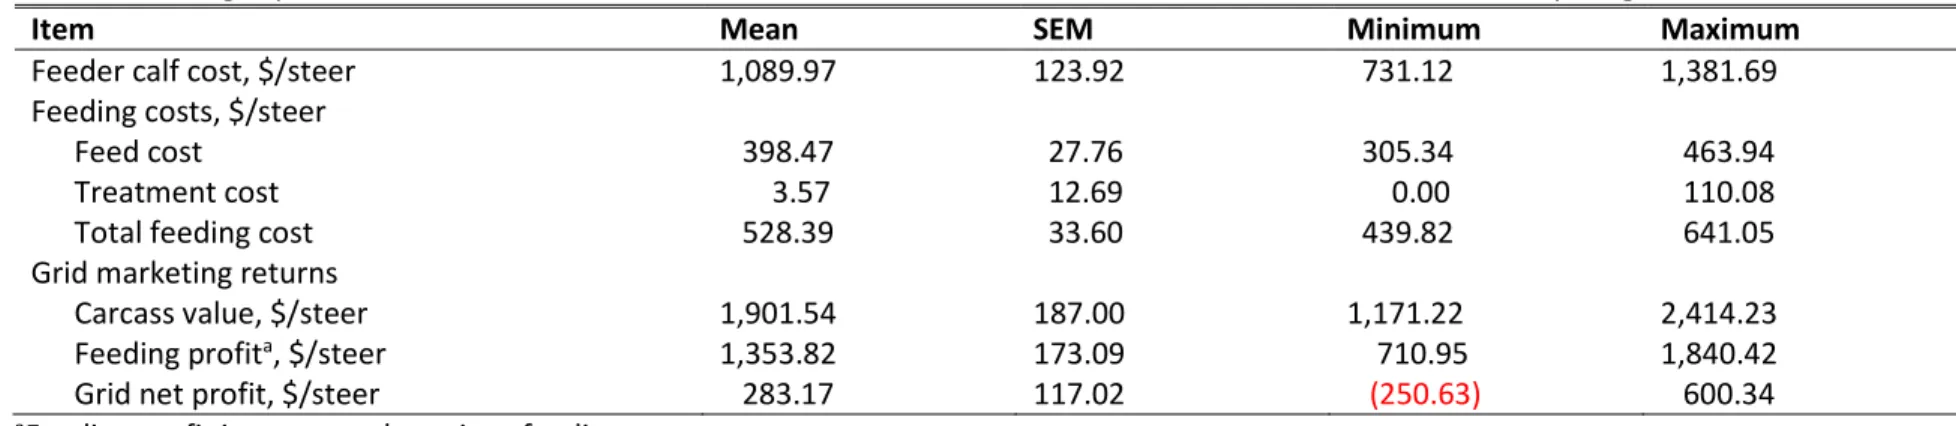
Expenses and returns are summarized in Table 2. On average, feeding costs were $528.39 per animal. When carcasses were sold on a grid basis, carcass value ranged from $1,171.22 to $2,414.23. Had the carcasses been sold on a dressed basis this range would have been smaller ($1,302.57 to $2,364.96). When including the initial value of the feeder calf, individual returns ranged from a loss of $250.63 to a profit of $600.34. Average return was $283.17 per steer.
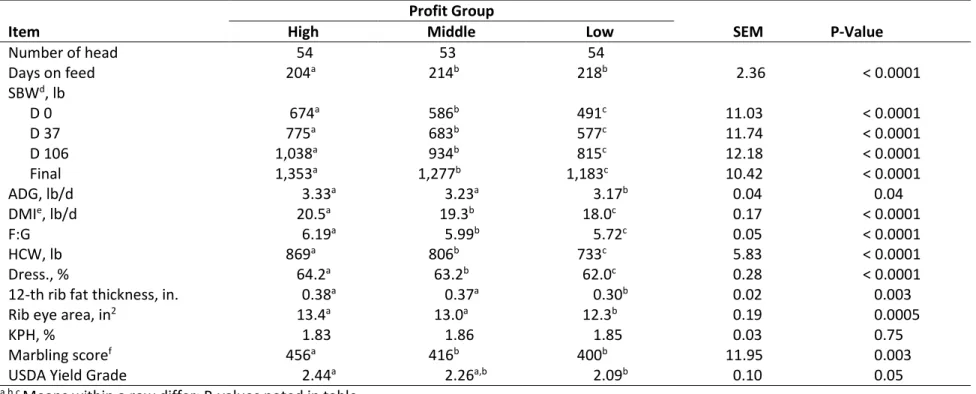
In Table 3, the top 1/3 most profitable steers (High profit) had heavier placement and final weights compared to the Middle and Low profit groups (P < 0.0001). Steers in the High and Middle profit groups had a greater ADG compared to the Low profit group (P = 0.04). Higher profit group steers consumed more feed (DMI) and had poorer F:G compared to the Middle and Low profit groups (P < 0.0001). Based on NRC (2000) models, the High profit group would be expected to have decreased DMI and improved F:G compared to the Middle and Low profit groups. However, these estimates of individual feed intake and feed efficiency should be interpreted with caution as actual individual feed intake was not
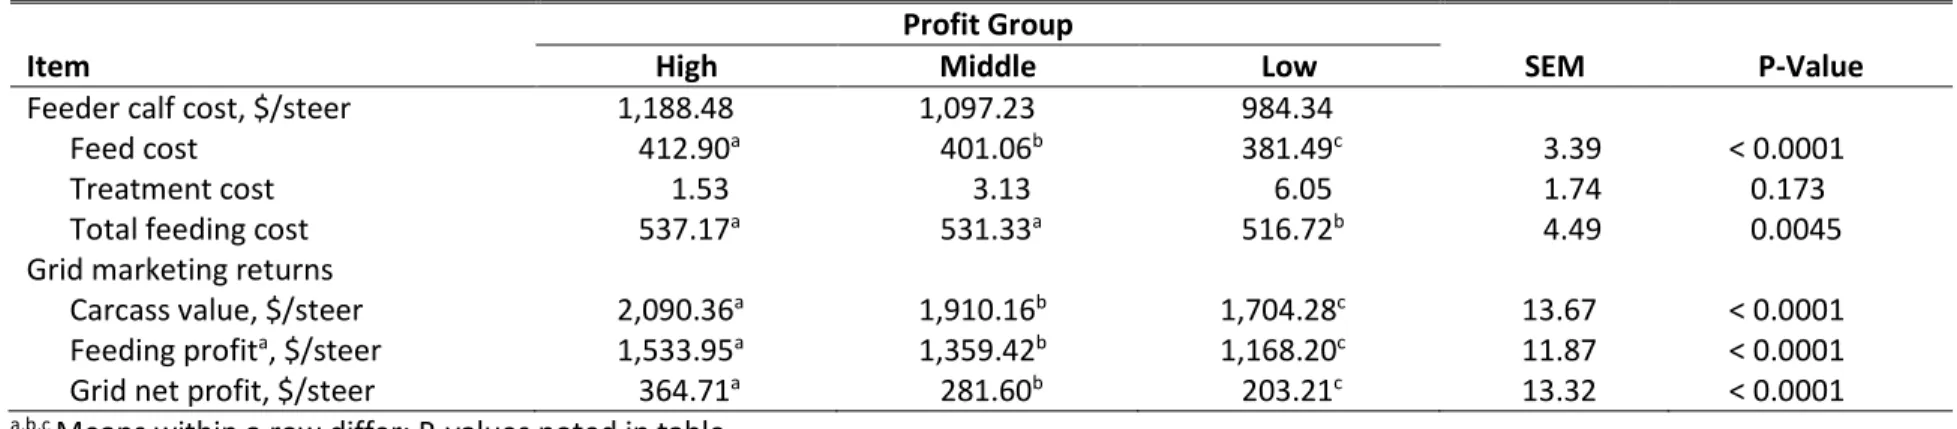
measured. Using these estimates of DMI, High and Middle profit steers had higher total costs than either the Low profit groups due to greater DMI (Table 5, P < 0.001).
Steers in the High profit group had heavier HCW and increased dressing percentage (Table 3, P < 0.001) than Low profit steers, with Middle profit steers being intermediate. The high profit group had increased marbling scores compared to Middle and Low groups (Table 3, P < 0.003). Ribeye area was larger for the High and Middle profit steers compared to the Low group (P = 0.0005). High and Middle profit steers had similar USDA Yield Grades, however, High and Low profit groups were different (P = 0.05). It should be noted that all profit groups’ average USDA Yield Grade were within the same Yield Grade of 2. Twelfth‐rib fat thickness was decreased in the Low profit group compared to the High and Middle profit groups (P = 0.003).
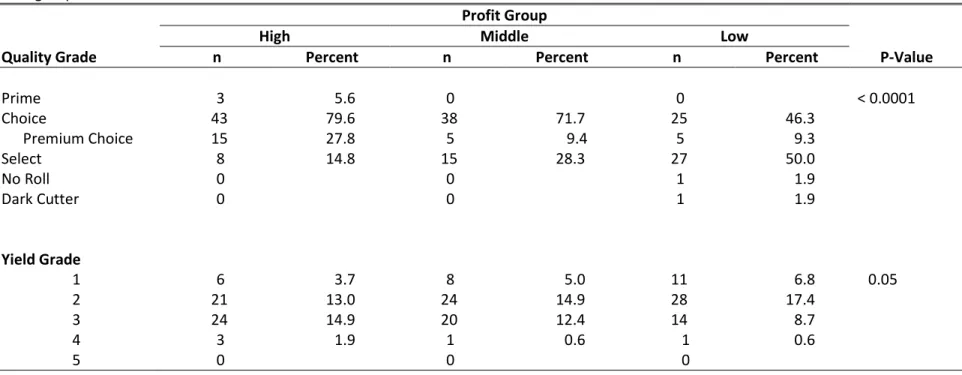
A increased proportion of the steers in the High profit group graded Choice or higher compared to the Middle and Low profit groups (Table 4, P < 0.0001). The premiums captured due to higher quality grades combined with an advantage in HCW resulted in significant differences in carcass values, $2,090.36, $1,910.16 and $1,704.28 for High, Middle, and Low profit group steers, respectively (Table 5, P <
0.0001). At the University of Illinois, researchers reported that 96% of the variation among carcass value can be explained by HCW, marbling and yield group (Retallick, et al., 2013). Even though the steers in the High profit group were heavier and thus more valuable at the start of the feeding period and had increased feeding cost than Low profit group, the greater carcass value resulted in a net return of $364.71 for the High profit steers compared to $281.60 and $203.21 for the Middle and Low groups, respectively. The feeding cost were increased for High and Middle profit groups compared to Low profit group; however, there was only $20.45 different between High and Low profit groups.
These results for calf‐fed steers agree with similar data sets showing that the most profitable cattle were those that were the fastest gaining with the heaviest HCW and a greater percentage grading Choice or higher (Walter and Hale, 2011). Conversely those steers with the greatest losses were those with the poorest feedlot performance that had carcasses that were lighter and less likely to grade Choice. For cow/calf producers, the Calf‐Value Discovery Program provides feedback on feeding performance and carcass characteristics of calves and an opportunity to benchmark their calf crop to a larger group of cattle when placed in a calf fed system. Ultimately, market conditions and input prices can greatly impact feeding profitability from year to year, but these data provide useful guidelines for making selection and marketing decisions in the future.
LITERATURE CITED
NRC. 2000. Nutrient requirements of beef cattle. 7th Ed. Update 2000. National Academies Press. Washington, D.C.
Retallick, K. M., D. B. Faulkner, S. L. Rodriguez‐Zas, J. D. Nkrumah, and D. W. Shike. 2013. Relationship among performance, carcass, and feed efficiency characteristics, and their ability to predict economic value in the feedlot. J. Anim. Sci. 91:59‐54‐5961.
Walter, S., and R. Hale. 2011. Profit profiles: factors driving cattle feeding profitability. Available:
http://www.cabpartners.com/news/research/CABProfitProfiles.pdf. Accessed October 10, 2013.
60
Table 1. Overall performance and carcass characteristics of cattle enrolled in the 2013‐2014 South Dakota Calf‐Value Discovery Program.
Item Mean SEM Minimum Maximum
Days on feed 212 18.0 186 230 SBWa, lb D 0 583 109.8 305 854 D 37 678 117.7 357 952 D 106 929 127.0 591 1,248 Final 1,271 103.0 937 1,505 ADG, lb/d 3.24 0.32 2.22 3.90 DMI, lb/d 19.3 1.58 13.87 23.25 F:G 5.97 0.44 4.80 6.99 HCW, lb 803 69.9 547.3 985.4 Dress., % 63.14 2.21 54.67 68.91
12‐th rib fat thickness, in. 0.35 0.13 0.08 0.72
Rib eye area, in2 12.88 1.44 9.14 17.19
KPH, % 1.84 0.22 1.36 2.43
Marbling scoreb 424 89.6 270 720
USDA Yield Grade 2.27 0.76 1.00 4.00
USDA Quality Grade distribution n Percent
Prime 3 1.9 Choice 106 65.8 Premium Choice 25 15.5 Select 50 31.1 Dark Cutter 1 0.6 No roll 1 0.6
aSBW = Shrunk Body Weight (4% pencil shrink applied to BW)
61
Table 2. Feeding expenses and carcass values of cattle enrolled in the 2013‐2014 South Dakota Calf‐Value Discovery Program.
Item Mean SEM Minimum Maximum
Feeder calf cost, $/steer 1,089.97 123.92 731.12 1,381.69
Feeding costs, $/steer
Feed cost 398.47 27.76 305.34 463.94
Treatment cost 3.57 12.69 0.00 110.08
Total feeding cost 528.39 33.60 439.82 641.05
Grid marketing returns
Carcass value, $/steer 1,901.54 187.00 1,171.22 2,414.23
Feeding profita, $/steer 1,353.82 173.09 710.95 1,840.42
Grid net profit, $/steer 283.17 117.02 (250.63) 600.34
62
Table 3. Feedlot performance and carcass characteristics of steers enrolled in the 2013‐2014 South Dakota Calf‐Value Discovery Program according to profit group.
Profit Group
Item High Middle Low SEM P-Value
Number of head 54 53 54 Days on feed 204a 214b 218b 2.36 < 0.0001 SBWd, lb D 0 674a 586b 491c 11.03 < 0.0001 D 37 775a 683b 577c 11.74 < 0.0001 D 106 1,038a 934b 815c 12.18 < 0.0001 Final 1,353a 1,277b 1,183c 10.42 < 0.0001 ADG, lb/d 3.33a 3.23a 3.17b 0.04 0.04 DMIe, lb/d 20.5a 19.3b 18.0c 0.17 < 0.0001 F:G 6.19a 5.99b 5.72c 0.05 < 0.0001 HCW, lb 869a 806b 733c 5.83 < 0.0001 Dress., % 64.2a 63.2b 62.0c 0.28 < 0.0001
12‐th rib fat thickness, in. 0.38a 0.37a 0.30b 0.02 0.003
Rib eye area, in2 13.4a 13.0a 12.3b 0.19 0.0005
KPH, % 1.83 1.86 1.85 0.03 0.75
Marbling scoref 456a 416b 400b 11.95 0.003
USDA Yield Grade 2.44a 2.26a,b 2.09b 0.10 0.05
a,b,c Means within a row differ; P‐values noted in table.
d SBW = Shrunk Body Weight (4% pencil shrink applied to BW) eCalculated from BW and ADG
63
Table 4. USDA Quality and Yield Grade distributions of steers enrolled in the 2013‐2014 South Dakota Calf‐Value Discovery Program according to profit group.
Profit Group
High Middle Low
Quality Grade n Percent n Percent n Percent P-Value
Prime 3 5.6 0 0 < 0.0001 Choice 43 79.6 38 71.7 25 46.3 Premium Choice 15 27.8 5 9.4 5 9.3 Select 8 14.8 15 28.3 27 50.0 No Roll 0 0 1 1.9 Dark Cutter 0 0 1 1.9 Yield Grade 1 6 3.7 8 5.0 11 6.8 0.05 2 21 13.0 24 14.9 28 17.4 3 24 14.9 20 12.4 14 8.7 4 3 1.9 1 0.6 1 0.6 5 0 0 0
64
Table 5. Feedlot performance and carcass characteristics of steers enrolled in the 2013‐2014 South Dakota Calf‐Value Discovery Program according to profit group.
Profit Group
Item High Middle Low SEM P-Value
Feeder calf cost, $/steer 1,188.48 1,097.23 984.34
Feed cost 412.90a 401.06b 381.49c 3.39 < 0.0001
Treatment cost 1.53 3.13 6.05 1.74 0.173
Total feeding cost 537.17a 531.33a 516.72b 4.49 0.0045
Grid marketing returns
Carcass value, $/steer 2,090.36a 1,910.16b 1,704.28c 13.67 < 0.0001
Feeding profita, $/steer 1,533.95a 1,359.42b 1,168.20c 11.87 < 0.0001
Grid net profit, $/steer 364.71a 281.60b 203.21c 13.32 < 0.0001
a,b,c Means within a row differ; P‐values noted in table. d Feeding profit is carcass value minus feeding cost.