Selenium Isotope Studies in Plants
Development and Validation of a Novel Geochemical
Tool and its Application to Organic Samples
submitted in fulfilment of the requirements for the degree of
Doctor of Natural Sciences (Dr. rer. nat.)
to the
Department of Civil Engineering, Geo-
and Environmental Sciences
approved dissertation of
M.Sc. Helena Banning
born in Steinfurt
Day of oral examination: 17.02.2016
Reviewer:
Prof. Dr. Thomas Neumann
Second Reviewer:
Prof. Dr. Ronny Schönberg
Advisor:
Dr. Monika Stelling
Dieses Werk ist lizenziert unter einer Creative Commons Namensnennung 3.0 Deutschland Lizenz (CC BY 3.0 DE): http://creativecommons.org/licenses/by/3.0/de/
2
ERKLÄRUNG (DECLARATION)
Hiermit erkläre ich, dass ich die vorliegende Dissertation selbstständig verfasst und keine anderen als die angegebenen Hilfsmittel benutzt habe. Die Stellen der Arbeit, welche anderen Quellen im Wortlaut oder dem Sinn nach entnommen wurden, sind durch Zitation kenntlich gemacht. Dies gilt auch für bildliche Darstellungen, Tabellen sowie für Quellen aus dem Internet.
I hereby declare that I have written the following dissertation on my own, relying on no other means than the ones stated. Those sections of this work, which were taken from other sources – cited directly or indirectly – are quoted as such. This also applies to illustrated figures, tables as well as internet quotations
3
ACKNOWLEDGEMENTS
First, I would like to thank Prof. Dr. Thomas Neumann (KIT) for supervision of my Ph.D., for being first reviewer of this work, for continuous support and helpful advice on this thesis.
I want to thank Prof. Dr. Ronny Schönberg (University of Tübingen) for uncountable hours and effort he put into the analytical setup for selenium isotope determinations in his institute, for improving my focus on details regarding analytical precision and valuable discussions, and for being second reviewer.
Special thanks to Dr. Monika Stelling, the project leader of the YIG and advisor of my Ph.D. for continuous encouragement, numerous discussions, comprehensive support and advice in and beyond scientific issues, and for proofreading.
I would like to thank the members of my PhD Commission for their support: Prof. Dr. Thomas Neumann, Prof. Dr. Ronny Schönberg, Prof. Dr. Peter Nick, PD Dr. Stefan Norra, Prof. Dr. Nico Goldscheider.
All colleagues from the Institute of Applied Geosciences and the Botany Institute at KIT as well as from the Isotope Geochemistry Group at University of Tübingen are acknowledged for continuous technical and scientific support, particularly
• Claudia Mößner for uncountable ICP-MS measurements with complicated sample matrices and valuable advice on method optimization
• Dr. Alexandra Nothstein for developing the concept of plant cultivation in phytoagar, for explaining and showing how to reasonably apply plant cultivation methods and for advice in many other applications in the laboratory
• Dr. Elisabeth Eiche for scientific support concerning selenium behavior in the natural and laboratory environment and for providing plant and soil samples from Punjab, India
• Dr. Stephan König for spending much time and motivation in analyzing my samples and dealing with challenging matrices, for investing time and energy in the improvement of the analytical setting and troubleshooting, for detailed explanations and demonstrations of the instrumental setup and for valuable advice on selenium isotope analytics and sample preparation
• Timon Kurzawa and Elmar Reitter for support in selenium isotope analyses and discussions
• Dr. Michael Riemann, Rita Brendel, Ronja Kammerichs and Holger Ludwig for support in the performance of plant cultivation and plant tissue and phytoagar preparation despite of a variety of special requests
• Chris Buschhaus for TOC measurements on complicated matrices
Dr. Markus Lenz and Karen Viacava (Institute for Ecopreneurship, FHNW Basel) are acknowledged for analyzing various samples on selenium species composition and for data assessment in their laboratory in Basel.
Thank you to Dr. Kathrin Schilling and Prof. Dr. Tom Johnson for inviting me to their laboratory in Urbana-Champaign in 2012 and demonstrating their methods on selenium isotope analyses and sample preparation, and for continuous advice on those issues during the last years.
I would like to thank my fellow Ph.D. students from AGW – Nicolas Börsig, Arno Hartmann, Andreas Holbach, Peter Illner, Olga Körting, Josephin Mühlbach, Alexandra Nothstein, Sebastian Potsch, Xiaohui Tang and Chen Yuen – for a nice and motivating atmosphere and for discussions on daily life issues occurring during Ph.D. time.
4
Thank you to Moritz Reuleaux for dedicated and detail oriented proofreading on language and style, which clearly facilitated the reader to follow my lines of argumentation, and made reading significantly less confusing.
For exchange and discussions on all the non-scientific issues occurring in academia, for several years spent on the improvement of the Ph.D. situation at KIT and beyond – with varying extent of success – for teaching me valuable lessons in diplomacy and for lots of amusing episodes I would like to thank everyone feeling associated to PaKIT.
Last but not least I would like to particularly thank my family and friends for continuous encouragement and support during the last 3.5 years, and for being unconditionally proud of me without effectively understanding why.
FUNDING
This work was part of Dr. Monika Stelling’s Young Investigator Group (YIG), whose funding was provided by the “Concept of the Future” of KIT within the framework of the German Excellence Initiative. Travel grants for the attendance at the 3rd International Selenium Conference in Hefei, China, the Goldschmidt Conference 2015 in Prag, Czech Republic, as well as the Research Management Training Workshop in Brussels were provided by the Graduate School of Climate and Environment (GRACE), KIT.
5
ABSTRACT
Selenium (Se) is an essential nutrient as well as a toxin with a narrow range of tolerance. Due to heterogeneous distribution on both the local and global scale, an inadequate supply with Se is a risk factor that affects an estimated 0.5 to 1.0 billion people worldwide to varying extent. Plants are the major dietary Se source and a bottleneck for the entrance of Se into the biosphere. Redox processes thereby determine Se uptake into and distribution within the plant. Se isotope variations in geological and environmental samples proved to be a good redox tracer making them a promising tool for the exploration of the plant related Se cycle as well. However, Se isotope data are scarce and the complexity of the natural environment hardly enables systematic investigations of particular processes. This study aims to separately examine plant related processes and to figure out the relation between those and isotope signatures induced by them. To reach these goals a Minimum Parameter approach was chosen, in which plants were cultivated in closed and controlled systems with a minimum of external influences. Phytoagar, an artificial growth medium free of nutrients, was doped with Se in varying species and concentrations. Plants were cultivated therein in closed box systems. Mass balancing and the determination of Se isotope signatures in the compartments enabled the quantification of uptake, translocation and volatilization as well as isotope fractionation induced by them. Se isotope ratios (δ82Se) were detected using hydride generation multicollector inductively coupled mass spectrometry (HG-MC-ICP-MS) (δ82Se [‰] = ((82/76Se
sample)/(82/76Sestandard
)-1)*1000). This technique is characterized by high precision, but also high sensitivity on matrix effects. The gain of accurate and valid data therefore requires several steps of preceding sample treatment. A comprehensive procedure for the reasonable, precise and valid determination of stable Se isotopes in plants and phytoagar samples was developed in this study. Basis was the transformation of plants and phytoagar into a liquid form and the reduction of organic compounds, particularly organic Se species, to a minimum. Building on this, matrix compounds were separated from sample-Se in order to avoid mass interferences and inhibitions occurring within Se isotope analytics. A variety of
6
methods for the particular steps was modified or developed with regard to the target matrices and systematically tested on their efficiency, validity and potential limitations.
A microwave digestion procedure with two reaction chambers was proved to be most suitable for plant tissue, having a mineralization rate of 99.3 (±0.4) % and reproducibly full Se recovery. For phytoagar, the developed vacuum filtration procedure was most reliable with limitations regarding organic residuals. The application of chromatographic anion exchange for matrix separation revealed a high matrix dependency, which was not detected for selective Se retention on thiol groups. Both methods were able to fully remove critical elements, but retained organic residuals in the purified phases. Se separation via hydride formation completely purified sample-Se from its organic matrix. It therefore was proved to be highly suitable for organic samples. Validation tests showed that organic residuals had a severe impact on mass bias correction and yielded invalid isotope data. Anion exchange and thiol retention did thereby not meet the demands of sample purification, whereas hydride separation produced valid and reliable results with a precision in δ82Se of 0.2 (±0.2) ‰ for plant and 1.1 (±0.1) ‰ for phytoagar matrices. Validity of this method was confirmed by a certified shale reference (SGR-1). This developed and validated procedure provides a solid and reliable basis for stable Se isotope determinations in organic samples and reveals organic compounds as a limiting factor for validity.
Based on this, Se isotope variations among the compartments of the Minimum Parameter approach were detected. Se transfers revealed a high dependence of uptake and translocation on Se source species as well as species characteristic rate limiting steps occurring at high Se exposure. Despite of high rates, volatilization and uptake did not yield significant Se isotope fractionation. In contrast, translocation induced high fractionation (Δ82Se) of +2.3 ‰ to +3.5 ‰ for selenate respectively +1.2 ‰ to +1.9 ‰ for selenite supplied plants. Higher initial Se concentration thereby corresponds to lower fractionation. These results indicate shifts in metabolic Se transformations that involve key processes for Se accumulation in particular plant parts. Knowledge of these mechanisms is crucial for the investigation and assessment of adequate human Se supply via plant foods.
7
This thesis provides a comprehensive and validated method for Se isotope analytics in organic samples with a precision sufficient for the detection of plant internal Se isotope variations. The
Minimum Parameter cultivation approach offers a differentiated investigation of Se transformation processes occurring related to plants. This setup has high potentials for successive extensions to approximate natural conditions and to provide a guideline for the interpretation of Se isotope data in plants derived from natural systems.
8
ZUSAMMENFASSUNG
Selen (Se) ist ein essentieller Nährstoff und toxischer Schadstoff mit einer engen Toleranzgrenze. Aufgrund von heterogener Verteilung auf lokaler und globaler Ebene beinhaltet eine inadäquate Selenversorgung ein hohes Risiko, welches 0,5 bis eine Milliarde Menschen weltweit betrifft. Pflanzen sind für den Menschen die Hauptquelle für Selen und gleichzeitig der praktisch einzige Weg zum Eintritt des Selens in die Nahrungskette. Redoxprozesse bestimmen maßgeblich die Aufnahme und Verteilung von Selen innerhalb der Pflanze. Selenisotopenvariationen in geologischen Systemen und der oberflächennahen Umwelt wurden als zuverlässige Redoxtracer erkannt, was deren Anwendung für die Erforschung des Selenkreislaufs in Pflanzen äußerst vielversprechend macht. Dennoch sind Daten zur Selenisotopenverteilung in Pflanzen knapp und die Komplexität natürlicher Systeme macht eine differenzierte Untersuchung einzelner Prozesse kaum möglich. Ziel dieser Studie ist die getrennte Untersuchung von selenbezogenen Prozessen in Pflanzen und die Aufdeckung der Zusammenhänge zwischen diesen Prozessen und Selenisotopenvariationen, die durch jene ausgelöst wurden. Zu diesem Zweck wurde ein Minimum Parameter Ansatz gewählt, in dem Pflanzen in geschlossenen und kontrollierten Systemen unter Ausschluss externer Einflüsse gezüchtet wurden. Phytoagar, ein künstliches nährstofffreies Wachstumsmedium, wurde mit Selen in verschiedenen Spezies und Konzentrationen dotiert, und Pflanzen wurden innerhalb einer geschlossenen Box darin kultiviert. Massenbilanzierung und die Bestimmung von Selenisotopenverhältnissen in den Kompartimenten ermöglichten die Quantifizierung von Aufnahme, Translokation und Volatilisierung sowie Isotopenfraktionierungen, die im Rahmen dieser Prozesse ausgelöst wurden. Selenisotopenverhältnisse (δ82Se) wurden mittels Hydridgeneration-Multikollektor-Induktiv
gekoppeltem Plasma-Massenspektrometrie (HG-MC-ICP-MS) bestimmt (δ82Se [‰] =
((82/76SeProbe)/(82/76SeStandard)-1)*1000). Diese Technik zeichnet sich durch hohe Präzision und
gleichzeitig hohe Empfindlichkeit auf Matrixeffekte aus. Akkurate und valide Daten erfordern daher mehrere Probenaufbereitungsschritte. Aus dem Grund wurde in dieser Arbeit eine umfassende Methode für die sinnvolle, präzise und valide Bestimmung von stabilen Selenisotopen in Pflanzen
9
und Phytoagar entwickelt. Grundlage dafür war die Transformation beider Probenarten in eine flüssige, möglichst organikfreie Form. Darauf aufbauend wurden die Komponenten der Probenmatrix selektiv vom Proben-Selen getrennt, um Masseninterferenzen und matrixbedingte Störungen während der Analysen zu vermeiden. Für die jeweiligen Schritte und Probenarten wurden diverse Methoden angepasst oder neu entwickelt und systematisch auf Effektivität, Validität und mögliche Einschränkungen getestet.
Eine mikrowellenbasierte Aufschlussmethode mit zwei getrennten Reaktionskammern wurde als das am besten geeignete Verfahren für Pflanzenmaterial bewertet, da sie eine Mineralisierungsrate von 99.3 (±0.4) % und eine reproduzierbar komplette Wiedergewinnung des Selens garantiert. Für die Behandlung des Phytoagars wurde eine speziell entwickelte Vakuumfiltrationsmethode für am geeignetsten erachtet, die jedoch einige Limitierungen bezüglich organischer Reste aufwies. Die Anwendung von Anionenaustausch im Säulentrennverfahren zur Entfernung der Probenmatrix zeigte eine hohe Matrixabhängigkeit, die für selektive Retention durch Thiolgruppen nicht entdeckt werden konnte. Beide Methoden ermöglichten die vollständige Entfernung kritischer Matrixelemente, jedoch blieben in beiden Fällen organische Phasen zusammen mit Selen zurück. Selenabtrennung durch Hydridbildung hingegen konnte Selen vollständig von der organischen Matrix abtrennen. Validierungstests zeigten, dass organische Reste einen schwerwiegenden Einfluss auf die Korrektur instrumenteller Fraktionierung und damit auf die Validität der Ergebnisse haben. Daher erfüllten Anionenaustausch und Thiolretention nicht die analytischen Voraussetzungen. Im Gegensatz dazu brachte die Hydridseparation valide und verlässliche Ergebnisse mit einer δ82Se-Präzision von 0.2 (±0.2) ‰ für Pflanzen und 1.1 (±0.1) ‰ für Phytoagar hervor. Die Validität dieser Methode wurde über die Messung von zertifiziertem organikreichem Tonstein (SGR-1) bestätigt. Die hier entwickelte und validierte Methode bietet eine solide und verlässliche Basis für die Messung stabiler Selenisotope in organischen Proben und charakterisiert organische Komponenten als limitierenden Faktor für valide Analytik.
10
Auf dieser Grundlage wurden Selenisotopenvariationen innerhalb der Kompartimente des Minimum Parameter Ansatzes detektiert. Transportprozesse offenbarten eine große Abhängigkeit von Aufnahme und Translokation gegenüber der Selenquellspezies sowie charakteristische limitierende Schritte, die besonders bei hoher Selenexposition auftraten. Trotz hoher Umsatzraten führten weder Aufnahme noch Volatilisierung zu signifikanter Selenisotopenfraktionierung. Translokation hingegen induzierte bedeutende Fraktionierungen (Δ82Se) von +2.3 ‰ bis +3.5 ‰ in Selenat beziehungsweise +1.2 ‰ bis +1.9 ‰ in Selenit dotierten Ansätzen. Höhere Konzentrationen im Wachstumsmedium gingen dabei mit geringeren Fraktionierungswerten einher. Diese Resultate indizieren eine Verschiebung von metabolischen Selenumsatzmechanismen, die Schlüsselprozesse für die Selenakkumulation in bestimmten Pflanzenteilen darstellen. Kenntnisse darüber sind von essentieller Relevanz zur Erforschung und Sicherstellung adäquater Selenversorgung durch pflanzliche Ernährung. Diese Arbeit bietet eine umfassende und validierte Methode zur Selenisotopenanalytik in organischen Proben mit einer Präzision, die zur Detektion pflanzeninterner Selenisotopenvariationen ausreicht. Mit dem Minimum Parameter Kultivierungsansatz wurde eine Möglichkeit geschaffen, Selentransformationsprozesse in Pflanzen differenziert zu erforschen. Dieser Aufbau bietet zudem die Option sukzessiver Erweiterungen zur Annäherung an natürliche Bedingungen und damit zur Entwicklung einer Richtlinie für die Interpretation von Selenisotopendaten in Pflanzen aus natürlichen Systemen.
11
TABLE OF CONTENTS
ERKLÄRUNG (DECLARATION) ... 2 ACKNOWLEDGEMENTS ... 3 ABSTRACT ... 5 ZUSAMMENFASSUNG... 8 TABLE OF CONTENTS ... 11 LIST OF FIGURES ... 14 LIST OF TABLES ... 17 1 INTRODUCTION ... 19 1.1 Motivation ... 191.2 Goals and objectives ... 20
2 STATE OF THE ART ... 21
2.1 Selenium – properties and relevance for environment and health ... 21
2.1.1 Chemical and geochemical properties ... 21
2.1.2 Physiological functions ... 23
2.1.3 Economic relevance and industrial applications ... 25
2.1.4 Distribution in the environment ... 27
2.2 Selenium and plants ... 31
2.2.1 Role of plants ... 31
2.2.2 Se uptake and translocation processes ... 33
2.2.3 Se accumulating plants ... 36
2.2.4 Se volatilization... 38
2.3 The stable selenium isotope system ... 40
2.3.1 Selenium stable isotope analytics ... 42
2.3.2 Previous studies on Se isotope signatures in the environment ... 44
2.3.3 Se isotope fractionation in plants... 48
3 ANALYTICAL METHODS ... 51
3.1 Overview of standard analytical methods applied ... 51
3.1.1 Element concentrations ... 51
3.1.2 Total organic carbon (TOC) ... 52
3.1.3 Anions ... 52
12
3.2 Development of analytical method for Se isotope determinations ... 54
3.2.1 Instrumental setting ... 54 3.2.2 Interferences ... 55 3.2.3 Cup configuration ... 57 3.2.4 Signal optimization ... 58 3.2.5 Methane injection ... 59 3.2.6 Hydride generation ... 60 3.2.7 Double Spike ... 60 3.2.8 Data processing ... 66
4 PRODUCING PRECISE AND VALID SE ISOTOPE DATA BY DEVELOPING INDIVIDUAL SAMPLE TREATMENT METHODS ... 75
4.1 Purity and cleaning procedures ... 75
4.2 Phytoagar treatment ... 80 4.3 Plant treatment ... 85 4.4 Purification ... 90 4.4.1 Methodical setups ... 91 4.4.2 Test matrices ... 100 4.4.3 Data processing ... 102
4.4.4 Removal pathways of critical elements ... 103
4.4.5 Se recoveries ... 109
4.4.6 Residuals in purified samples ... 112
4.4.7 Method evaluation ... 115
4.5 Analytical quality control ... 115
4.5.1 Isobaric interferences ... 116
4.5.2 Reproducibility ... 117
4.5.3 Validity ... 118
5 DETERMINING THE RELATION BETWEEN SE ISOTOPE SIGNATURES AND METABOLIC PROCESSES IN PLANTS ... 125
5.1 Minimum ParameterExperiments (MinPaX) ... 129
5.2 Data processing ... 132
5.3 Se source stability during cultivation ... 140
5.4 Growth rates and phytomass production ... 142
5.5 Se distribution and transport pathways ... 145
5.6 Se isotope signatures and fractionation ... 153
13
6 CONCLUSIONS AND OUTLOOK ... 161
6.1 Evaluation of aims ... 161
6.2 Next steps ... 163
REFERENCES ... 165
APPENDICES ... 177
Appendix I – list of laboratory equipment and reagents used ... 177
Appendix II – cleaning procedures ... 180
Appendix III – purification procedure instructions... 182
14
LIST OF FIGURES
Figure 1: (a) The position of Se within the periodic table of elements (b) Pourbaix diagram of Se. .... 21
Figure 2: Simplified scheme of sorption mechanisms on ferric hydroxides of the Se oxyanions selenate and selenite. ... 22
Figure 3: Relation between daily Se uptake and Se related diseases – thresholds for an average grown-up person. ... 24
Figure 4: Se toxicity symptoms. ... 24
Figure 5: Se deficiency symptoms. ... 25
Figure 6: (a) Advertisement for Se fortified potatoes Selenella from Italia (b) naturally Se enriched potatoes Selena from a Se rich area in Ireland (c) Se fortified eggs (d) health campaign to promote naturally enriched garlic as dietary Se source. ... 26
Figure 7: Industrially used Se divided into branches, examples of products containing Se. ... 26
Figure 8: Schematic global cycle of Se with main focus on the terrestrial environment. ... 27
Figure 9: Scheme of influence factors for Se mobility and the origins of Se related problems. ... 30
Figure 10: Simplified scheme of Se entering and transport into the food chain via plants and bioaccumulation along the food chain. ... 32
Figure 11: Schemes of Se distribution and species abundances in different plant parts. ... 34
Figure 12: Simplified scheme of Se transformation processes within plants characteristic for (but not limited to) the group of non-accumulators, secondary accumulators and hyperaccumulators. ... 38
Figure 13: Natural average abundance of the six stable Se isotopes. ... 42
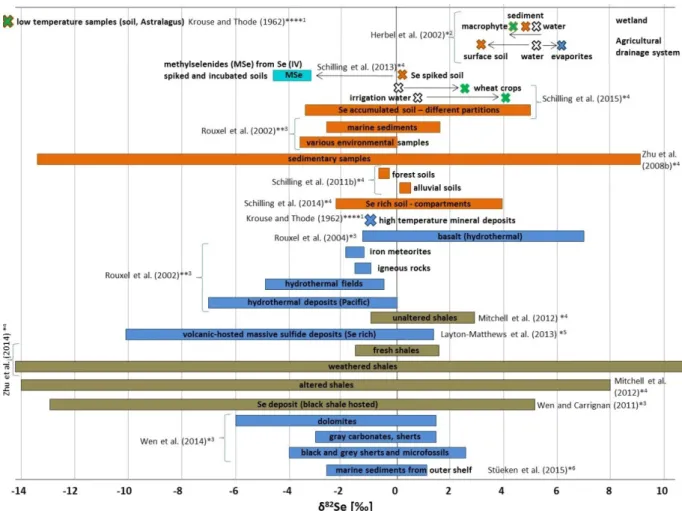
Figure 14: Studies on Se isotope ratios related to a standard material measured with different methods and in different sample matrices. ... 46
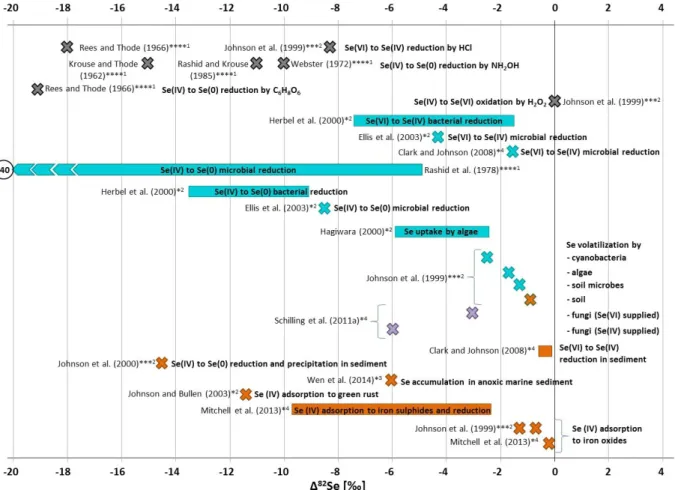
Figure 15: Studies on Se isotope fractionation related to a standard material measured with different methods and in different sample matrices. ... 47
Figure 16: Number of studies exploring or using the Se isotope system in the geological and environmental context, published per year. ... 48
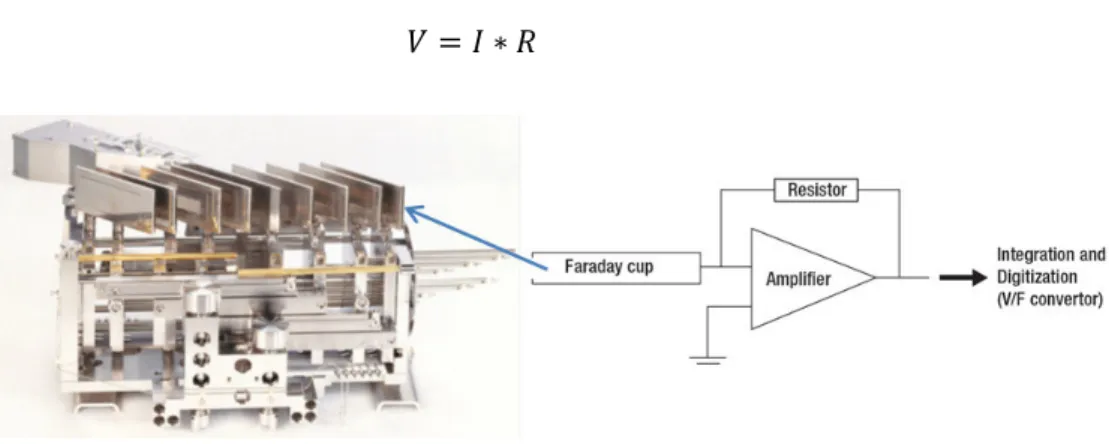
Figure 17: Photograph and scheme of Faraday cups used in MC-ICP-MS analytics. ... 55
Figure 18: Scheme of HG-MC-ICP-MS analytics for Se isotope measurements. ... 55
Figure 19: Schematic diagram of the Double Spike technique for the 74Se/77Se Double Spike. ... 62
Figure 20: Graph of error dimension depending on the 74Se/77Se mix in the Double Spike and the Double Spike/sample mix. ... 63
15
Figure 21: Se isotope composition of the Double Spike solution that is added prior to sample preparation to correct any instrumental mass bias and preparation caused “artificial” Se
isotope fractionation. ... 64
Figure 22: Se species determinations in the Double Spike solution with IC.. ... 65
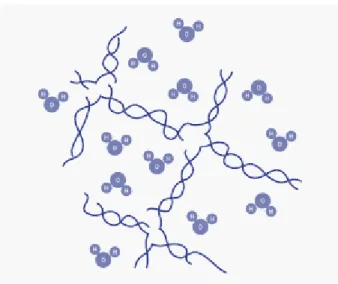
Figure 23: Scheme of organic lattice and connected H2O molecules of semi-solid phytoagar.. ... 81
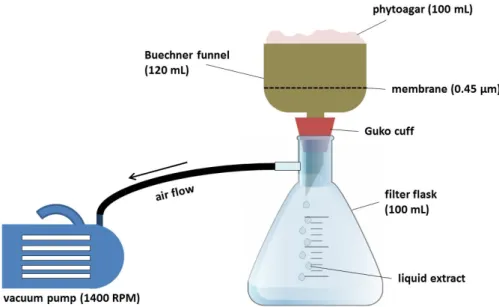
Figure 24: Simplified scheme of the experimental setup for vacuum filtration. ... 82
Figure 25: Se recoveries dependent on Se concentration and species added using digestion after Kopp (1999) and vacuum filtration. ... 83
Figure 26: Implemented digestion method after Kopp (1999). ... 88
Figure 27: Molecular structure and retention/desorption mechanism in purification method (A). ... 92
Figure 28: Abundances of selenate (a) and selenite (b) species dependent on the pH value. ... 93
Figure 29: The four steps of purification according to method (A). ... 95
Figure 30: Purification mechanisms in method (B). ... 96
Figure 31: The four steps of purification according to method (B). ... 98
Figure 32: Scheme of purification method (C). ... 99
Figure 33: Matrix element and Se ratios determined in each step eluate of method (A) derived from the ICP multi-element standard and for Se only for plant digests. ... 103
Figure 34: Matrix element and Se ratios determined in each step eluate of method (B) derived from the ICP multi-element standard and for Se only for plant digests. ... 105
Figure 35: Matrix element and Se ratios determined in each step eluate of method (C) derived from the ICP multi-element standard and for Se only for plant digests. ... 107
Figure 36: Process scheme of validity tests in dependence on matrix, sample treatment procedure, purification method and date of Double Spike addition.. ... 119
Figure 37: Individual δ82Se values in dependence on the instrumental mass bias factor βinstr for validation tests processed with purification methods (A), (B) and (C) and both plant and phytoagar matrices. ... 120
Figure 38: Individual δ82Se values dependent on Se recoveries after HG and total Se recovery after HG and the subsequent anion exchange (AE) step in plant samples purified with method (C). ... 122
Figure 39: Hypothetical transport pathways of Se taken up by plants dependent on Se species available in the growth medium. ... 127
Figure 40: Molecular structure of all three Se species used.. ... 130
Figure 41: (a) Scheme of the experimental set up with varying Se species and concentrations (b) scheme of a magenta box with rice seedlings (c) photograph of a magenta box with rice seedlings. ... 130
16
Figure 42: Mass balance model of MinPaX including compartments phytoagar, cultivated plants – with subcompartments roots and shoots – and atmosphere as well as examined transport processes uptake, translocation and volatilization... 133
Figure 43: Illustration of potential rate limiting steps for dominant Se transport pathways. ... 136
Figure 44: Growth of plants depending on Se species and concentration in MinPaX I and MinPaX II cultivation batches. ... 143
Figure 45: Average length and phytomass of plants after the cultivation period of 16 days in dependence of Se concentration and species within the different cultivation experiments. ... 144
Figure 46: Relation between shoot length respectively phytomass after the cultivation period and the Se uptake depending on Se species supplied.. ... 144
Figure 47: Distribution of Se fractions within the cultivation system compartments for the selenate supplied setups. ... 147
Figure 48: Absolute Se transport as well as relative Se transport among the cultivation system
compartments for selenate supplied setups. ... 147
Figure 49: Relative Se transport depending on the initial selenate concentration. ... 148
Figure 50: Distribution of Se fractions within the cultivation system compartments for the selenite supplied setups. ... 150
Figure 51: Absolute Se transport as well as relative Se transport among the cultivation system
compartments for selenite supplied setups. ... 150
Figure 52: Relative Se transport depending on the initial selenite concentration. ... 151
Figure 53: Distribution of Se fractions for the SeMet supplied setups. ... 152
Figure 54: Absolute Se transport as well as relative Se transport among the cultivation system
compartments for SeMet supplied setups. ... 152
Figure 55: Relative Se transport depending on the initial SeMet concentration. ... 153
Figure 56: Se isotope fractionation and presumed underlying processes in the case of selenate supply. ... 157
Figure 57: Se isotope fractionation and presumed underlying processes in the case of selenite supply. ... 159
17
LIST OF TABLES
Table 1: Overview over selected studies on cultivation of Se non-accumulator plants with varying Se concentrations, growth media and cultivation times and their results concerning
translocation ... 33
Table 2: Interferences on Se and monitor masses measured on Faraday cups at MC-ICP-MS ... 57
Table 3: Cup configuration applied for Se isotope analytics with HG-MC-ICP-MS ... 58
Table 4: Workspace blanks – 1 % HNO3 in hood for 5-6 days ... 78
Table 5: Process blanks derived from purification methods (A), (B) and (C) ... 79
Table 6: Se recoveries dependent from Se concentration and species added using digestion after Kopp (1999) and vacuum filtration ... 83
Table 7: Technical parameters applied in tests of plant digestion methods according to Bell et al. (1992) and Kopp (1999) using the same sample amount of 0.1 g plant tissue ... 87
Table 8: Sample types measured in purification steps within methods (A), (B) and (C) ... 101
Table 9: Se recoveries using original method described by Ellis et al. (2003) as well as three variations (I-III) regarding three modifications: (a) compression of poured resin, (b) leave out wash step, (c) replace 0.1M HCl with H2O in wash step ... 110
Table 10: Se recoveries and external reproducibility tested with purification methods (A), (B) and (C) depending on sample matrices ... 110
Table 11: Absolute contents of residuals [ng] in purified extraction sample using methods (A), (B) and (C) and ICP multi-element standard (MS), plant digest from the Punjab plants (pp), phytoagar (p) as well as plants (cp) from the cultivation experiments as matrices ... 113
Table 12: Residual TOC concentrations in plant and phytoagar samples purified with method (A), (B) and (C) ... 114
Table 13: δ82Se and external reproducibility of validation test samples dependent on purification method, sample matrix and date of Double Spike addition ... 119
Table 14: δ82Se values for SGR-1 standard reference material (USGS) reported by several studies and their external reproducibility ... 123
Table 15: δ82Se values measured in SGR-1 and NISTSRM1567a reference materials, their external reproducibility and for NISTSRM1567a TOC and Se recovery after HG used as continuous quality monitoring parameter ... 124
Table 16: Overview over cultivation experiments performed, samples derived from them and parameters analyzed... 131
Table 17: Initial and final Se concentrations in the cultivation setups and fractions of the Se species remaining in its initial form ... 140
Table 18: Se concentrations measured in the phytoagar extracts before and after ”plant free“ cultivation in all boxes and their Se recoveries ... 142
18
Table 19: Se isotope ratios measured and calculated in the system compartments for for cultivation batches with selenate supplied in 500 and 1000 µg L-1 concentrations and selenite supplied
in 500 and 1000 µg L-1 concentrations as well as quality indicators β
instr, Se recoveries and
residual TOC contents ... 154
Table 20: Se isotope differences and fractionation characteristics for uptake and translocation each including volatilization effects for cultivation batches with selenate supplied in 500 and 1000 µg L-1 concentrations and selenite supplied in 500 and 1000 µg L-1 concentrations . 155
19
1
INTRODUCTION
1.1
Motivation
Selenium (Se) plays a key role for human nutrition, animal health and environmental systems, as Se is an essential nutrient for all mammals and a toxin for any organism with a narrow tolerance range (Rayman, 2006). However, Se cycling in the biosphere and environment is not fully investigated yet. In terrestrial environments, plants deal as a bottleneck for Se in entering the biosphere and are therefore of particular relevance (Wu, 2004). Plant Se metabolism is characterized by Se species dependent uptake and reduction processes and the adjacent formation of particular molecules influencing accumulation or depletion in plants. As Se is a very redox sensitive element, the Se cycle in the environment and in plants is complex, transient and individual regarding ecosystem, land use and plant species (chapter 2.2).
Se stable isotope signatures proved to be a precise redox tracer and able to reconstruct Se related processes within geological and environmental samples. Spot tests on plant samples in different environments indicated high variations in Se isotope composition that were specific for the given ecosystem (chapter 2.3). Therefore, the determination of Se isotope composition of single samples as a state parameter might be able to give insight into Se related processes that took place and to reconstruct how the current Se status came to be. Therefore it is a promising and feasible tool to explore the Se cycle in plants growing under various conditions and reveal the individual causes of Se related issues.
A prerequisite is the full understanding of relations between characteristic Se isotope signatures in plants and their underlying processes, which are not systematically investigated yet. This requires the possibility to separately determine plant related Se processes that are naturally occurring parallel to each other. Furthermore, particular sample preparation and analytical methods have to be developed, implemented and validated to gain reliable Se isotope data from plants. With both issues requiring systematic pre-studies their combination contain a considerable potential to provide a solid and reliable basis for the use of Se isotope signatures in plants and other biological samples.
20
1.2
Goals and objectives
The main goal of this study is the provision of a methodical basis to separately investigate Se transformation processes that in nature occurring in parallel (e.g. inorganic and microbial Se reduction in soil and water, uptake of different Se species) and the extent of Se isotope variations induced by those. Cultivation experiments in the laboratory are a reasonable approach as they facilitate closed and controlled conditions as well as a continuous monitoring and reproduction. Independent, parallel setups enable the separate supplementation of Se species and concentrations. Therefore the first objective of this thesis is the development of a Minimum Parameter approach, which allows focusing on single processes only including H2O, Se and the plants, avoiding the
influence of soil components and macronutrients. This includes the adaption of existing concepts to the particular demands of Se isotope analytics, the monitoring of parameters and their stability as well as the examination of reasonable Se species and concentration supply with regard to Se isotope variations among compartments of the closed system.
Quantification of Se transfer processes and Se isotope fractionations presupposes the determinations of Se content and Se isotope ratio in any compartment. Precise and valid Se isotope analytics requires preceding sample treatment and selective purification from matrices, which is particularly challenging with organic rich samples deriving from the Minimum Parameter cultivation. Therefore, the second objective of this study is the development and implementation of comprehensive procedures meeting the analytical challenges. This includes the development of new methods or the adaption of existing ones to particular sample demands as well as the systematic monitoring of efficiency with particular regard to analytical validation.
21
2
STATE OF THE ART
2.1
Selenium – properties and relevance for environment and health
2.1.1 Chemical and geochemical properties
Selenium is an element in the periodic table with number 34 in group 16, period 4 and an atomic mass of 78.96 amu (Wieser et al., 2013) (Figure 1 (a)). It belongs to the group of chalcophile elements and shares particular properties with other elements of this group such as sulphur (S) and tellurium (Te). Se tends to form insoluble complexes and to be incorporated into crystal gratings of sulphidic minerals, substituting S. Additionally it forms mobile oxyanions and a variation of organic complexes (Wiberg et al., 2001; Lenz and Lens, 2009). Redox and pH conditions are an important factor for the stability of or transformation into a species or compound, particularly with Se, which has a high sensitivity on pH and redox changes (Takeno, 2005) (Figure 1 (b)).
(a) (b) Figure…:
In oxic environments Se tends to form selenate anions (SeO42-) that are thermodynamically favored in
stability and characterized by their high solubility and mobility. Selenate has a low affinity to reactions due to its tetraedic structure being energetically advantageous and therefore very stable (Olin et al., 2005). Oxygen exchange rates with H2O were reported to be exceptionally low with a
Figure 1: (a) The position of Se within the periodic table of elements (USGS, 2015), (b) Pourbaix diagram of Se (Se-O-H availability, 20°C, 1M Se, PhreeqC based model) (Takeno, 2005).
22
half-life of 106 years at 25°C and neutral pH conditions (Kaneko and Poulson, 2012). Selenate forms either bidentate outerpheric (Figure 2 (a)) or monodentate innerspheric (Figure 2 (b)) complexes, e.g. on ferric (Fe(III)) oxide and hydroxide surfaces. These sorption mechanisms are relatively weak and reversible (Su and Suarez, 2000; Peak and Sparks, 2002).
The oxyanion selenite (SeO32-), available at moderately oxic conditions within the entire pH range, is
soluble and mobile as well, but more affine to sorption (e.g. to iron oxides, clay minerals) as innerspheric bidentate complexes, which are more stable and rather irreversible (Zhang and Sparks, 1990; Su and Suarez, 2000) (Figure 2 (c)). Furthermore selenite tends to reduction processes to Se(0) or Se(-II) and, as a consequence, the incorporation into mineral or organic particles. Oxygen exchange with H2O is very quick and frequent (Kaneko and Poulson, 2012).
Figure 2: Simplified scheme of sorption mechanisms on ferric hydroxides of the Se oxyanions selenate (blue) and selenite (red) – (a) selenate sorption as bidentate outerspheric complex, (b) selenate sorption as monodentate
innerspheric complex, (c) selenite as bidentate innerspheric complex (data from Zhang and Sparks, (1990), Su and Suarez (2000), Peak and Sparks (2002)).
Elemental Se (Se(0)) is hardly soluble and tends to precipitation on mineral surfaces or as nanoparticles. Being different from the other Se species, Se(0) plays a minor role in environmental and biological processes, although Se(0) can be bioavailable to particular organisms and even produced from Se oxyanions by microbials under aerobic and anaerobic conditions (Winkel et al., 2012; Jain et al., 2014).
23
Se’s fully reduced oxidation state, Se(-II), is very reactive and easily incorporates into mineral complexes and organic molecules. Under strongly reducing and acidic conditions it forms gaseous hydrides (H2Se), which is a characteristic property for Se and only shared by few other elements (e.g.
Ge, As, Br, Te, Sb, Bi). The use of this characteristic for analytical purposes is widely applied (e.g. Ribeiro et al., 2004; Rouxel et al., 2004).
2.1.2 Physiological functions
Se is of high environmental significance, because it is an essential nutrient and a toxin for all mammals including human beings (Rayman, 2006). It replaces S by Se in the amino acids methionine and cysteine and therefore forms the different essential amino acids selenomethionine (SeMet) and selenocysteine. These are part of a variety of proteins such as thyroid hormones, enzymes protecting cells from oxidation and free radicals as well as muscle tissue and brain cells (Holben and Smith, 1999; Pillai et al., 2014). Se strengthens the immune system (Rayman, 2006; Brinkman et al., 2006) and detoxifies As(III) and Hg(II) by forming covalent As-Se and Hg-Se bonds (Gailer, 2007; Ralston and Raymond, 2013; Pickering et al., 2014). Clark et al. (1996) reported a preventive effect of Se on cancer, but the universality, the actual causes and the applicability are still controversial, whereby the medical research is very active regarding this issue (Ip, 1998; Marshall, 2014). Several studies reported furthermore the key role of Se in the Human Immunodeficiency Virus (HIV) metabolism, while stating that an adequate Se level retarded the onset of Acquired Immune Deficiency Syndrome (AIDS) and reduced the mortality of the HIV infected patients studied, although the reasons are not fully discovered yet (Semba and Grey, 2001; Baum et al., 2001, Kupka et al., 2004; Sudfeld et al., 2014 and others). On the other hand the replacement of S in amino acid in high amounts can have severe impacts on the functionality of S requiring proteins such as DNA reparing enzymes, tissue structures and functions and neural cells (Moreno-Reyes et al., 1998).
The tolerance range of chronic daily uptake for human beings is on average between 40 and 400 µg, depending on age, weight and gender, whereas the recommended minimum uptake is 70 µg (Figure 3).
24
Figure 3: Relation between daily Se uptake and Se related diseases – thresholds for an average grown-up
person (qualitative image) (data from Moreno-Reyes et al. (1998), Levander and Burk (2006) and Stranges et al. (2010)).
Characteristic Se toxicity symptoms are brittle nails respectively horn and hooves of livestock, hair loss and skin lesions due to a dysfunctional beta-sheet structure in those tissues (Moreno-Reyes et al., 1998; Holben and Smith, 1999) (Figure 4 (a)-(c)). Another characteristic disease is blind staggers, a neurological dysfunction particularly affecting livestock, indicated by an unsteady staggering gait and loss of vision (Moreno-Reyes et al., 1998) (Figure 4 (d)). In plants, excessive uptake might lead to reduced growth and crop failures (Dhillon et al., 2005).
Figure 4: Se toxicity symptoms – (a) brittle horn and hooves (www.upei.ca (10.03.2014)), (b) brittle nails
(Dhillon et al., 2005), (c) hair loss (Fordyce, 2007), (d) blind staggers (www.nature.com (10.03.2014)).
The quantitatively more important issue is Se deficiency. An estimated 0.5 to 1 billion people worldwide are affected from it to a varying extent (Haug et al., 2007). The Keshan disease,
25
discovered in the Chinese province of Keshan and prevailing in China, is a severe consequence of Se deficiency. It is a cardiomyopathy and affects the functionality of the heart muscle (Stone, 2009). Another disease frequently occurring in China is the Kashin-Back disease, named after its discoverers. This type of osteoarthritis particularly affects children and their bone growth, leading to stunted development of the skeleton (Moreno-Reyes et al., 2001) (Figure 5 (a)). Another dysfunction caused by Se deficiency is the White Muscle Disease, which impacts the development of muscles and typically occurs with livestock. It usually affects the leg muscles first, but may expand to any muscle including the heart (Gunes et al., 2010) (Figure 5 (b)). Furthermore, thyroid dysfunctions as well as an increased risk of diabetes were reported to be characteristic consequences of chronic Se deficiency in human beings (Contempre et al., 1992; Stranges et al., 2010).
Aside of severe consequences for humans’ and animals’ health, inadequate Se supply might also cause economic losses in agriculture and livestock farming as well as threatening food security in particular regions.
Figure 5: Se deficiency symptoms – (a) Kashin-Back disease, (b) White Muscle Disease (WMD) (http://drainameducci.blogspot.de, www.upei.ca, www.goatbiology.org (10.03.2014)).
2.1.3 Economic relevance and industrial applications
Exploiting interest and public awareness for Se and its physiological functions (chapter 2.1.2), there is a particular industry branch providing Se supplements and Se fortified food. Public health campaigns address the importance of an adequate Se supply as well. Examples of both are given in Figure 6.
26
Figure 6: (a) Advertisement for Se fortified potatoes Selenella from Italia (www.salvomessina.com (21.07.2015)),
(b) naturally Se enriched potatoes Selena from a Se rich area in Ireland (www.selena.ie (21.07.2015), (c) Se
fortified eggs (www.ocado.com (21.07.2015), (d) health campaign to promote naturally enriched garlic as dietary Se source (www.mhlw.go.jp (21.07.2015)).
Furthermore Se is of high relevance for technical and pharmaceutical applications. Figure 7 shows the industry branches using Se and their fraction of total Se used in industry as well as examples of products containing Se as a key component. For instance, dietary supplementations play an important role for humans and livestock. The semiconducting property of Se is used in electronics and energy production. In glassware, pigments are made from Se to obtain green color. Furthermore Se is applied in metalworking, among other functions as alloy component (www.selenium.de (2011)).
Figure 7: Industrially used Se divided into branches (left), examples of products containing Se (right)
((www.selenium.de – data from 2011)www.bembu.com, www.selenium.de (28.01.2014)).
As there are no particular Se deposits, Se is gained as a byproduct of copper (Cu) mining. Due to the expansion of the renewable energy sector, Moss et al. (2011) expect a global rise in Se demand for photovoltaic systems within the next decades. For that reason the necessity to carefully manage the
27
scarce resource will rise, including the implementation of innovative technology in Se acquisition and recycling in order to sustainably fulfil the global Se demands (Haug et al., 2007).
2.1.4 Distribution in the environment
The relative abundance of Se within the earth crust (<16 km) is 8*10-5% (Bodik et al., 1988) making Se
a trace element. Soil contents are on global average 0.05 ppm and in most waters <0.1 µg L-1. However, due to Se’s redox sensitivity on environmental conditions its distribution is heterogeneous especially on the earth surface, which causes a high range of soil Se concentrations with hot spots of up to 1200 ppm (Dhillon and Dhillon, 2003; Fernández-Martínez and Charlet, 2009). The near surface environment shows a very dynamic Se cycle characterized by redox changes (Figure 8). This applies especially for the Critical Zone, which is characterized by the interaction of lithosphere, pedosphere, hydrosphere, biosphere and atmosphere (US NRC, 2001).
Figure 8: Schematic global cycle of Se with main focus on the terrestrial environment. Blue arrows – process involves oxidation of Se species, green arrows – process involves reduction of Se species. Warning symbols indicate specific environmental settings that are at risk of either developing Se deficiency (open warning
symbol) or Se excess (shaded warning symbol) (Winkel et al., 2012).
Potential geogenic Se sources are generally organic and S rich source rocks such as black shales, carbonaceous limestones, carbonaceaous cherts, mudstones and seleniferous coal. Main anthropogenic sources are fossil fuel combustion and sulphidic ore mining. By exposing Se containing ores to the surface, Se might be mobilized through oxidation (Wang and Gao, 2001; Wen and Qiu,
28
2002; Zhu et al., 2008a). Mobilized Se is distributed via the atmo- and hydrosphere. Potential sinks are lakes, organic and iron rich soils as well as the biosphere in general. When available, Se tends to excessive bioaccumulation and –magnification and therefore high enrichment in organisms (Wu 2004; Winkel et al., 2012). One example for Se excess is the San Joaquin Valley in California, USA. The area is characterized by marine shales as Se rich source rocks and subsequently by Se rich groundwater in adjacent aquifers. Intensive agricultural activities including continuous excessive irrigation with Se rich water from deeper aquifers have led to Se enrichment in soils and plants. Due to consistently low permeable shale layers, Se enriched seepage water can hardly be naturally discharged or diluted. Within the last decades, high amounts of this water were artificially drained and passed into the wetlands of Kesterson National Park. In this area, Se concentrations in water were reported to be 300 µg L-1 on average and 4200 µg L-1 on maximum measured in the late 1980s
(Presser and Ohlendorf, 1987; Fan et al., 1988; Ohlendorf, 2002) and thereby exceeded the WHO drinking water threshold by factor 30 respectively 420 (WHO, 2011). The consequences for the local ecosystem were devastating. Ohlendorf (1986) estimated that 20% of all birds had deformities and 40% of the embryos died before hatching. Deformities and high mortality rates were reported for several fish species as well (Ohlendorf, 2002). In 1986, Kesterson National Park was officially declared as a waste dump and the drain into San Francisco Bay (Pacific Ocean) was closed. However, significant amounts of highly Se contaminated water are still draining into the Pacific Ocean (Ohlendorf, 2002). Since the 1980s until today Kesterson National Park was an object of studies on potential phytoremediation measures concerning Se contaminated ecosystems (e.g. Banuelos and Lin, 2005).
Another example for critical Se accumulation is a region in Eastern Punjab, India, that is characterized by intensive agricultural land use as well. The agricultural land is continuously irrigated with Se rich groundwater having concentrations of average 69.5 µg L-1 and maximum 341 µg L-1. Consequences were the Se enrichment in soils (average 6.5 ppm) and plants (3 – 670 ppm) (Bajaj et al., 2011) clearly exceeding the US EPA threshold of 5 ppm Se for forage (US-EPA, 2000). Crop failures and economic
29
damages could be observed alongside Se toxicity symptoms in the local population (Dhillon et al., 2005). The issue escalated with the change of wheat-maize to wheat-rice rotating cultivation, probably because rice cultivation requires higher amounts of irrigation water and influences the Se retention and mobility with a changing redox environment (Bajaj et al., 2011). Both examples show that the accumulation of Se depends on various factors like source rock Se concentration, redox environment, land use and water management. Furthermore the mineral composition of the soil, the plant species and its affinity to Se as well as climate and hydrological conditions might advance Se accumulation (Winkel et al., 2012).
In areas with low retention potential, for instance caused by low organic content and low sorption potential due to lack of clay minerals and iron oxides, Se tends to be leached out and depleted. In nature, this often occurs simultaneously with low water retention capacity and oxic conditions, which both increasing the mobility of Se (Figure 9). On the contrary, high Se retention potentials in soils with high organic, iron and clay mineral content might immobilize Se in the soil and prevent plant uptake. Furthermore a high water retention capacity might induce stagnating water. Combined with high organic content reducing conditions might arise, which tend to transform Se into the insoluble and hardly bioavailable Se(0) (Sarret et al., 2005; Chakraborty et al., 2010). Wang and Gao (2001) reported a clear coincidence of different factors negatively influencing the bioavailability of Se – low soil Se concentrations, high evaporation rates, slightly acidic pH values and high soil organic content – with the prevalence of Se deficiency disease patterns in China. Particularly in North-Eastern China as well as in parts of Central and South China the local population is affected by Keshan disease, Kashin-Back disease or both. Se deficiency was reported in huge parts of sub-Saharan Africa by Chilimba et al. (2011) and Joy et al. (2014), especially Malawi and Sambia. A combination of low soil Se, low soil pH and high retention potential by mineral composition caused low Se content in local staple food and Se deficiency symptoms in the local population. Due to Se poor source rocks, parts of North-Western and Eastern USA as well as huge parts of Europe are depleted in Se, making Se supplementation necessary particularly for cattle, cows, sheep and horses (Oldfield, 2002) and led to
30
field experiments on Se biofortification on national scale, e.g. in Finland (Alfthan et al., 2015). Figure 9 schematically shows the influence factors and their interaction in Se depletion and accumulation potentially leading to Se deficiency or toxicity.
Figure 9: Scheme of influence factors for Se mobility and the origins of Se related problems (simplified) (circled blue – hydrological conditions, brown – geological and soil properties, purple – pH and redox conditions, green
– Se related processes, red – Se related problems).
Several factors indicate an increase in Se related problems within the next decades. Climate change will probably raise precipitation variabilities and enhance local contrasts in precipitation amounts (IPCC, 2013), which in turn will influence redox conditions, leaching and the composition of soils. Population and space pressure as well as the rising popularity of land as investment possibility (land grabbing) will expand the area of intensively cultivated agricultural land (Taagepera, 2014; Antonelli et al., 2015), which is a critical issue in context of Se as exemplarily reported for San Joaquin and Punjab. Due to economic growth particularly in emerging countries, the demand of metals and energy and therefore mining activities will probably grow (Legarth, 1996; Miller, 2013) and thereby
31
extent the main anthropogenic Se source. That is why the knowledge on environmental Se cycling and the elaboration of solution concepts for Se deficiency and toxicity will gain importance.
An overview about the global Se distribution is given by Oldfield (2002). A detailed review on the global Se cycle is given by Winkel et al. (2012).
2.2
Selenium and plants
2.2.1 Role of plants
As described in chapter 2.1.4, Se is a biophilic element, which tends to accumulate in the biosphere and to magnify along the food chain (Wu, 2004). Plants are bottlenecks for the entrance of Se into the biosphere (Figure 10) and therefore key objectives for the investigation of Se pathways and management of adequate Se supply of humans and animals. Plant foods are the major dietary Se source in most countries, followed by meat and fish. Drinking water plays a minor role (US-NIH, 2013).
32
Figure 10: Simplified scheme of Se entering and transport into the food chain via plants and bioaccumulation along the food chain.
Various parameters influence the uptake of Se into plants, the soil concentration is only one of them (Ellis and Salt, 2003; Winkel et al., 2012) (Figure 9). Se underlies active uptake mechanisms by nutrient transporters and transformation processes such as reduction and incorporation within the plants. The role of Se in plants is not fully investigated yet. It is probably not essential, but might fulfill several functions such as protection against certain (a)biotic stresses in moderate concentrations (Hasanuzzaman et al., 2014), but leads to phytotoxicity in high concentrations (Dhillon et al., 2005). Plants take up Se via macronutrient transporters and include it into their tissue or emit it to the atmosphere (Li et al., 2008). The oxidation state of Se plays a major role in forming bindings and species, and those determine uptake, translocation and accumulation pathways. Furthermore, the role of the plant species is important, because those significantly differ regarding
33
uptake, accumulation and volatilization affinity. This chapter presents the common sense of Se transport and transformation pathways related to plants and regarding various influence factors.
2.2.2 Se uptake and translocation processes
The processes of Se uptake and translocation by plants dependent on source species were investigated by several studies using cultivation experiments. Many of them focussed on Se non-accumulator plants that are frequent as agricultural crops, e.g. maize, rice and wheat. As they are frequent in nature and most relevant for plant uptake, the Se oxyanions selenate and selenite as well as the organic species and amino acid SeMet were regarded. Table 1 shows experimental parameters and translocation factors (T) of the studies mentioned. The translocation factors were calculated via the absolute Se amounts measured in the plant parts (a(Se) [µg]) according to Equation (1).
= ( )
( ) (1)
Table 1: Overview over selected studies on cultivation of Se non-accumulator plants with varying Se concentrations, growth media and cultivation times and their results concerning translocation (translocation
factor according to Equation (1)) (volatilization was neglected in all studies)
Kikkert and Berkelaar (2013) Nothstein (2015) Longchamp et al. (2015)
cultivated plant wheat rice maize
Se supplied (µg L-1) 40 - 400 250 1000
growth medium soil + optimum nutrient
supply phytoagar + no nutrients optimum nutrient solution
cultivation time 300 min (5 h) 16 days (384 h) until maturity (~6 mon)
(>4000 h)
Translocation factor
selenate supply >1 4.6 13.3
selenite supply <0.1 0.5 0.6
SeMet supply 0.25 - 0.75 N/A N/A
Figure 11 schematically shows the absolute Se uptake and translocation depending on the source species as well as the average species distribution in roots and shoots. Thereby, selenate and selenite illustrations contain average values of Kikkert and Berkelaar (2013), Nothstein (2015) and Longchamp et al. (2015) and the SeMet image is based on Kikkert and Berkelaar (2013) as the only study
34
investigated SeMet uptake. The Se species distribution within the plants derives fromKahakachchi et al. (2004). The figure only gives a qualitative impression as the studies differ in framework conditions such as growth medium, Se concentration supplied, cultivation time and plant species. Nevertheless tendencies are recognizable that correspond with previous studies (e.g. Zayed et al. (1998), Li et al. (2008), De Souza et al. (1998)).
Figure 11: Schemes of Se distribution and species abundances in different plant parts according to Longchamp et al. (2015), Kikkert and Berkelaar (2013), Nothstein (2015) (wheat, maize, rice) and Kahakachchi et al. (2004) (Brassica) (Table 1). The blue circle parts represent the selenate fraction, the red ones the selenite fraction, the
green ones organic Se species, mainly SeMet.
All presented studies agreed that selenate had the highest uptake and translocation among all supplied Se species (Longchamp et al. (2015), Kikkert and Berkelaar (2013), Nothstein (2015), Zayed et al. (1998), Li et al. (2008), De Souza et al. (1998)). Reasons are on the one hand the high amount of sulphate transporters via which selenate is taken up (Li et al., 2008), on the other hand the high thermodynamic stability of selenate and therefore low affinity to species transformation or retention (chapter 2.1.1 and 2.1.4). As a consequence, selenate is very affine to enter the plant and being translocated within it. The species distribution in plants, reported by Kahakachchi et al. (2004), shows that the very dominant fraction was still available as selenate, which applies even more for shoots than for roots (Figure 11 left). This confirms the idea of Gissel-Nielson (1984) that selenate mainly
35
remains in this species while transported to the shoots whereas Se taken up as selenite is quickly transformed and transported as organically bound Se. That the entire residual Se could be identified as organic Se compounds, mainly SeMet (Kahakachchi et al. (2004)), indicates that selenite, which is a mandatory intermediate in the reduction and transformation of selenate to organic Se species, is indeed very unstable within the plant and affine to reduction and organic incorporation. The selenite supplementation setups confirm this assumption as almost 96% of the selenite taken up was found as organically bound Se in the plants (Figure 11 center) (Kahakachchi et al. (2004)). Additionally, the uptake rate of selenite was - by far - lower than this of selenate or SeMet, and the translocation rate was very low in relation to selenate and SeMet (Longchamp et al. (2015), Kikkert and Berkelaar (2013), Nothstein (2015), Zayed et al. (1998), Li et al. (2008), De Souza et al. (1998)). This might depend on the uptake mechanism, which is not as clearly identified as the one of selenate. Li et al. (2008) proved that it was an active uptake process and they assumed that it was probably taken up by phosphate transporters due to their abundance and the chemical similarity of selenite and phosphate, whereas Zhao et al. (2010) hypothesized that it might be taken up by silicon transporters. However, the more probable reason for the lower uptake and translocation rates is the quick transformation of selenite into organic Se, its incorporation into the plant tissue (Figure 11 center) (Kahakachchi et al. (2004); De Souza et al. (1998); Li et al. (2008)) and therefore the retention of the major fraction within the roots. The small fraction translocated was mainly transformed into organic species before translocation (Gissel-Nielson (1984); Kahakachchi et al. (2004); De Souza et al. (1998)). Nothstein (2015) however reported that selenate supplied rice plants stored 38-54% in organic form with minor differences between roots and shoots, whereas selenite supplemented rice plants stored 85-100% as Seorg in the roots and 64-80% in the shoots respectively.
Data on the transport pathways of Se in plants supplied with organic species is sparse although organic Se is frequent in the environment and almost 100% available as SeMet there and within non-accumulator plants (Li et al., 2008, Neal 1995). According to Sandholm et al. (1973) SeMet is taken up via amino acid transporters and therefore only competes with the amino acid methionine. In short
36
term experiments (300 min exposure) with wheat the uptake rates were detected 40-100 times higher than for anorganic Se species and the shoot concentrations were highest, too. In contrast to selenate and selenite supplied plants, SeMet was evenly distributed between roots and shoots (Kikkert and Berkelaar, 2013). The uptake rates as well as the bioavailability and the affinity for incorporation are very high, which leads to both – incorporation into the roots and translocation followed by incorporation into the shoots.
The tendencies are similar in those three studies, although they use different growth media, cultivation times, supplied Se concentrations and plant species. The translocation factor of selenate increases with extended cultivation time and Se concentration, which might be a result of higher phytomass growth rates in shoots compared to roots and with limited interaction of selenate with the root tissue. Selenite was generally mainly stored in the roots and hardly translocated, but with increasing cultivation time and Se concentration the translocation factor rises probably due to rate limiting steps for reduction and incorporation and therefore backlog effects.
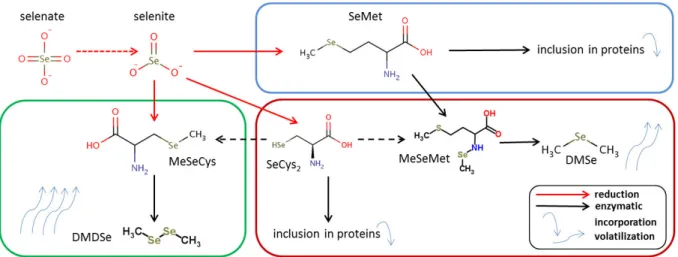
On the molecular level, Mounicou et al. (2006) reported that the roots contained mainly high molecular weight Se molecules, which are less mobile and mainly the product of Se incorporation into the plant tissue or formation of proteins, whereas the leaves contained low molecular weight Se molecules, which are the more mobile inorganic species, especially selenate, as well as small and soluble organic compounds such as SeMet that were not incorporated yet and might partly be transformed to volatile species such as methylselenides (chapter 2.2.4).
2.2.3 Se accumulating plants
When characterizing Se uptake and accumulation as well as the accompanying metabolic pathways, three types of plants are commonly differentiated: the non-accumulators, the secondary accumulators and the hyperaccumulators. Concerning Se species distribution, the main difference is the varying character and composition of organic Se compounds.
Chapter 2.2.1 deals with non-accumulating plants, which are most frequent and most important for agriculture, e.g. rice, maize and wheat. They accumulate the biophilic Se in moderate amounts
37
compared to the other plant types. As selenite and the minor fraction of selenate is directly transformed into the amino acid SeMet and then included into proteins, effectively the entire organic Se is available as solved SeMet or, in lower amounts, SeCys2, as water soluble non protein
forms (e.g. methylselenomethionine) or as protein part, with a clear dominance of SeMet (Mounicou et al., 2006, Neal 1995). Mounicou et al. (2006) additionally reported that non-accumulator plants contained higher ratios of Se bearing proteins than secondary or hyperaccumulating plants, probably due to the lack of Se exclusion mechanisms from plant metabolism.
Secondary accumulators, e.g. Brassica juncea, accumulate high amounts of Se if present, but they do not have competitive advantage on Se rich sites and lacking Se does not impair their growth and development (USDA, 2014). Secondary accumulators contain a variety of organic Se species. The amino acids SeMet and SeCys2 were found in similar proportions (Mounicou et al., 2006). Moreover,
up to 50% of the total organic Se species were characterized as water soluble non protein forms, mainly methylselenomethionine. Other studies assumed that the transformation of SeMet to methylselenomethionine and the further transformation to the volatile species dimethylselenide (DMSe) was an active mechanism to exclude Se from the plant tissue and therefore enhance the Se tolerance (Neal 1995, Tagmount et al. 2002, Goa et al. 2000).
Hyperaccumulators (or primary accumulators), e.g. Astralagus bisulcatus, Stanleya pinnata, accumulate exceptionally high amounts of Se. By early Se accumulation and due to particular strategies for tolerating high Se amounts, they are perfectly adapted to Se rich areas and more competitive than Se sensitive plants. Additionally a herbicide effect due to high Se emissions was reported (El Mehdawi et al., 2011). In hyperaccumulator plants, selenite is directly transformed to methylselenocysteine instead of SeMet. Methylselenocysteine cannot be incorporated into the plant tissue. It is directly transformed into the volatile dimethyldiselenide (DMDSe) and emitted into the atmosphere (volatilization) (LeDuc et al. (2004)). DMDSe contains two Se atoms, which ensures a more efficient Se emission than the formation of DMSe by secondary accumulators. However, both accumulator types are characterized by active Se exclusion mechanisms based on volatilization.