Performance Evaluation of Academic Libraries
Implementation Model
Luiza Baptista Melo
CIDEHUS – UE and Libraries of the Faculty of Science, University of Porto (Applied Mathematics and Botanical Departments)
Rua do Campo Alegre, 687, 4169-007 PORTO – Portugal- E-mail: [email protected]
Cesaltina Pires
CEFAGE-UE and Management Department of University of Évora
Largo dos Colegiais, nº 2, 7000-803 ÉVORA – Portugal- E-mail: [email protected]
Abstract
This paper describes an action model to measure the performance of libraries.
The proposed model is based in the CAF – Common Assessment Framework, the Balanced Scorecard and the Analytic Hierarchy Process (AHP). The recommended performance indicators are based in the ISO 11620:1998, Adm1:2003and ISO 2789:2003.
The relative weights for each performance measure are calculated using the AHP. The AHP computes the weights of the performance measures in two steps:
• Comparing (pairwise) the performance measures under each criterion;
• Comparing (pairwise) the major criteria of the proposed model.
The main purpose of this model is to improve the performance of libraries and to develop benchmarking techniques.
The model was tested using the opinion of ten university librarians. According to the data, the most important criteria, by decreasing order of importance, are: customer satisfaction, impact on society, leadership and financial perspective.
Key Words: Academic library, evaluation, assessment, service quality, CAF, Balanced Scorecard, Analytic Hierarchy Process
Introduction
Academic libraries’ services have changed very fast in the last twenty years. Nowadays, electronic resources, networks and the World Wide Web represent a large fraction of the library and information services. Academic libraries “must also be able to demonstrate the value of what they are doing and provide evidence of the impact that they are making” (Payne, 2005), so that it is important to use methods to find assessment data. Librarians must manage staff, information in several supports, and technical activities to
produce quality services. Quality services mean resources and services that satisfy the user’s expectations (Parasuraman et al., 1985).
This article proposes a framework to evaluate the performance of academic libraries. This framework is quite versatile and it can easily be adjusted to be implemented in other types of libraries (public libraries, university libraries documentation and information centers). The purpose of this study is to present a model to measure the contribution of the academic library to the institution where it belongs and to the society. The final output of our model is a global performance measure. To compute this global performance measure, the institution has to choose the set of criteria that should be taken into account in the performance evaluation and their relative weights. In addition, the institution needs to choose the set of performance indicators that should be used to measure each criterion and their relative importance in that measure. As it will became clear latter, the dialogue among the staff, the users of the academic library, and external librarians is extremely important in the assessment process. The choice of criteria and indicators and the weights given to each criterion or to each indicator are the outcome of a participative performance evaluation process.
Our model proposes a set of criteria and indicators which are relevant to measure performance in academic libraries and it proposes a method which can be used to determine the weights of each criterion or indicator. The proposed set of criteria is based on the Common Assessment Framework (CAF) (European Institute of Administration, 2006) and the Balanced Scorecard (BSC) (Kaplan & Norton, 1992). The set of criteria includes enablers and results (as define in CAF). In addition, it assumes the four Balanced Scorecard dimensions: user perspective, internal process perspective, financial perspective and learning/growth perspective. The recommended performance indicators are based on the ISO 11620:1998 (International Organization for Standardization, 1998), Adm1:2003 (International Organization for Standardization, 2003a), and ISO 2789:2003 (International Organization for Standardization, 2003b).To determine the weights of each criterion or indicator, our innovative model resorts to the Analytic Hierarchy Process (AHP) (Saaty, 1990). This process helps us to determine the relative importance of each performance indicator (in each criterion measurement) and the relative importance of each criterion (in the global performance evaluation).
The paper is organized as follows: In the next section we present an overview of the CAF and Balanced Scorecard models and the Analytic Hierarchy Process. In the following section we describe the different perspectives define in the proposed model supported in CAF and BSC and the corresponding associated performance indicators. Section 4 describes the implementation of the model and discusses the results. Finally, we present the conclusions.
1. The Building Blocks of the Model: an overview 1.1 CAF – Common Assessment Framework
The first version of the CAF was presented in May 2000 during the First European Quality Conference for Public Administrations held in Lisbon. This management quality tool is based on the European Foundation for Quality Management Excellence
Model (European Foundation for Quality Management, 2006) that is composed of nine
policy and strategy, external partnerships and resources and process and change management. The set of results involves: people results, customer oriented results, impact on society and key performance results. The assessment of each criterion develops into several sub-criterions. The global CAF structure is composed of 32 issues. These issues are the sub-criterions that are systematically evaluated using a scale, with six points, illustrated in table 1, for enablers, and table 2 for results (European Institute of Public Administration, 2006).
Table 1 - Assessment Scale of the Model CAF for Enablers (European Institute of Public Administration, 2006) S c o re E n a b le r s 0 N o e v id e n c e o r o n ly a n e c d o ta l e v id e n c e o f a n a p p ro a c h . 1 A n a p p ro a c h is p la n n e d P (p la n ) . 2 A n a p p ro a c h is p la n n e d a n d im p le m e n te d D ( d o ) 3 A n a p p ro a c h is p la n n e d im p le m e n te d a n d re v ie w e d C (c h e c k ) . 4 A n a p p ro a c h is p la n n e d im p le m e n te d a n d re v ie w e d o n th e b a s is o f b e n c h m a rk in g d a ta a n d a d ju s te d a c c o r d in g ly A (a c t) . 5 A n a p p ro a c h is p la n n e d im p le m e n te d re v ie w e d o n th e b a s is o f b e n c h m a rk in g d a ta a d ju s te d a n d f u lly in te g ra te d in to th e o rg a n is a tio n .
Table 2 - Assessment Scale of the Model CAF for Results (European Institute of Public Administration, 2006) S c o r e R e s u lt s 0 N o re s u lt s a re m e a s u re d . 1 K e y re s u lts a r e m e a s u r e d a n d s h o w n e g a tiv e o r s ta b le tr e n d s . 2 R e s u lts s h o w m o d e s t p ro g r e s s . 3 R e s u lts s h o w s u b s ta n t ia l p ro g r e s s . 4 E x c e lle n t re s u lts a r e a c h ie v e d a n d p o s it iv e c o m p a r is o n s to o w n ta r g e ts a r e m a d e . 5 E x c e lle n t re s u lts a r e a c h ie v e d p o s itiv e c o m p a r is o n s to o w n ta rg e t s a re m a d e a n d p o s itiv e b e n c h m a r k s a g a in s t r e le v a n t o r g a n is a tio n s a r e m a d e .
It is interesting to observe that this scale identifies the PDCA circle (Bank, 1998) created by W. Edward Deming, in 1950. The meaning of the PDCA circle is plan, do, check and act.
1.2 Balanced Scorecard (BSC)
Balanced Scorecard (Kaplan & Norton, 1992) is a performance management model to assess organizations. This tool expresses the organization’s strategy and vision using four important issues: financial perspective, internal process perspective, innovation and learning perspective and customer perspective (Kaplan & Norton 1996).This evaluation technique establishes a balance between organization vision, performance indicators, goals and implementation actions versus financial perspective, internal process perspective, innovation and learning perspective and customer perspective that can be represented in a scorecard (Kaplan & Norton, 2004).
1.3 Analytic Hierarchy Process (AHP)
The Analytic Hierarchy Process (AHP), developed by Thomas L. Saaty (1990), is a multiple criteria decision technique. When a decision maker has to choose among several alternatives and there are multiple criteria which are relevant for the decision maker, it may be quite difficult for the decision maker to establish the relative importance of each criterion and/or to evaluate how good is each alternative relatively to each criterion. The AHP is a methodology which helps the decision maker in determining the value of each alternative, and the weights of each criterion. There are thousands of applications of AHP to complex decision problems (Saaty, 1990; Anderson, D.R. et al.; 1998; Saaty, 2000).
It turns out that the AHP can be useful in the library performance measurement. The main purpose is to find the weight of each performance indicator using the AHP. The AHP computes the weights of the performance measures in two steps ( Anderson, D.R.
et al., 1998):
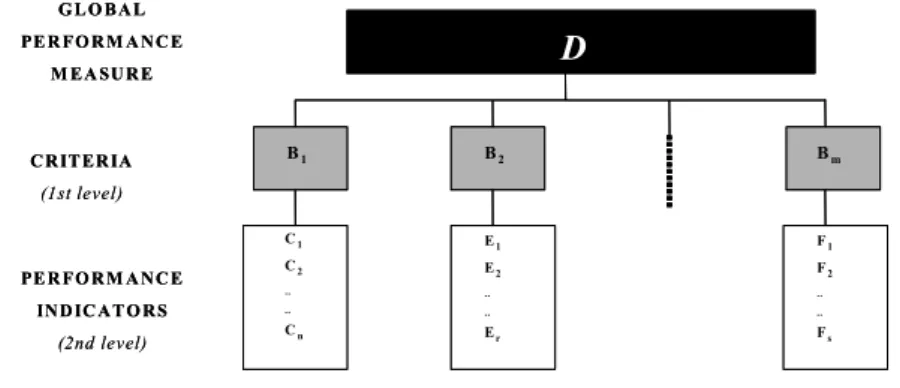
1. The first step designs a hierarchic structure (see figure 1), with the various criteria used in the performance evaluation and the associated performance indicators. 2. The second step determines the weights at each hierarchy level. The analysis starts
at the lower hierarchy level (determine the weight of each indicator in the evaluation of a certain criterion). Next the upper hierarchy level is analyzed (determine the weight of each criterion in the global performance measure).
Figure 1 - Hierarchy Analyse of the problem D
The technique proposed by Saaty has two very important insights: (i) the idea that decomposing the global problem into a hierarchy of simpler problems simplifies the task of analyzing the problem. (ii) The idea that it is easier to compare pairwise criteria
G LO BA L PE R FO RM AN C E M EA SU RE C R IT ER IA (1st level) PE R FO R M A NC E INDIC ATO RS (2nd level) D B1 B2 Bm C1 C2 .. .. Cn E1 E2 .. .. Er F1 F2 .. .. Fs G LO BA L PE R FO RM AN C E M EA SU RE C R IT ER IA (1st level) PE R FO R M A NC E INDIC ATO RS (2nd level) D B1 B2 Bm C1 C2 .. .. Cn E1 E2 .. .. Er F1 F2 .. .. Fs
(or indicators) than to give weights. This explains why the second step is based on pairwise comparisons.
Lower hierarchy level study – determining the weight of each indicator in a given criterion
The lower hierarchy level study has the following steps:
Construction of pairwise comparison matrix;
Synthesis; and
Consistency ratio estimation.
Pairwise comparison matrix
To find the weights of each criterion/indicator it is necessary to construct a matrix providing judgments about the relative importance between pairs of elements in each hierarchy (see table 3).
Table 3 – Criteria Pair Comparison Matrix concerning AHP for criterion B1
C1 C2 ... Cn C1 1 12 a ... n a1 C2 12 21 1a a = 1 ... a2n ... ... ... 1 ... Cn n an a 1 1= 1 n n a a 2 2 = 1 ... 1
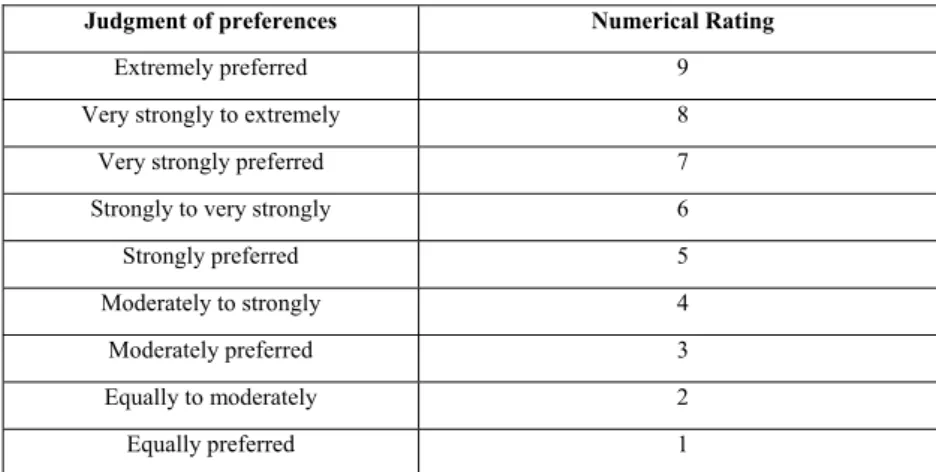
Saaty established a scale to compare each pair of criteria/indicator, the scale proposed is represented in table 4 (Anderson, D.R. et al., 1998).
Table 4 – Pairwise comparison scale for AHP preferences used in confront between the criteria and performance indicators ( Anderson, Sweeney & Williams, 1998
Judgment of preferences Numerical Rating
Extremely preferred 9
Very strongly to extremely 8
Very strongly preferred 7
Strongly to very strongly 6
Strongly preferred 5
Moderately to strongly 4
Moderately preferred 3
Equally to moderately 2
Equally preferred 1
Table 5 represents the performance indicators pair comparisons matrix concerning AHP for criterion B1, where aij is the quantitative judgment between the performance
indicator Ci compared with the performance indicator Cj and are define the following
rules:
a) If aij = α, then aji = 1/ α, α ≠ 0
b) aii = 1, for all i.
This procedure is repeated for all the other criteria (B2, B3,…, Bm).
Table 5 – The normalized pairwise comparison matrix to the criterion B1 concerning AHP methodology
C1 C2 ... Cn C1
∑
= = n i i a 1 1 11 1 a∑
= = n i i a a 1 2 12 12 a ...∑
= = n i in n a a 1 1 1n a C2∑
= = n i i a a 1 1 21 21 a∑
= = n i i a 1 2 22 1 a ...∑
= = n i in n a a 1 2 2n a ... ... ... ... ... Cn ∑ = = n i i n a a 1 1 1 n1 a ∑ = = n i i n a a 1 2 2 n2 a ...∑
= = n i in a 1 nn 1 a SynthesisAfter developing the matrix of pairwise comparisons, we can estimate the relative weigh of each performance indicator. This estimation is done in three steps:
1 - Estimate the total of each column of the pairwise comparison matrix;
2 - Divide each element in the pairwise comparison matrix by its column total. The resulting matrix is the normalized pairwise comparison matrix (see table 5).
Table 6 - RI values are function of the number of elements being compared n (Anderson, Sweeney &
Williams, 1998)
1 2 3 4 5 6 7 8 9 10
0 0 0,58 0,90 1,12 1,24 1,32 1,41 1,45 1,51
3 - Calculate the average of the elements in each row of the normalized pairwise comparison matrix. The result is the priority vector that gives the relative weight of each performance indicators in the measurement of criterion B1. The priority vector has
n ω ω ω ... 2 1
Where ωi is the weight of the performance indicator Ci and it is equal to the average of the elements in row i of the normalized pairwise comparison matrix.
n n
j ij
i = ∑ =1 a
ω (1)
Using these weights, we can now estimate the value of criterion B1: ∑ = = n i iCi B 1 1 ω (2)
This process is repeated for all established criteria (B1, B2,..., Bm). Consistency ratio estimation
The AHP recommends the estimation of a value called the consistency ratio
(Anderson, D.R. et al., 1998; Saaty, 2000). The consistency ratio measures the consistency of the pairwise comparison judgments. In other words, this step evaluates the quality of the judgments established in the pairwise comparison matrix. Since the final weights depend on the pairwise comparison matrix, it is important to guarantee that the degree of inconsistency among the pairwise comparisons is relatively small. It is admitted that a ratio exceeding 0.10 is indicative of inconsistent judgments. Values of consistency ratio of 0.10 or less are considered reasonable. When the consistency ratio is above 0.10, the pairwise comparisons matrix needs to be re-evaluated so as to reduce the degree of inconsistency.
The consistency ratio estimation develops in four steps ( Anderson, D.R. et al., 1998): 1 – Multiply each column element of the pairwise comparison matrix by the relative priority of each item considered. Sum the values across the rows to calculate the
weighted sum vector.
× 1 ... ... 1 ... ... ... 1 ... 1 2 1 2 21 1 12 n n n n a a a a a a n ω ω ω ... 2 1 = = = = ∑ ∑ ∑ = = = j n j j n j n j j j n j j w a aw w a aw w a aw 1 1 1 2 2 1 1 1 ...
Weighted sum vector
2 – Divide the value of each weighted sum by the corresponding priority value. The average of these values is define as λmax.
n aw n j j j ∑ = = 1 max ω λ (3)
3 - Calculate the consistency index (Saaty, 1990), which is defined as:
(
)
1 max − − = n n CI λ (4)RI CI
CR= (5)
where RI – Random index, is the consistency index of a randomly generated pairwise comparison matrix. The values of RI depend on the number of elements being compared (see table 6).
As mentioned before, a consistency ratio above 0.10 indicates unreasonable inconsistency in the pairwise comparisons. Thus this matrix has to be re-evaluated and the procedure has to be repeated till the consistency ratio is acceptable.
Upper hierarchy level study – determining the weights of each criterion in the global performance measure
The upper hierarchy study estimates the Global performance measure (D) as a weighted average of the criteria (B1, B2, B3, ..., Bm). This estimation involves three steps
(construction of pairwise comparison matrix, synthesis, and consistency ratio estimation) and it is similar to the lower hierarchy level study.
In summary, the Global performance measure (D) (Melo, 2005) is estimated taking into account m q q q ... 2 1
the priority vector
and the value of each criterion.
m mB q B q B q D= 1 1+ 2 2+...+ (6) ∑ = = m i qiBi D 1 (7)
2. Selecting the criteria and performance indicators 2.1 Working with both models CAF and BSC
As mentioned above, the set of criteria proposed in our model is based simultaneously in:
- The Common Assessment Framework (CAF) (European Institute of Public Administration, 2006), which has been used to evaluate the services’ performance in the European Union Public Administration; and,
- The Balanced Scorecard (BSC) (Kaplan & Norton, 1992), which has been used in several projects to assess academic library performance, such as: Library University of Münster, in Germany (Poll, 2001), and for public libraries in Carlsbad City, CA, United Stats of America (Matthews, 2005).
We decided to use an integrated model, which captures the advantages of BSC perspectives and CAF criteria. This model, is an adaptation from BSC/EFQM (Andersen, Lawrie & Shulver, 2000). The relationship between CAF and BSC makes our method stronger because it brings to the assessment process the following issues:
• The library’s balanced scorecard translates the interests of the institution by examining the library strategy and vision using four perspectives which represent the different facets of the performance linked together by cause and effect. Since different libraries may have different visions and strategies, the outcome of this
process depends on the library being evaluated. On the contrary, CAF is independent of the library, the set of predefined criteria and measurement areas are the same for all the organizations. This model provides data to use benchmarking techniques;
• Balanced scorecard identifies a set of priorities that the librarian team believes will deliver strategy. CAF gives a comprehensive description and assessment of how processes runs into the library and are managed and performance;
• The BSC is built around a vision for what the library wants to achieve 2-5 years in future. CAF outcomes describes the current state of the library’s process;
• The BSC model does not search the quality of processes and activities today. On the other hand CAF encourages continuous improvement across services and resources library; and,
• Environment and impact on the society is an explicit part of CAF model and therefore any self-assessment is going to provide feedback on this dimension, however BSC does not assume systematically these dimensions.
2.2 Criteria and performance indicators
The implementation of a performance evaluation model is not an easy task. It is necessary to break certain concepts and inertia and to stimulate team work. One of the purposes of the performance evaluation is to involve the various elements of the institution in the functional and process analysis of the organization. A benefit of this procedure is the exchange of knowledge between all the participants and between similar organizations (Cullen, 2003). The performance evaluation program is successful if it provides a practical management organizational model that leads to a continuous improvement change.
Our model has great flexibility in the evaluation scale because it is based on CAF criteria (European Institute of Public Administration, 2006) and Balanced Scorecard perspectives (Kaplan & Norton, 1992). All proposed criteria and perspectives are converted into the respective performance indicators, defined for ISO11620:1998, 1adm:2003 (International Organization for Standardization, 2003a) and ISO 2789:2003 (International Organization for Standardization, 2003b).
3. Model implementation 3.1 Methodology
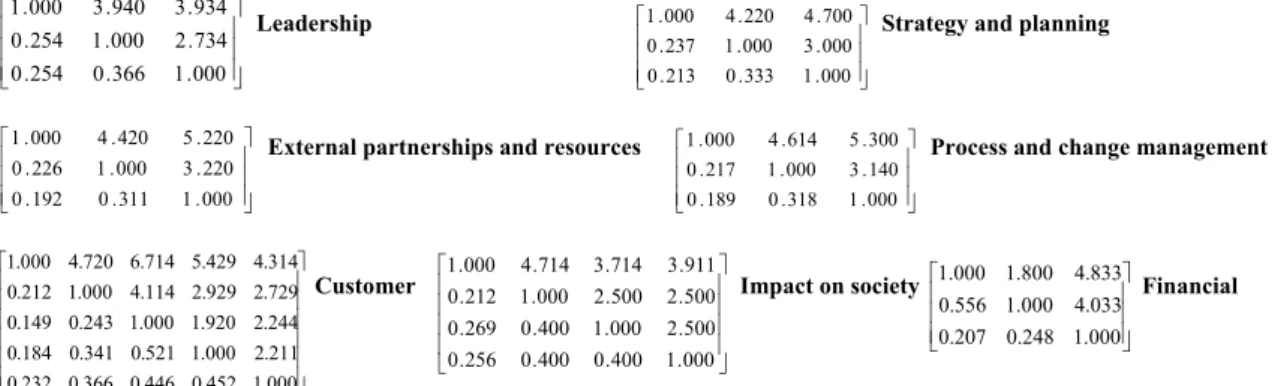
In order to show how our model can be implemented we conducted an inquiry to ten academic librarians (nine Portuguese and one Brazilian), from different universities (Universidade Católica Portuguesa - Braga, Universidade do Porto, Universidade Lusíada de Famalicão, Instituto Politécnico do Porto, Universidade Nova de Lisboa, Universidade do Algarve, Universidade da Madeira and Universidade dos Açores from Portugal and Universidade de São Paulo from Brazil). These ten librarians performed pairwise comparisons between the various performance indicators of each criterion, and pairwise comparisons between the various criteria. In other words, each librarian had to indicate his/her own pairwise comparison matrices. The opinions of the ten librarians were latter on aggregated (for each pairwise comparison we computed the average of the ten librarian values). The various performance indicators average pairwise comparison matrices are the following (to the lower hierarchy level study – determining the weight of each indicator in a given criterion):
000 . 1 366 . 0 254 . 0 734 . 2 000 . 1 254 . 0 934 . 3 940 . 3 000 . 1 Leadership 000 . 1 333 . 0 213 . 0 000 . 3 000 . 1 237 . 0 700 . 4 220 . 4 000 .
1 Strategy and planning
000 . 1 311 . 0 192 . 0 220 . 3 000 . 1 226 . 0 220 . 5 420 . 4 000 .
1 External partnerships and resources
000 . 1 318 . 0 189 . 0 140 . 3 000 . 1 217 . 0 300 . 5 614 . 4 000 .
1 Process and changemanagement
000 . 1 452 . 0 446 . 0 366 . 0 232 . 0 211 . 2 000 . 1 521 . 0 341 . 0 184 . 0 244 . 2 920 . 1 000 . 1 243 . 0 149 . 0 729 . 2 929 . 2 114 . 4 000 . 1 212 . 0 314 . 4 429 . 5 714 . 6 720 . 4 000 . 1 Customer 000 . 1 400 . 0 400 . 0 256 . 0 500 . 2 000 . 1 400 . 0 269 . 0 500 . 2 500 . 2 000 . 1 212 . 0 911 . 3 714 . 3 714 . 4 000 . 1 Impact on society 000 . 1 248 . 0 207 . 0 033 . 4 000 . 1 556 . 0 833 . 4 800 . 1 000 . 1 Financial
The criteria average pairwise comparison matrice is the following (to the upper hierarchy level study – determining the weights of each criterion in the Global performance measure (D)): 000 . 1 000 . 3 000 . 3 000 . 1 500 . 0 000 . 3 333 . 0 333 . 0 000 . 1 000 . 3 333 . 0 000 . 3 000 . 2 000 . 5 333 . 0 333 . 0 000 . 1 000 . 4 000 . 4 000 . 5 000 . 7 000 . 1 000 . 3 250 . 0 000 . 1 000 . 1 500 . 0 250 . 0 000 . 2 333 . 0 250 . 0 000 . 1 000 . 1 333 . 0 200 . 0 333 . 0 500 . 0 200 . 0 000 . 2 000 . 3 000 . 1 333 . 0 000 . 3 200 . 0 143 . 0 000 . 4 000 . 5 000 . 3 000 . 1
Using the aggregated pairwise comparison matrices, we finally computed the weights that reflect the group opinion, using the AHP. Table 7, presents the relative weights, for each performance perspectives to academic libraries, computed with the mixed-methods CAF-BSC and AHP (Melo, 2005). Table 8 indicates the relative weights for each performance indicator, consistency ratios and relative weight of each performance indicator on the Global performance measure (D) calculated with the same methodology.
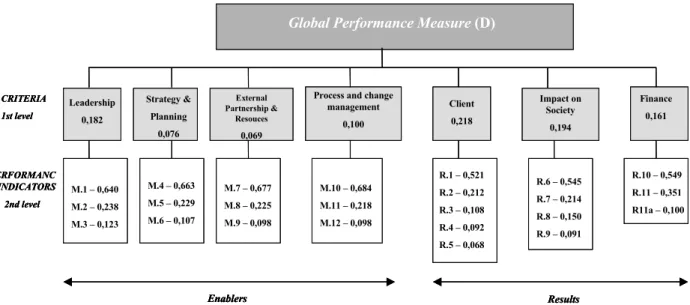
Figure 2 uses the hierarchic structure of the AHP and shows how, the inquired librarian, weight the different criteria used to compute the Global performance measure (D), and how they weight the various performance indicators used to evaluate each criterion. The calculations were estimated with the software Excel for Windows.
Table 7 – The relative weights of the performance perspective measures to academic libraries
Perspective Relative Weight
Leadership 0.182
Strategy and planning 0.076
External partnerships 0.069
Process and change management 0.100
Customer 0.218
Impact on society 0.194
Table 8 – The relative weights of the performance indicators to academic libraries, consistency ratio estimation and relative weight of performance indicator on D
Performance Indicator (PI)
Relative Weight in the criterion (PI) Consistency Ratio (PI) Relative weight of the Perspective measure Consistency Ratio criteria Relative weight of performance indicator on D M.1 The development and formulation
of a vision and a mission (what are our goals) of the library
0.640 0.116
M.2 The development of an organisational structure in accordance with the tasks of library
0.238 0.043
M.3 The promotion and training to improvement the activities
0.123
0.0996 0.182
0.220
M.4 The systematic gathering information about the needs and
expectations of the users
0.663 0.050
M.5 The reorganisation and improvement strategies and methods
of library activities
0.229 0.017
M.6 The development and applying methods to measure the library
performance and
benchmarking
0.107
0.0966 0.076
0.008
M.7 Number of monographs. e-books
journal and e-journals 0.677 0.047
M.8 Opening hours for a week 0.225 0.016
M.9 The identification of strategic partners and the
nature of the relationships
0.098
0.0991 0.069
0.007
M.10 Median time of document
acquisition 0.684 0.068
M.11 Median time of document
retrieval from Open Access Area 0.218 0.022
M.12 To assess market penetration of electronic service
0.098
0.0998 0.100
0.010
R.1 Library visits per capita 0.521 0.114
R.2 Loans per capita 0.212 0.046 R.3 Overall user satisfaction
(between 0 -5) 0.108 0.024
R.4 Overall staff satisfaction (between 0 - 5) 0.092 0.020 R.5 Levels of absenteeism or sickness 0.068 0.0962 0.218 0.015
R.6 Rate of the students success (for example number of students that
get the graduation per year)
0.545 0.106
R.7 Rate of professors and
researchers publication 0.214 0.042
R.8 Rate of the staff library participation in internal discussion groups. international professional
meetings with senior Librarians. etc.
0.150 0.029
R.9 The degree of compliance with environmental principles (for ex. The energy saving. the reduction of waste and packaging. the use of recycled
material)
0.091
0.0998 0.194
0.018
R.10/R.11 Cost per user
(professor / student) 0.549 / 0.351 0.088 / 0.057
R. 12 Cost per library visit 0.100
0.0159 0.161
0.0038
Global Performance Measure (D) CRITERIA 1st level PERFORMANC E INDICATORS 2nd level Leadership 0,182 Strategy & Planning 0,076 External Partnership & Resouces 0,069
Process and change management 0,100 Client 0,218 Impact on Society 0,194 Finance 0,161 M.1 – 0,640 M.2 – 0,238 M.3 – 0,123 M.4 – 0,663 M.5 – 0,229 M.6 – 0,107 M.7 – 0,677 M.8 – 0,225 M.9 – 0,098 M.10 – 0,684 M.11 – 0,218 M.12 – 0,098 R.1 – 0,521 R.2 – 0,212 R.3 – 0,108 R.4 – 0,092 R.5 – 0,068 R.6 – 0,545 R.7 – 0,214 R.8 – 0,150 R.9 – 0,091 R.10 – 0,549 R.11 – 0,351 R11a – 0,100 Enablers Results
Global Performance Measure (D)
CRITERIA 1st level PERFORMANC E INDICATORS 2nd level Leadership 0,182 Strategy & Planning 0,076 External Partnership & Resouces 0,069
Process and change management 0,100 Client 0,218 Impact on Society 0,194 Finance 0,161 M.1 – 0,640 M.2 – 0,238 M.3 – 0,123 M.4 – 0,663 M.5 – 0,229 M.6 – 0,107 M.7 – 0,677 M.8 – 0,225 M.9 – 0,098 M.10 – 0,684 M.11 – 0,218 M.12 – 0,098 R.1 – 0,521 R.2 – 0,212 R.3 – 0,108 R.4 – 0,092 R.5 – 0,068 R.6 – 0,545 R.7 – 0,214 R.8 – 0,150 R.9 – 0,091 R.10 – 0,549 R.11 – 0,351 R11a – 0,100 Enablers Results CRITERIA 1st level PERFORMANC E INDICATORS 2nd level Leadership 0,182 Strategy & Planning 0,076 External Partnership & Resouces 0,069
Process and change management 0,100 Client 0,218 Impact on Society 0,194 Finance 0,161 M.1 – 0,640 M.2 – 0,238 M.3 – 0,123 M.4 – 0,663 M.5 – 0,229 M.6 – 0,107 M.7 – 0,677 M.8 – 0,225 M.9 – 0,098 M.10 – 0,684 M.11 – 0,218 M.12 – 0,098 R.1 – 0,521 R.2 – 0,212 R.3 – 0,108 R.4 – 0,092 R.5 – 0,068 R.6 – 0,545 R.7 – 0,214 R.8 – 0,150 R.9 – 0,091 R.10 – 0,549 R.11 – 0,351 R11a – 0,100 Enablers Results
Figure 2 - Hierarchic structure of the AHP and results how, the inquired librarian, weight the different
criteria used to compute the Global performance measure (D), and how they weight the various
performance indicators used to evaluate each criterion.
3.2 Discussion of the results
The Brazilian librarian Sampaio (2005), mentioning Piaget, affirms that cooperation is an action process where the accomplishment is executed in common. For an effective cooperation the following conditions are necessary: existence of a common scale of values, conservation of the values' scale and existence of reciprocity in the interaction. This research involved cooperation among ten academic librarians from several universities.
This study proposed several criteria and performance indicators to evaluate academic libraries and computed the values of the relative weights for each performance measure, based on the opinion of academic librarians. We inquired nine librarians of a large fraction of Portuguese universities. In addition, we highlight the participation of one Brazilian librarian from the University of São Paulo. Most contacts were performed by e-mail, there were several contacts during a period of three months (November and December 2006 and January 2007). The inquiry was available in an e-mail attachment. Our results indicate that there are four criteria which are considered particularly important in performance evaluation (see table 7 and figure 2): customer perspective (weight 0.218), impact on society (weight 0.194), leadership (weight 0.182) and financial perspective (weight 0.161). On the other hand, process and change management (weight 0.1), strategy and planning (weight 0.076), and external partnerships and resources (weight 0.069) are considered relatively less important.
As we explained above, each criterion is computed as a weighted average of several performance indicators. Table 8 shows the weights of each performance indicator in a given criterion (second column of table 8).
Customer perspective is the most important criterion in performance evaluation, with a weight of 0.218. Customer perspective involves the performance indicators: library visits per capita, loans per capita, user satisfaction, staff satisfaction and levels of absenteeism and sickness. According to the inquired librarians the most important indicator in the customer criterion is library visits per capita, with a weight of 0.521. The second most important criterion is the Impact on society, with a relative weight of 0.194. This dimension is related with the different library outcomes. The two most important indicators for this criterion are: the rate of students’ success (with a weight of 0.545) and the rate of professors and researchers publications (with a weight of 0.214). This data is consistent with Poll and Payne affirmations (2006), “academic outcomes supports the following goals; effective teaching (high graduation rates, high grades in examinations…) effective research (high renown and use of research results and publications...)”.
Leadership is the third most important criterion, with a weight of 0.182. In this criterion the most important indicator is, by far, the development and the formulation of the vision of the library (relative weight of 0.640).
Financial perspective is also considered an important aspect for academic librarians, with a relative weight of 0.161. In this criterion the cost per user (professor/ student) are the most important indicators.
Process and change management criterion has a relative weight of 0.100. For this
criterion, the indicators are: the median time of document acquisition (weight of 0.684), median time of document retrieval from open access area (weight of 0.218) and the market penetration of electronic services (weight 0.098). Consequently, the performance indicator median time of document acquisition is extremely important.
The dimension Strategy and planning, with a weight of 0.076, and External
partnerships and resources (with a weight 0.069) presented similar values. We
highlight that the most important associated performance indicators are, the systematic gathering information about the needs and the expectations of the users (weight 0.663) and the collection of paper and electronic resources development (weight 0.677), respectively.
The consistency ratios, for the several criteria and associated performance indicators, present values between 0.0038 and 0.0998 (columns 3 and 5 of table 8). Since the consistency ratios are all below 0.10, one can conclude that the judgments established, by each librarian, in the pairwise comparison matrices, were internally consistent.
Since the global performance measure is a weighted average of the various criteria, and each criterion is a weighted average of several performance indicators, we can also compute the global performance measure as a weighted average of the various performance indicators. The weight of each performance indicator on the Global
performance measure D, is equal to the product of the criterion weight by the
performance indicator weight on the criterion.
Column 6 in table 8, presents the weight of each performance indicator on the global performance measure D and figure 3 graphs these weights by decreasing order of importance. This analysis shows that, overall, the three most important performance indicators are:
- The development and formulation of a vision and a mission of the library. The relative weight of this performance indicator on D is 0.116;
- Library visits per capita (the relative weight of performance indicator on D is 0.114;and
- Rate of the student success, for example number of students that get the graduation per year, (relative weight of performance indicator on D is 0.106).
This team of librarians assumed that cost per professor and investigator is more important than cost per student (respectively 0.088 and 0.057). In addition, they think that the following issues are still important: median time document acquisition (0.068), the systematic gathering information about the needs and expectations of the users (0.050), number of books and journals in paper and electronic versions (0.047), and loans per capita (0.046).
In order to realize high-quality service, librarians need to understand how users (students, teachers and investigators), staff and society recognize and evaluate university library services. This research was an excellent exercise to enhance discussion, among the Portuguese librarians, methodologies, theories and models to build a framework with 23 items; 12 performance indicators for enablers and 11 performance indicators for results.
The methodology presented in this work was already used to recognize best practice in Portuguese Higher Education Libraries (Melo et al., 2008).
Relative Weights of the Criteria
0 0,05 0,1 0,15 0,2 0,25
Exter nal par tner shi ps and r esour ces Str ategy and pl anni ng Pr ocess and change management Fi nanci al Leader shi p Impact on soci ety Customer C rit er ion Relative Weight
Relative Weights of the Performance Indicators in the global performance
measure
0,000 0,020 0,040 0,060 0,080 0,100 0,120 0,140
Identification of strategic partners and the nature of the relationships Development and applying methods to measure the performance Assess market penetration of electronic service Levels of absenteeism or sickness Opening hours for a week Cost per library visit Reorganisation and improvement strategies and methods activities Degree of compliance with environmental principles Overall staff satisfaction Median time of document retrieval from Open Access Area Promotion and training to improvement the activities Overall user satisfaction Rate staff library participation in internal discussion groups, international meetings Rate of professors and researchers publication Development organisational structure in accordance with the tasks Loans per capita Number of monographs, e-books, journal and e-journals Systematic gathering information about needs and expectations of users Cost per student Median time of document acquisition Cost per teacher Rate of the students success Library visits per capita Development and formulation of a vision and a mission
P er for m anc e Indic at or Relative Weight
CONCLUSIONS
The evaluation model proposed in this study is based on well-known instruments, CAF - Common Assessment Framework, Balanced Scorecard and Analytic Hierarchy Process. The main value added of this article is to relate these three methodologies and suggest a practical evaluation performance tool which includes the benefits of these three instruments.
This project recognizes that measuring academic libraries inputs, outputs, processes and outcomes is not an easy task and it is a great challenge. However our research also shows that the discussion of these subjects among librarians is useful and allows us to obtain data for the evaluation of libraries and information services..
This initiative has demonstrated that it is possible to build partnerships to create projects, to share knowledge and data, to get performance evaluation results so as to improve quality services in university libraries.
Bodi and Maier-O’Shea (2005) affirm that “Libraries have to invest in preparation for a digital future while maintaining collections and services based on a predominately print world”. Management performance theories are considerations important to the assessment service quality and to overtake the new challenges that exist in the academic libraries..
This study could be a contribution to staff library because it presents the following benefits suggested by Matthews (2006):
• Clarify, update and communicate strategy
• Link strategic objectives to performance measures with associated long term targets
• Broaden managements focus issues that affect sustainable long-term performance
• Provide a focus for continuous process improvement efforts and quality
enhancement initiatives
• Identify and align strategic initiatives
• Demonstrate accountability.
After all the purpose is to adapt the "libraries to the Man's measure” (Eco, 1983).
Acknowledgement
The authors wish to express their deep apreciation to the librarians Aida Alves (U. Católica Portuguesa), Helena Barbosa (U. do Porto), Helena Miranda (U. do Porto), Olinda Martins (U. Lusíada - Famalicão), Irene Mesquita (Instituto Politécnico do Porto) Lourdes Gouveia (U. Nova de Lisboa), Emília Pacheco (U. do Algarve), Iolanda Silva (U. da Madeira), Ana Taveira (U. dos Açores), e Imaculada Sampaio (U. São Paulo - Brazil), who generously took the time to participate in our focus group inquiries.
REFERENCES
Andersen, H., Lawrie, G. and Shulver, M. 2000. The balanced scorecard vs. the EFQM business excellence model, 2GC Working Paper, June , pp. 1-14.
Anderson, D.R., Sweeney and D.J., Williams, T.A. 1998. Quantitative methods for business. 7th ed. Cincinnati, Ohio: South-Western College.
Bank, J. 1998. Qualidade total: manual de gestão. Mem Martins: CETOP.
Bodi, S. and Maier-O'Shea, K. 2005. The library of Babel: making sense of collection management in a Post-modern word, The Journal of Academic Librarianship, 31, pp.143-150.
Cullen, R. 2003. Benchmarking: overview and context [online], in: Proceedings of
Berlin, 1-9 August. [Accessed 09 September 2003]. Available from World Wide Web: <http://www.ifla.org/IV/ifla69/papers/015e-Cullen.pdf>
Eco, U. 1983. A biblioteca. Lisboa: Difel.
European Institute of Public Administration 2006. CAF – Common Assessment
Framework. Maastrich: EIPA. [Accessed 10 October 2006]. Available from World
Wide Web: <http:// www.eipa.nl/CAF/CAF_2006/Brochures/English_2006.pdf>
International Organization for Standardization 1998. ISO 11620 information and documentation - library performance indicators. Genève: ISO.
International Organization for Standardization 2003a. ISO 11620 information and documentation - library performance indicators: amendment 1: additional performance des bibliothèques. Genève: ISO.
International Organization for Standardization 2003b. ISO 2789 information and documentation - international library statistics. Genève: ISO.
Kaplan R.S. and Norton, D.P. 1992. The balanced scorecard - measures that drive performance. Harvard Business Review, January February, pp. 71-79.
Kaplan, R.S. and Norton, D.P. 1996 The balanced scorecard: translating strategy into action. Boston: Harvard Business School.
Kaplan R.S. and Norton, D P. 2004. Kaplan e Norten na prática. Rio de Janeiro: Elsevier.
Matthews, J. R. 2005. Scorecard for results: a guide for developing a library Balanced Scoerecard. Carlsbad, CA: The Carlsbad City Library.
Melo, L.B. 2005. Avaliação de desempenho das bibliotecas da Universidade do Porto: modelo de actuação. Évora, Inf. Sc. Ms. Dissertation - Universidade de Évora.
Melo, L.B., Pires, C.and Taveira, A. 2008 A. Recognizing best practice in Portuguese Higher Education Libraries. IFLA Journal, 34(1), pp.34-54.
Parasuraman, A., Zeithaml, V.A. and Berry, L.L. 1985. A conceptual model of service quality and its implications for future research. Journal of Marketing, 9, pp.41-50. Payne, P. 2005. Conyers, A. Measuring the impact of higher education libraries: the LIRG/SCONUL impact implementation initiative. Library and Information Research,
29(91), [Accessed 29 October 2007]. Available from World Wide Web: <http://eprints.bbk.ac.uk/148/1/Payne1.pdf>
Poll, R. 2001. Performance, process and costs: managing service quality with balanced scorecard. Library Trends, 49(4), pp. 709-717.
Poll, R. and Payne, P. 2006. Impact measures for libraries and information services.
Saaty, T.L. 1990. Decision making for leaders: the analytic hierarchy process for decisions in a complex world. Pittsburgh: University of Pittsburgh.
Saaty, T.L. 2000. Fundamentals of Decision Making and Priority Theory with Analythic Hierarchy Process. Pittsburgh: RWS.
Sampaio, M. I. 2005. Motivação no trabalho cooperativo: o caso da Rede Brasileira de
Bibliotecas da Área de Psicologia - ReBAP. São Paulo, Inf. Sc. Ms. Dissertation -