1 Introduction
The effective protection of critical data and infrastructure from unauthorized access is becoming more and more important. Intrusion detection systems are frequently used to complement traditional preventative techniques such as firewalls and encryption. Network intrusion detection systems passively observe the network traffic between a protected site and an external, insecure network, as shown in Figure 1. To avoid interference with the observed traffic, and to minimize the risk of a direct attack on the NIDS, a copy of every packet is forwarded to the NIDS sensor via a tap. When detecting an attack or a potential security breach, the network intrusion detection system (NIDS) logs an alert for higher-level analysis. A variety of techniques exist to distinguish between benign traffic and attack situations, ranging from rule-based signature matching [15] to policy-monitoring [11] and anomaly detection [8].
Figure 1: Organization of a Network Intrusion Detection System
Regardless of the particular analysis technique, it is imperative that the NIDS is able to process packets at the rate at which they traverse the network under observation. Assuming a uniform distribution of attacks across the network traffic, any packet loss results in a proportional loss in intrusion detection effectiveness. More importantly, attackers can deliberately avoid detection by overloading the NIDS sensor with benign traffic, causing high packet loss and increasing the likelihood that a successful intrusion remains undetected [12]. Thus one of the key performance metrics for a network intrusion detection system is the sustainable throughput, or the packet loss under worst-case network traffic scenarios.
Figure 2 illustrates the relationship between packet loss and loss in NIDS precision.The scatter plot relates the packet loss rate to the percentage of missed attacks relative to an ideal system without packet loss.
Figure 2: Missed Alerts over Packet Loss Rate
network analysis backend operator intrusion detection sensor protected intranet insecure network 0% 10% 20% 30% 0% 10% 20% 30% 40% 50% Packet Loss Al ert L oss
Characterizing Sources and Remedies for Packet Loss in Network
Intrusion Detection Systems
Lambert Schaelicke
Intel Corporation
l.schaelicke@computer.org
J. Curt Freeland
Department of Computer Science and Engineering
University of Notre Dame
curt@cse.nd.edu
Abstract
Network intrusion detection is becoming an increasingly important tool to protect critical information and infrastructure from unauthorized access. Network intrusion detection systems (NIDS) are commonly based on general-purpose workstations connected to a network tap. However, these general-purpose systems, although cost-efficient, are not able to sustain the packet rates of modern high-speed networks. The resulting packet loss degrades the system’s overall effectiveness, since attackers can intentionally overload the NIDS to evade detection. This paper studies the performance requirements of a commonly used open-source NIDS on a modern workstation architecture. Using full-system simulation, this study characterizes the impact of a number of system-level optimizations and architectural trends on packet loss, and highlights the key bottlenecks for this type of network-intensive workloads. Results suggest that interrupt aggregation combined with rule set pruning is most effective in minimizing packet loss. Surprisingly, the workload also exhibits sufficient locality to benefit from larger level-2 caches as well. On the other hand, many other common architecture and system optimizations have only a negligible impact on throughput.
The graph shows a direct and nearly linear relationship between the two parameters. Interestingly, as the packet loss becomes sufficiently small, the number of missed alerts quickly approaches zero. The network traffic used here consists of over 530,000 packets that contain 521 known attacks. At a ratio of approximately 1000 packets per alert, a sufficiently small loss rate may not result in missing an alert in average scenarios. However, past experience shows that any vulnerability will eventually be exploited by attackers. Insufficient peak throughput allows motivated parties to circumvent the intrusion detection system by forcing excessive packet loss through flooding attacks.
Unfortunately, modern general-purpose systems are not ideally suited for the task of receiving and analyzing high-bandwidth network traffic [16]. High interrupt rates combined with the irregular code structure of network processing and intrusion detection algorithms render caches and branch predictors less effective compared to more regular compute-intensive codes. Recent trends towards deeper processor pipelines to improve clock frequency are even detrimental to interrupt handling performance [9]. With the expected improvements in network data rates, general-purpose systems will continue to be overloaded when performing network intrusion detection on high-speed links. Unlike other network-facing workloads, network intrusion detection systems face a number of unique challenges. Since the intrusion detection host is not in the communication path, it does not have the ability to reject connections or use common flow control mechanisms to control the network load. Second, the system must be designed to handle worst-case traffic scenarios to handle not only average traffic but to be resistant to overflow and evasion attempts.
This study provides an in-depth analysis of the performance requirements and bottlenecks of network intrusion detection on general-purpose systems. Using a cycle-level system simulator, it quantifies the impact of a number of optimizations at the system and architecture level. In particular, it compares the effect of system-level optimizations with the performance benefit gained from architectural changes. Results confirm that many common architectural techniques to improve performance are less effective for this unique workload, especially considering the cost of many of these techniques. On the other hand, relatively simple system-level optimizations such as interrupt coalescing and tuning of the NIDS rule set can have a significant impact on throughput. Surprisingly, the user-level code exhibits a sufficient degree of locality to benefit from larger level-2 caches.
The following section discusses the simulation tools and workloads in detail. Section 3 presents a number of results that help understand the performance requirements of the NIDS workload and its sensitivity to various optimizations. Section 4 contrasts this work with previous work in NIDS performance evaluation and high-speed networking. Finally, Section 5 summarizes the paper and outlines directions for future exploration.
2 Experimental Methodology
2.1 Simulation System
This study uses execution-driven cycle-level simulation to investigate the cause of packet loss in network intrusion detection systems. Simulation provides unique insights into microarchitecture-level performance characteristics not easily available on real systems. At the same time, it facilitates a systematic exploration of the architectural design space to determine which techniques affect the performance of a network intrusion detection system, and to what extent. All key parameters can be easily controlled to isolate the impact of each on overall system performance. However, it is important to note that the results do not necessarily match the behavior of a real system. Instead, the main focus of this study is to identify trends, thus quantifying the relative contributions of various optimizations and architectural changes to system performance.
ML-RSIM is a system simulator well suited for this task as it combines detailed hardware models of modern workstation and server class machines with a fully-functional Unix-like operating system [17]. The tool models a dynamically scheduled microprocessor with caches, main memory, SCSI disk and an Ethernet network adapter. It runs a BSD-based operating system that provides a Solaris-compatible system call interface and is able to execute Sparc binaries with minimal modification.
For this work, the simulator has been extended with an Ethernet network interface controller model, based on the Intel EtherExpress Pro100 Ethernet adapter using the 82557 Ethernet controller chip. The adapter uses a ring-structure of receive buffer descriptors that is maintained by the device driver. The device driver has been ported from NetBSD into the simulated Lamix kernel. The simulator reads network traffic from a tcpdump trace file [20] and injects the trace data into the network adapter’s receive port. The network adapter model can be configured to either maintain the original packet time stamps or to replay the trace at a configurable speed. When running the Snort network intrusion detection software, raw network packets are passed through the Berkeley Packet Filter (BPF) to the application without being subject to IP or TCP protocol processing.
2.2 Network Intrusion Detection Software
In this study, the simulator runs the Snort 2.3 network intrusion detection software [19]. Snort is a commonly used open-source network intrusion detection package that performs signature-based packet inspection. The full rule set as of January 2005 contains 2559 rules that are organized into 271 chains by Snort. In the following experiments, all of the rules from the default rule set are enabled. In addition to packet-level signature matching, Snort employs a number of preprocessors that perform IP fragment reassembly and port-scan detection as well as traffic normalization. Alerts can
be logged in a variety of ways, including to an SQL database, the system log file or in a compact binary format to a regular file. In this study, the unified binary format is used as it incurs the lowest overhead while still providing all required information about attacks. Snort is compiled with the Sun Forte 6.2 compiler for Sparc V8 at optimization level 3 [1].
2.3 Network Trace
The network trace, together with the network intrusion detection software, provides the workload for the simulator. The trace used in this study was captured on the Internet connection of a major research university on July 2, 2003. It contains 306,094,689 bytes in 529,955 packets. Using the default rule set for Snort 2.3 as of January 2005, Snort reports 521 alerts. Among these alerts are 126 port scans and 46 HTTP exploits.
The trace is injected into the simulator in two different ways. First, traffic is replayed at a fixed rate of 200 MBit per second wire speed. The resulting network traffic workload spans a period of 13 seconds and offers an average effective data bandwidth of 21 MByte per second.
A second set of experiments replays the same trace according to the original packet time stamps. This results in a more bursty workload with an average effective bandwidth of 20 Mbyte per second.
2.4 System Configuration
The baseline system configuration assumed in this study is a dynamically scheduled processor with a conventional 2-level cache hierarchy. Table 1 summarizes the most relevant system parameters.
The configuration is based on a 2.4 Ghz Opteron system [6], but is intended to be representative of a larger class of modern high-performance workstation and server systems. The relatively short pipeline of more conventional dynamically-scheduled processors, combined with an aggressive memory hierarchy, make this system relatively well suited to handle network-intensive workloads.
Using the LMBench suite of microbenchmarks [21], the performance of this system has been compared to that of a 2.4 Ghz Opteron. Memory latency and bandwidth measured on the simulated system matches that of the Opteron platform for a variety of working sets and access strides. LMBench reports a main memory latency of approximately 85 nanoseconds, and a copy bandwidth of 9.8 Gbyte per second in the L1 cache, 4.3 Gbyte per second in the L2 cache and 300 Mbyte per second in main memory.
In the following experiments, the workload including the offered network traffic remains constant. Consequently, packet loss is the main performance metric. Packet loss is determined by subtracting the packet count reported by Snort from the known number of packets in the trace file. It is critical that the network intrusion detection software is able to analyze all network packets, since any packet loss directly degrades the effectiveness of the NIDS and provides a vulnerability that can be exploited. Any additional headroom in processing performance can potentially be utilized by increasing the complexity and sophistication of the intrusion detection technique. This study, however, is mainly concerned with minimizing packet loss for a given network load and NIDS package. This scenario corresponds to the situation security analysts may face when optimizing a given system for a particular network.
3 Results
3.1 Packet Loss
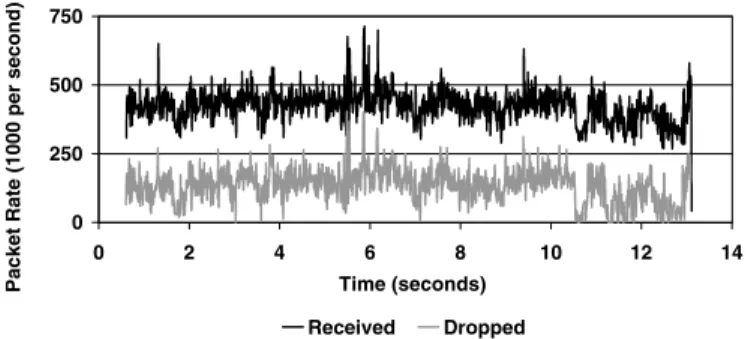
The baseline system experiences a packet loss of 31.8 percent for the steady workload, and 30 percent for the bursty trace. These loss rates correspond to an approximately equivalent loss in precision of the network intrusion detection system, since it will miss on average 31.8 and 30 percent of all security incidents. Figure 3 below shows the packet rate and loss rate for the first, steady trace over time. Despite a constant data rate, packet rates show some variation due to varying packet sizes. Interestingly, packet loss rates closely follow the packet rate.
Parameter Value
Clock Frequency 2.4 Ghz (241 ps cycle)
Processor Core dynamically scheduled, 4-wide fetch, decode & graduate, 72-entry reorder buffer Functional Units 3 integer, 2 address, 2 FP, 2 memory L1 Instruction Cache 64 kbyte, 2-way set-associative, 64-byte
blocks, 2-cycle latency
L1 Data Cache 64 kbyte, 2-way set-associative, writeback, 64-byte blocks, 2-cycle latency,
dual-ported
L2 Cache 1 Mbyte, 16-way set-associative, 64-byte blocks, 12-cycle latency
System Bus 32-byte multiplexed, 333 Mhz DDR
Main Memory 333 Mhz DDR-SDRAM, 4 banks
Operating System Lamix, BSD-based
Packet Capture Berkeley Packet Filter (BPF) Intrusion Detection
Software
Snort 2.3, compiled with Sun Forte 6.2 at optimization level 3
Figure 3: Packet Rate and Loss Rate for Workload Trace 1 over Time
Figure 4 shows the same information for the second, bursty network traffic trace. In this case packet rates vary significantly over time and show a certain degree of periodic behavior. Again, packet loss rates are generally proportional to the offered load.
Figure 4: Packet Rate and Loss Rate for Workload Trace 2 over Time
Overall, these results demonstrate that modern high-performance general-purpose systems are not able to perform signature-based network intrusion detection on high-speed links with satisfactory accuracy.
Processor utilization is nearly 100 percent for the steady trace, but only 93 percent for the bursty traffic due to the periods of low activity. The average instruction level parallelism is 0.35 instructions per cycle for application code, and 0.2 instructions per cycle for kernel code including interrupt handling and system calls. The processor spends approximately 15 percent of the non-idle time in the network interrupt handler, and 4.5 percent in the BPF read system call. The basic processing steps for a packet consist of the Ethernet device interrupt handler, a read system call, the Snort preprocessors and the signature matching, possibly resulting in an alert. The network interrupt handler copies the complete packet in the BPF packet buffer. If the buffer fills up, any blocked read are woken up, The BPF read system call applies an optional packet filter, which is not used by Snort in this case, and then copies the entire buffer into the application buffer. For each packet in the receive buffer, Snort first applies a number of preprocessors that perform IP fragment reassembly and port scan detection. Both operations use
relatively large data structures to keep track of packets over a fixed time window. After preprocessing, each packet is matched against all rules in one or more rule chains. Rule chains contain rules grouped by IP protocol and port number to reduce the number of rules applied to each packet. In addition to a constant per-packet cost, processing cost scales with packet size. Both the interrupt handler as well as the read system call copy the entire packet. Furthermore, many of the Snort rules inspect the entire payload for a known signature. Preprocessing and alert generation on the other hand incur a fixed cost. Surprisingly, despite a number of operations that depend on the packet size, overall processing cost is relatively independent of the packet size, as shown in Figure 5.
Figure 5: Average and Maximum Packet Processing Cost This figure plots the average packet processing cost in microseconds in the bottom graph, and the maximum cost as the top line. These values are obtained by instrumenting Snort with a very light-weight statistics routine that traps into the simulator at the beginning and end of processing each packet. The maximum observed processing time and the average value differ significantly, indicating a large degree of variation between individual packets. The minimum value is not plotted as it is very close to the average. The fact that the processing time is relatively constant across all packet sizes suggests that processing cost is dominated by the Snort preprocessors which incur a fixed per-packet overhead. This observation also correlates well with the fact that packet loss over time tracks the packet rate, as shown in Figure 3 and Figure 4.
The following sections evaluate the impact of a number of system-level and architectural optimizations on packet loss in order to understand the main bottleneck for this workload.
3.2 System-level Optimizations
In the baseline system, interrupt handling constitutes approximately 15 percent of the total processor utilization. Interrupt handling code is highly irregular. It incurs many cache and TLB misses and branch mispredictions and thus does not benefit from the advances in processor performance to the same degree that more regular, computational codes do [9]. Interrupt coalescing or aggregation is a simple and effective technique to reduce the processing load of interrupt handling [3]. When receiving a network packet, the network
0 250 500 750 0 2 4 6 8 10 12 14 Time (seconds) P ac k et R ate (1000 per secon d) Received Dropped 0 250 500 750 0 2 4 6 8 10 12 14 Time (seconds) P ac k et R ate (1000 per secon d) Received Dropped 0.00 25.00 50.00 75.00 100.00 0 400 800 1200 1600
Packet Size (bytes)
Analys is C ost (m icroseconds )
adapter delays interrupting the host processor until a specified number of packets have arrived. The interrupt handler then performs the necessary processing for all packets at once. To avoid excessive latencies in cases of low packet rates, a timeout occurs to trigger an interrupt within a maximum time from receiving the first packet, regardless of the packet count. Thus, the optimal number of interrupts to coalesce is a tradeoff between processing load and network latency. Aggregating larger numbers reduces the interrupt load, but introduces longer latencies for packets arriving in the beginning of the coalescing period. Fortunately, network intrusion detection systems are not network latency sensitive and can thus take full advantage of interrupt aggregation.
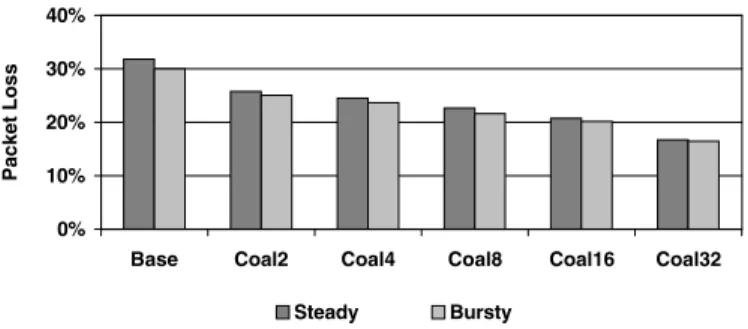
Figure 6 shows the packet loss rates for various degrees of interrupt aggregation. This technique is clearly very effective in improving NIDS throughput. Aggregating 32 interrupts reduces the interrupt cost by over 60 percent, reducing packet loss rates by 46 percent.
Figure 6: Performance Impact of Interrupt Aggregation Aggregating even larger numbers of interrupts has increasingly smaller benefits, since interrupts contribute a decreasing percentage of the total processing cycles. In addition, more buffers need to be allocated by the device driver to hold packets until they are handled by the kernel, with a potentially negative impact on cache performance due to a larger memory foot print.
A second potential kernel-level optimization increases the receive buffer size to tolerate longer bursts of high packet rates. The BPF kernel module employs double-buffering and block-copies to minimize buffer contention and system call overhead. On a read system call, the application blocks until the first buffer is completely filled. The kernel then switches buffers and copies the entire buffer into user space, while at the same time beginning to fill the second buffer.
Interestingly, increasing the receive buffer size from the default 32 kbytes to 1 Mbyte has a detrimental impact on performance. In general, receive buffers help tolerate bursts of high data rates, but are ineffective if the sustained enqueue rate exceeds the rate at which packets are processed. Since the first, steady network trace has few distinguishable bursts or spikes of high data rates, the system does not benefit from a larger buffer. For the second network trace, most bursts are longer than what can be absorbed by the buffer. In both cases performance decreases since the larger buffer exceeds the size
of the level-1 cache, thus incurring more cache misses. Note that this effect is partly due to the unique implementation of buffering in the BPF module. To minimize system call overhead, the BPF system call copies the entire currently active buffer at once. As a result, increasing the buffer size by a factor of 32 means that each read system call copies 32 times as much packet data into user space.
Figure 7: Buffer Size Effects
An alternative implementation of the BPF double-buffering scheme uses a list of fixed-size buffers. When the first buffer is full, it is copied into user space and the buffer list is shifted, while the device driver copies packets in the tail buffer. This scheme supports large buffers without increasing the amount of data copied in each read system call. Figure 8 shows the packet loss rates for this alternative buffer scheme.
Figure 8: List Buffer Performance
Increasing the total buffer size but adding buffers to the list has essentially no effect on packet loss. This scheme does not incur the performance degradation of the default buffering approach since it does not increase the amount of data copied. However, the overall larger memory footprint combined with the absence of short pronounced spikes of network activity make this scheme ineffective in reducing packet loss.
As a third system-level optimization, the degree of compiler optimization can affect the cost of signature matching performed by the NIDS software, as shown in Figure 9. More aggressive and extensive optimizations by the compiler generally improve NIDS performance. Optimization level 2 performs all common optimizations, but treats global variables as volatile and excludes them from optimizations. Level 3 includes references to global data in its optimization, resulting in a significant improvement in throughput. Level 4 performs automatic function inlining within the same source file as well as pointer alias analysis. For this workload, these additional
0% 10% 20% 30% 40%
Base Coal2 Coal4 Coal8 Coal16 Coal32
Packet Loss Steady Bursty 0% 10% 20% 30% 40%
Base 2xBuf 4xBuf 8xBuf 16xBuf 32xBuf
Packet Loss Steady Bursty 0% 10% 20% 30% 40%
Base 2xLBuf 4xLBuf 8xLBuf 16xLBuf 32xLBuf
Packet Loss
optimizations have little or no impact on performance. In fact, the increased code size and longer code paths can degrade performance slightly. Finally, optimization level 5 performs additional aggressive optimizations based on feedback from an instrumented binary. The somewhat higher compilation overhead due to the generation of profile data and longer compilation times leads to a small but noticeable throughput improvement of 8 percent.
Figure 9: NIDS Performance at Different Compiler Optimization Levels
The set of rules employed by the Snort NIDS forms an integral part of the workload, since each additional rule may increase the packet inspection cost. The rule set used in this study contains 2559 rules that are organized into 271 chains by the rule optimizer. Each chain corresponds to a subset of the total rules. Most packets are matched against only one set based on an early packet classification. Reducing the number of rules can reduce the average size of a set, thus reducing the average signature matching cost. Consequently, optimizing the rule set is a powerful technique to improve the performance of the network intrusion detection system. However, depending on the type of rules eliminated, optimizing the rule set may completely eliminate one or more rule subsets without affecting the size of the remaining sets. In this case, the packet processing cost may not improve significantly if the remaining rule sets are of the same size. Optimizing the original Snort rule set has a measurable impact on performance, as shown in Figure 10.
Figure 10: Sensitivity to Rule Set Optimizations By default, a number of rules shipped with the Snort distribution are disabled. The resulting rule set contains 2220 rules arranged in 180 subsets. Compared with the full rule set containing 2559 rules, this pruning reduces packet loss by 37 percent. Eliminating half of all rules results in 101 subsets. In this configuration, Snort reports 342 alerts, compared with 521
using the full rule set. Packet loss improves again drastically, confirming that rule set pruning is perhaps the most powerful tool to optimize network intrusion detection performance. Notice however that pruning the rule set requires a significant degree of experience to avoid eliminating useful rules. Depending on the security policies of the particular installation, it may not be possible to disable a sufficient number of rules.
3.3 Processor Core Optimizations
Given that the baseline system is not able to sustain the packet rate offered by the workload traffic, architectural changes to the processor core that increase instruction throughput may be able to alleviate the bottleneck. Figure 11 shows the throughput improvement when scaling the processor clock frequency, and when increasing the issue widths and reorder buffer size. Note that these experiments leave the memory subsystem unchanged. Functional unit latencies, pipeline depth, cache size and latency are optimistically assumed to scale with clock frequency, whereas main memory latency and bandwidth remains unaffected.
Figure 11: Performance Impact of Clock Frequency and Superscalar Execution Improvements
Increasing the core clock frequency by a factor of 1.5 and 2 respectively results in a measurable improvement in packet loss rates. Doubling the clock frequency reduces packet loss by 32 percent, nearly the same amount as aggregating 16 interrupts.
Increasing the fetch and issue width of the processor from 4 to 6 instructions per cycle while also adding one fixed-point functional unit and increasing the reorder buffer to 128 entries results in a small but measurable performance improvement, suggesting that there is some degree of instruction-level parallelism in the workload. Note that in this experiment the processor runs at the baseline clock frequency of 2.4 Ghz. Overall however, the performance improvement is not proportional to the cost of these architectural changes, especially considering that a similar effect can be achieved by simple interrupt aggregation.
3.4 Cache Optimizations
The insufficient improvements achieved by the aggressive changes to the processor core shown above suggest that the main bottleneck lies elsewhere. Indeed, simulations with a
0% 15% 30% 45% O2 O3 O4 O5 Packet Loss Steady Bursty 0% 10% 20% 30% 40%
Full Default Pruned
Packet Loss Steady Bursty 0% 10% 20% 30% 40% 2.4 Ghz 3.7 Ghz 4.8 Ghz 6-wide Packet Loss Steady Bursty
perfect cache completely eliminate all packet loss. The perfect cache model never incurs any misses, even if the data has been transferred into main memory by the NIC DMA engine. While idealized, this model confirms that memory performance limitations are at the core of the insufficient throughput.
Figure 12: Impact of Different Level-1 Cache Sizes on Performance
Figure 12 compares the packet loss rates for different level-1 data cache sizes. It also includes the system’s performance when a basic sequential hardware prefetch scheme is employed at the L1 cache. Interestingly, larger level-1 caches degrade overall performance due to the increasing cache access latency. The baseline system has a 2-cycle access latency for a 64-kbyte cache. Cacti [18] estimates the access latencies as one cycle for a 16-kbyte cache, two cycles for a 32 and 64 kbyte cache, 4 cycles for 128 kbytes and 5 cycles for a 256 kbyte cache. Despite the aggressive dynamic scheduling capabilities, the processor is not able to tolerate these longer latencies despite the improved cache hit rates. As a result, overall performance is degraded for larger caches. Prefetching the next cache block on a miss improves hit rates by a small amount, but also increases level-2 cache utilization. Demand misses may be delayed due to contention with an ongoing prefetch, resulting in a performance degradation.
Figure 13: Performance Impact of Larger Level-2 Caches Increasing the level-2 cache size has a surprisingly large, positive effect on throughput, as shown in Figure 13. Level-2 caches of 4 Mbyte or larger effectively eliminate most packet loss, despite significantly larger access times. Sufficiently large caches are able to capture the working set of the NIDS code, eliminating most conflict and capacity misses. Indeed, level-2 cache hit rates improve from 36 percent for a 1 Mbyte cache to 78 percent at 8 Mbyte. At the same time, system bus utilization is reduced by more than a factor of two, leaving more headroom for bursty network activity. On the other hand,
hardware-based prefetching to the level-2 cache has an adverse effect on performance, due to the increased main memory utilization and the eviction of useful data.
While a relatively small level-2 cache of 1 Mbyte can be located on the same die as the processor, larger caches are likely located off-chip. In this case, large degrees of set-associativity may be impractical due to pin constraints. However, reducing the associativity of the 4 Mbyte level-2 cache has no impact on throughput for this workload. Even a direct-mapped cache provides sufficiently high hit-rates to almost completely eliminate packet loss.
3.5 Main Memory Subsystem
Increasing the level-2 cache capacity leads to a significant reduction in miss rates incurred by accesses to the program data structures. However, packet data is always copied into main memory and accesses to a new packet always incur a cold cache miss. Thus, changing the main memory organization can potentially benefit all classes of cache misses. Figure 14 shows the packet loss rates for systems with improved memory bandwidth, access latency and more SDRAM banks.
Figure 14: Impact of Alternative Main Memory Organizations
Replacing the 333 Mhz DDR-SDRAM with next-generation 666 Mhz modules doubles the memory bandwidth. However, since the initial latency remains unchanged, this improvement does not result in proportional improvements to the packet loss rates. Similarly, doubling the number of physical SDRAM banks does not result in a proportional performance improvement. Although additional banks also provide more concurrency, this effect can unfortunately not be exploited by the irregular NIDS code.
Reducing the memory latency, on the other hand, has a much greater performance impact. In this configuration, initial DRAM access latency is reduced to two thirds of the baseline system, but packet loss rates improve by more than a factor of two. It is important to note that this drastic latency improvement is unrealistic in the near future, given a historic change of only 6 percent per year for commodity DRAM. However, these results confirm that memory performance is one of the main bottlenecks. The code exhibits insufficient instruction-level parallelism to exploit bandwidth improvements, but is sensitive to main memory latency.
0% 10% 20% 30% 40% 16k 32k 64k 128k 256k 64k pref. P ac k et L oss Steady Bursty 0% 10% 20% 30% 40% 1M 1M pref. 2M 4M P ac k et L oss Steady Bursty 0% 10% 20% 30% 40%
Base 2x BW 2x Banks 2/3 Lat
Packet Loss
3.6 Combined Effects
This section investigates to what degree the various performance improvement techniques complement each other. In real-world installations, administrators are likely to apply a number of tuning techniques to maximize performance. At the same time, architectural advances in general-purpose system usually move along several dimensions.
Combining all system-level optimizations results in a system that combines 32 interrupts, uses a link buffer with 4 entries and runs Snort optimized at level 5 with the pruned rule set. Individually, these optimizations reduce packet loss by 46, 5, 8 and 61 percent respectively. When combining all four optimizations, only 163 packets are dropped for the bursty network trace, demonstrating that the individual optimizations are relatively independent of each other.
A second combined system scales the CPU clock frequency to 4.8 Ghz and uses a 2 MByte level-2 cache. Scaling the processor clock frequency results in a 32 percent reduction in packet loss, whereas doubling the level-2 cache reduces packet loss by 72 percent. The combined system drops 1308 and 1706 packets for the steady and bursty traffic respectively, again confirming that the optimizations are largely orthogonal to each other.
At the same time, these results show the effort required to reduce packet loss from 30 percent to 0. Feedback-directed compiler optimizations and extensive rule set pruning require time and experience from the system administrator. Doubling the core clock frequency while also doubling the level-2 cache size requires significant engineering effort to implement in future deep submicron technologies.
4 Related Work
Network intrusion detection performance in terms of accuracy and throughput has been studied extensively in the past. NIDS accuracy is expressed as the number of true and false positives reported by the system. Accuracy measurement methodologies range from microbenchmarks to trace-driven testbeds using real systems [5][13][14]. Given the difficulty of obtaining representative attack traffic, several tools generate synthetic network traces based on attack signatures [10].
While the sophistication of the intrusion detection technique is important, it is equally important that the system can analyze network packets at the rate offered by the network under observation. A number of studies have investigated the maximum throughput of alternative intrusion detection systems [16][7]. Building on previous work, this study is one of the first to provide detailed insights into the performance bottleneck of NIDS on general-purpose systems. Using system-level simulation instead of real hardware facilitates a systematic characterization of the impacts of architectural trends on system performance.
The insufficient throughput of general-purpose systems can be addressed using a wide variety of techniques. Galatin et al. investigate a number of optimizations required to achieve true
gigabit per second throughput on Ethernet [4]. The simulation-based study presented here confirms that interrupt coalescing provides a direct and significant benefit for NIDS performance. Avoiding copies between kernel and user space is another commonly used technique to improve networking performance [2]. The mmap-based version of the libpcap packet capture library implements a zero-copy interface for raw packets on Linux [22]. Interestingly, on the system characterized here, kernel to user copies account for only 3.5 percent of the total processor utilization, suggesting that copy avoidance alone is not sufficient to avoid packet loss. Since network intrusion detection systems receive raw network packets for analysis, common TCP/IP protocol stack optimizations such as checksum inlining are not applicable here.
Optimizations specific to the intrusion detection system attempt to reduce the cost of packet inspection. Common techniques range from rule set optimizations to improved string matching algorithms [7]. This approach is orthogonal to the trends investigated here, and complements any performance improvement achieved by system-level optimizations or architectural improvements.
5 Conclusions and Future Work
Network intrusion detection systems are becoming an increasingly important tool to secure critical data and infrastructure. Most systems passively monitor a network link, performing signature-based or anomaly intrusion detection. Faced with rapidly increasing network speeds, general-purpose systems are not able to perform the sophisticated intrusion detection analysis at wire speed. The resulting packet loss directly impacts the systems effectiveness and makes it vulnerable to evasion through intentional overload.
This study investigates the performance requirements of the Snort open-source network intrusion detection package. It characterizes a number of system-level optimizations and architectural techniques to improve performance. Results confirm that memory performance is the main bottleneck. The code exhibits insufficient instruction-level parallelism to benefit from processor core and memory bandwidth improvements, but rather is memory latency bound. Increasing the level-2 cache by a factor of 4 reduces the average memory latency enough to eliminate nearly all packet loss. This result suggests that the NIDS software exhibits a relatively high degree of locality. This effect can potentially be exploited at the software level by blocking or tiling the core data structures and performing signature matches for multiple packets on smaller subsets of the rules at a time.
At the same time, simple system-level optimizations such as interrupt coalescing and rule-set pruning can result in a significant performance improvement. These techniques are readily available to most NIDS installations and are not subject to the high cost of architectural changes. When combined,
these techniques achieve the same performance improvement as increasing the level-2 cache size by a factor of 4.
Given that general-purpose systems are not particularly well suited to perform network intrusion detection, and that expected architectural trends such as higher clock frequencies and improved dynamic instruction scheduling capabilities do not significantly improve this performance discrepancy, future work should explore hardware assistance for this type of workload. Programmable high-speed network interfaces may be able to perform some of the analysis task, thus offloading work from the host processor. Special-purpose hardware such as a packet classifier and filter may also be able to substantially improve the performance of these systems, while retaining most of the flexibility of a software solution.
The authors would like to thank Kyle Wheeler and Branden Moore for their helpful comments on earlier drafts of this paper, and Timothy Dysart for his help with Cacti. This material is based upon work supported by the National Science Foundation under Grant No. 0231535. Any opinions, findings, and conclusions or recommendations expressed in this material are those of the authors and do not necessarily reflect the views of the National Science Foundation.
6 References
[1] “C User’s Guide, Forte Developer 6 Update 2,” Sun Microsystems, Inc., Palo Alto, Calif., 2001.
[2] P. Druschel and L. Peterson, “Fbufs: A High-Bandwidth Cross-Domain Transfer Facility,” Proc. 14th Symp. Operating Systems Principles (SOSP-14), ACm CS Press, New York, N.Y, pp. 189-202, 1993.
[3] P. Druschel, L. Peterson, and B. Davie, “Experiences with a High-speed Network Adaptor: A Software Perspective,” Proc. ACM SIGCOMM Conf., ACM CS Press, New York, N.Y., pp. 2-13, 1994.
[4] A. Gallatin, J. Chase, and K. Yocum, “Trapeze/IP: TCP/IP at Near-Gigabit Speeds,” Proc. 1999 Usenix Technical Conference, Usenix Assoc., Berkeley, Calif., 1999, pp. 109-120.
[5] J. Haines, R. Lippmann, D. Fried, J. Korba and K. Das, “1999 DARPA Intrusion Detection System Evaluation: Design and Procedures,” tech. report 1062, MIT Lincoln Laboratory, Boston, Mass., 2001.
[6] C. Keltcher, K. McGrath, A. Ahmed, and P. Conway, “The AMD Opteron Processor for Multiprocessor Servers,” IEEE Micro, IEEE CS Press, Los Alamitos, Calif., vol. 23, no. 2, pp. 66-76, 2003.
[7] C. Kruegel and T. Toth, “Using Decision Trees to Improve Signature-based Intrusion Detection,” Proc. Sixth Int’l Symp. Recent Advances in Intrusion Detection (RAID), Springer-Verlag, Berlin-Heidelberg-New York, pp. 173-191, 2003.
[8] W. Lee and S, Stolfo, “Data Mining Approaches for Intrusion Detection,” USENIX Security Symp., Usenix Assoc., Berkeley, Calif., 1998.
[9] B. Moore, T. Slabach and L. Schaelicke “Profiling Interrupt Handler Performance through Kernel Instrumentation,” Proc. Int’l Conf. Computer Design (ICCD), IEEE CS Press, Los Alamitos, Calif, 2003, pp. 156-163.
[10] D. Mutz, G. Vigna, and R.A. Kemmerer, “An Experience Developing an IDS Stimulator for the Black-Box Testing of Network Intrusion Detection Systems,” Proc. Ann. Comp. Security Applications Conference (ACSAC), pp. 374-383, 2003.
[11] V. Paxson, “Bro: A System for Detecting Network Intruders in Real-Time”, Computer Networks, vol. 31, no. 23-24, 1999, pp. 2435-2463.
[12] T. Ptacek and T. Newsham, “Insertion, Evasion, and Denial of Service: Eluding Network Intrusion Detection, “ tech. report, Secure Networks, Inc., 1998.
[13] N. Puketza, K. Zhang, M. Chung, B. Mukherjee and R. Olsson, “A Methodology for Testing Intrusion Detection Systems,” IEEE Trans. Software Engineering, IEEE CS Press, Los Alamitos, Calif., vol. 22”, no. 10, 1996, pp. 719-729.
[14] M. Ranum, “Experiences Benchmarking Intrusion Detection Systems,” whitepaper, Network Flight Recorder.
[15] M. Roesch, “Snort: Lightweight Intrusion Detection for Networks”, Proc. Usenix LISA ‘99 Conference, Usenix Society, Berkeley, Calif., 1999.
[16] L. Schaelicke, T. Slabach, B. Moore and C. Freeland, “Characterizing the Performance of Network Intrusion Detection Sensors,” Proc. Sixth Int’l Symp. Recent Advances in Intrusion Detection (RAID), Springer-Verlag, Berlin-Heidelberg-New York, pp. 155-172, 2003.
[17] L. Schaelicke, M. Parker, ML-RSIM Reference Manual, tech. report TR 02-10, Dept. Computer Science Engineering, Univ. of Notre Dame, Notre Dame, In., 2002.
[18] P. Shivakumar and N.P. Jouppi, “CACTI 3.0: An Integrated Cache Timing, Power, and Area Model,” tech. report 2001-02, Compaq Western Research Laboratory, Palo Alto, Calif., 2001.
[19] “Snort 2.0 - Detection Revisited,” whitepaper, Sourcefire Network Security Inc., 2002.
[20] tcpdump/libpacp, http://www.tcpdump.org.
[21] L. McVoy and C. Staelin, “LMBench: Portable Tools for Performance Analysis,” Proc. USENIX Annual Technical Conference, Usenix Assoc., Berkeley, Calif., 1996, pp. 279-294.