Point Cloud Components Tools
for the Representation of Large Scale
Landscape Architectural Projects
Ervine LIN1 and Christophe GIROT21
Singapore – ETH Centre, Singapore · [email protected]
2
Chair of Landscape Architecture, ETH Zurich, Zurich/Switzerland
1 Introduction
Point clouds represent a digital collection of three-dimensional coordinates or points that can have additional metadata associated with each point (WHITE 2013). Advancements in the field of reality capture technology are transforming the process of obtaining digital spatial data of our environment (ERVIN 2003) but the application potential of these reality based datasets has many prospects which need to be explored (GRUEN 2009).
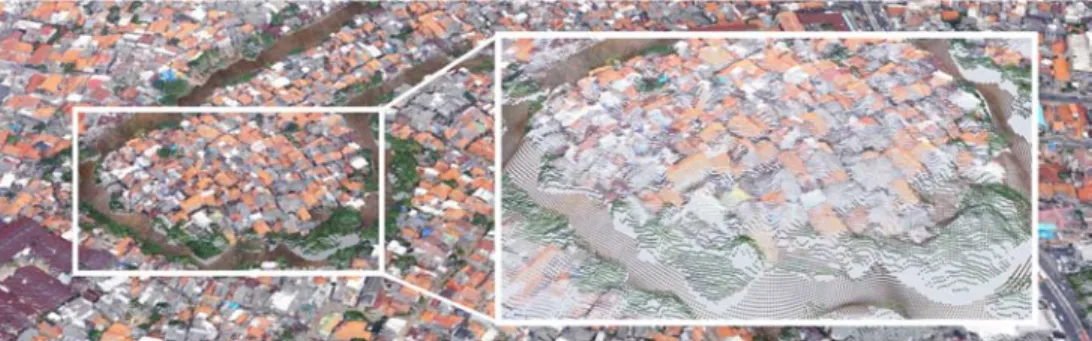
Fig. 1: A modified point cloud dataset of a downstream site showing how metadata (in this case colour) can be associated with each individual point. In this example a hypo-thetical river bathymetry has been embedded into the original point cloud model. These reality capture methods have shown great promise in other fields such as archaeolo-gy, cultural heritage management, forestry and flood simulation. Some headway has alrea-dy been developed for landscape architecture (FICKER et al. 2012) but the discipline in gen-eral has not caught up to speed with these developments. One possible reason is that modifications to these datasets remain a daunting task as the tools that are available are more akin to engineering than design.
This paper focuses on showcasing the tools and workflows that have been developed to help address this problem of modifying existing point cloud datasets for GeoDesign pur-poses. The “Point Cloud Components” presented here are a set of digital tools that have been developed specifically to allow point clouds to be used as a representative format for large scale landscape architectural projects. The paper also seeks to briefly demonstrate the ability to perform analytical functions using point cloud models.
Wissen Hayek, U., Fricker, P. & Buhmann, E. (Eds.) (2014): Peer Reviewed Proceedings of Digital Landscape Architecture 2014 at ETH Zurich. © Herbert Wichmann Verlag, VDE VERLAG GMBH, Berlin/Offenbach. ISBN 978-3-87907-530-0.
2 Project
Background
The project represents an initial portion of the ongoing research on the ailing Ciliwung River in Jakarta Indonesia. Unfortunately, increasing urbanisation, commercial develop-ment and centuries of exploitation and neglect have transformed the Ciliwung River into one of the most polluted rivers in the world.
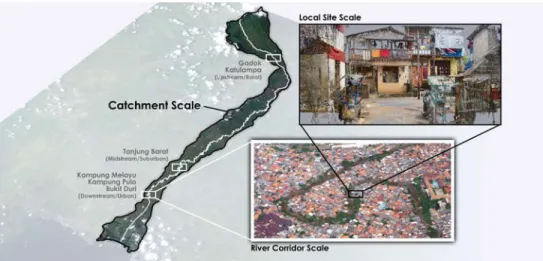
To respond to this very complex problem, the research nests itself in the Landscape Eco-logy Module of the Future Cities Laboratory under the Singapore-ETH Centre for Global Environmental Sustainability (‘Landscape Ecology | Future Cities Laboratory’ 2013). The multi-disciplinary research group focuses on three spatial scales namely the catchment, river corridor and local site scales (Fig. 2). This research in particular deals with the river corridor scale and as such, one of its objectives is to investigate the benefits and challenges of using point clouds to represent such large scale landscape architecture projects.
Fig. 2: Visual representation of how the project operates at 3 different spatial scales, from the entire river catchment scale, to the river corridor scale and lastly a local-ised site scale. The images were created from georeferenced point cloud models derived from different data sources but all nested together in the same 3D space.
3 Data
Collection
The ability for a point cloud model to represent vast areas in 3 dimensions makes it par-ticularly suitable for dealing with large scale projects such as the Ciliwung River. This brings us away from traditional 2 dimensional plan representations often used at such a scale. Obtaining such a point cloud model and the tools required to modify it serve as the starting point for informed design choices.
In order to capture this data of the Ciliwung River, photogrammetric data using an unmanned aerial vehicle (UAV) has been collected by working in collaboration with the Institute of Technology Bandung (Fig. 3) and processed with an online service (‘DroneMapper Aerial Imagery Processing and Photogrammetry’ 2013). This results in a
preliminary geo-referenced point cloud model to work with. This point cloud model is modified in Rhinoceros; a 3D modelling software which allows a point cloud’s coordinates in 3D space to correspond with UTM coordinates.
4
Point Cloud Components
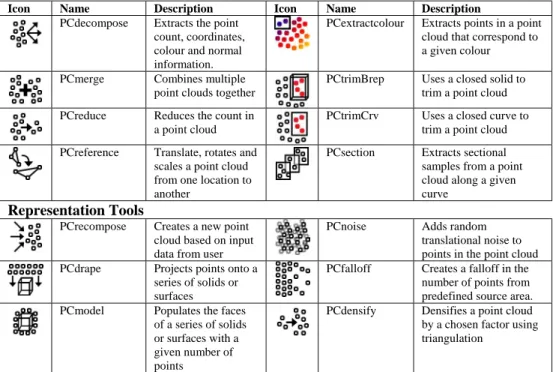
In order to test the effectiveness of using point clouds as a representative format for landscape architecture, a set of 22 different tools have been developed at the time of writing (Table 1). These tools enable the modification, creation and exporting of point cloud models. The “Point Cloud Components” presented here were written in C# and are accessed through Grasshopper, a plug-in to Rhinoceros. This platform was chosen as visual dataflow modelling systems, such as Grasshopper, require only basic if not no scripting skills thus making it readily accessible to designers (JANSSEN & CHEN 2011).
The tools are broadly categorised into three main categories. Modification tools allow for direct manipulation of the point cloud models, such as the ability to extract a certain area or to merge multiple models. Representation tools allow for the creation of new point cloud models to represent a new designed intervention. Lastly, simulation support tools allow for the point cloud models to be coupled to external simulation platforms.
Table 1: Overview of the 22 tools currently developed for use in Grasshopper to work with point cloud objects within Rhinoceros.
Modification Tools
Icon Name Description Icon Name Description
PCdecompose Extracts the point count, coordinates, colour and normal information.
PCextractcolour Extracts points in a point cloud that correspond to a given colour PCmerge Combines multiple
point clouds together
PCtrimBrep Uses a closed solid to trim a point cloud PCreduce Reduces the count in
a point cloud
PCtrimCrv Uses a closed curve to trim a point cloud PCreference Translate, rotates and
scales a point cloud from one location to another
PCsection Extracts sectional samples from a point cloud along a given curve
Representation Tools
PCrecompose Creates a new point cloud based on input data from user
PCnoise Adds random translational noise to points in the point cloud PCdrape Projects points onto a
series of solids or surfaces
PCfalloff Creates a falloff in the number of points from predefined source area. PCmodel Populates the faces
of a series of solids or surfaces with a given number of points
PCdensify Densifies a point cloud by a chosen factor using triangulation
PCmesh Converts a point cloud to a mesh using Delaunay triangulation
PCgrid Simplifies a point cloud into an even grid
Simulation Support Tools
PCimportTXT Imports point clouds from text files
PCclassifyBrep Separates a point cloud into separate layers based on a series of closed solids PCexportTXT Exports point clouds
to text files
PCclassifyCrv Separates a point cloud into separate layers based on a series of closed curves PCexportASC Exports into an
ASCII format for use in Fragstats or ArcGIS
PCcompare Compares the height difference between two point clouds at a specified grid size
5
Proof of Concept
In the following examples we take look at the upstream Gadok / Katulampa area of the Ciliwung River and propose hypothetical changes in order to demonstrate the use of the tools. It should be noted that these examples are purely demonstrative of the tools and workflows indicated and not actual proposed interventions.
Modification tools allow for direct manipulation of the existing points. In this example an existing plot of land is replaced with a different land-use which is copied from another portion of the point cloud and manipulated to fit in almost seamlessly, basically a three dimensional cut and paste using point clouds (Fig. 3).
Fig. 3: Using the modification tools (in this case PCtrimCrv and PCreference), it becomes possible to copy another region of the point cloud over to quickly simulate land use changes.
In addition to this basic form of editing, the representation tools allow for the creation of new point clouds which represent designed interventions. As an example of this, a hypo-thetical dam was created with the tools developed (Fig. 4) which allow for the creation of georeferenced and topographically accurate point clouds based on simple surface models.
Fig. 4: A hypothetical dam is created in a portion of the upstream Gadok/Katulampa site to test the effectiveness of the tools created.
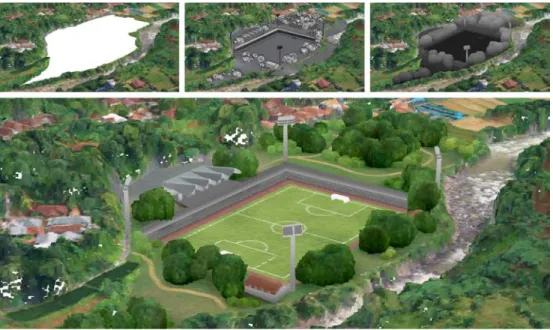
To illustrate this process further, a slightly more complex intervention was created and converted into point clouds using the tools listed. In this case a proposed floodable soccer pitch is created and positioned at the exact elevation required for flood waters from the river to be drained in and out (Fig. 5).
Fig. 5: The area to be modified is extracted and replaced with a simple surface model. This was then converted to point clouds using a combination of PCdrape with PCmodel and finally coloured using PCcolour.
Fig. 6: A combination of the modification and representation tools allow for large stretches of the river to be modified, in this example the entire river was extracted with along with the vegetation and replaced with a canal.
Other than punctual infrastructural changes, the same workflow can be extended to longer portions of the river like that of the downstream Kampung Melayu site which was modified to visualise the canalisation of the river proposed by initial governmental plans (Fig. 6). In contrast to the hard engineering examples shown other options of altering the riparian landscape are also possible with the given tools. The Point Cloud Components and a Bathymetry Toolkit (REKITTKE et. al. In Press) were handed over to a group of ETH students1 who were tasked to explore such alternative options. Here, a much larger portion of the riparian landscape was modified with the inclusion of changes to both the river profile as well as alterations to the urban fabric (Fig. 7). The created point cloud models were then stitched to the original base point cloud model ready to be exported into other formats for analysis.
When used in unison, the tools developed have demonstrated the ability to modify large areas of the landscape while retaining the model, both original and created, in a point cloud format.
1
Elective Course in the Fall Semester 2013, Chair of Landscape Architecture at the Swiss Federal Institute of Technology, ETH Zurich.
Fig. 7: A series of 4 different scenarios were created using the tools provided which allowed the scenarios to be embedded into the base point cloud model of the downstream site.
6
Benefits & Limitations
As the tools are still in a state of change at the time of writing, more work needs to be done to understand the fundamental changes which arise from adopting such a workflow. However, the following initial observations have been made.
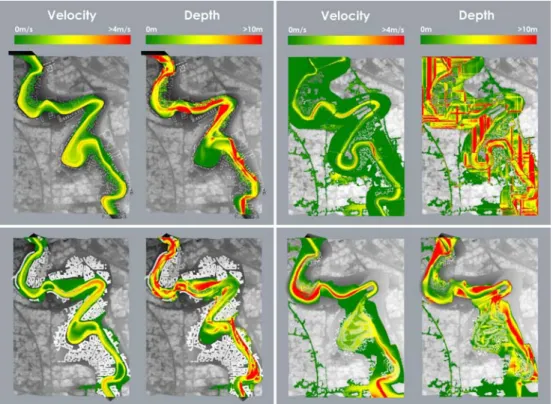
The most obvious benefit is the ability to test the performance of designed riparian landscapes. For flood risk analysis, it does so with the help of hydraulic models (SHAAD & BURLANDO 2013). Here, the simulation support tools that have been developed allow for the point cloud model in Rhinoceros to be exported into a format suitable for hydraulic simulations (Fig. 8). The discrete nature of each individual point in the point cloud as well as the metadata that is attached to them makes this as well as the importing of the results as coloured point clouds possible.
Fig. 8: A visualisation of the flood results showing the velocity and depth of the flood waters during a major flood event. The coloured flood patterns shown are also imported into Rhinoceros as 3D cloud models with the appropriate colour gradient applied to them.
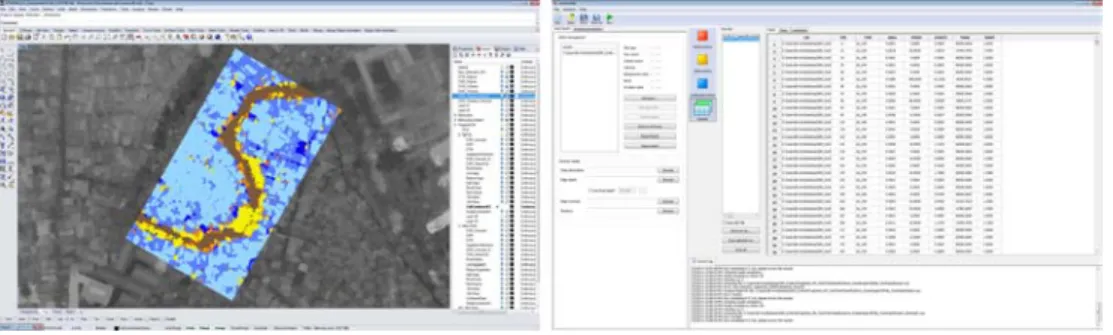
In addition to flood simulations, the tools developed also allow for the point clouds to be exported into other analytical platforms such as Fragstats (MCGARIGAL et al. 2002). Fragstats is a spatial pattern analysis program traditionally used for 2D categorical maps, not 3D point clouds. The underlying research simultaneously seeks to bridge the gap between a point cloud model and Fragstats to uncover the underlying spatial patterns of not only the existing landscapes but proposed ones as well since spatial or environmental patterns influence ecological processes (TURNER 1989). While still in its preliminary stages, initial tests have already proven this to be a possibility (Fig. 9).
Fig. 9: Categorised point clouds models in Rhinoceros can be exported as an ASCII file which can then be analysed in Fragstats. The same ASCII format can be used to analyse point clouds in ArcGIS.
In addition, the workflow and tools developed forces the designer to work in three dimensions, as such every intervention needs to be thought of and fleshed out in 3D space. This contrasts with the traditional two dimensional representations such as perspectives, maps and sections which are still used in the industry to convey design. This shift from a traditional 2D approach when dealing with landscapes at such large scales needs further investigation but will certainly be of interest.
Lastly, from a technical point of view, point cloud models have been found to make more efficient use of available memory as opposed to surface models. Surfaces of three-dimensional objects are often represented by triangular meshes in computer graphics. This triangulation is a not only a time consuming process but also increases storage complexity as connectivity information is required to be saved (LINSEN 2001). Initial tests put the
figure at a 30% reduction in storage space required for when using point clouds versus meshed models. These factors make the modification of point clouds more economical especially when dealing with large landscapes.
Unfortunately, one of the biggest limitations identified so far is still the sheer number of points that needs to be dealt with. The number of points in these models often goes into the tens of millions, if not more, and results in computational bottlenecks. To alleviate this issue, the tools developed have been parallelised where possible to make use of all the processor cores available on a given computer (Table 3). Again, more work needs to be done to further refine the tools developed and to see if there are more cost effective ways to speed them up other than throwing more computational power into the equation.
Table 2: PCgrid was used to simplify a point cloud with 16 million points from a reso-lution of 0.5 m to 50 m. The resultant time was recorded to measure the im-provements derived.
Description Time Taken (Minutes)
Non-parallelised version of PCgrid 84 mins
Parallelised version of PCgrid on a PC with 6 cores 12 mins Parallelised version of PCgrid on a PC with 18 cores 6 mins
Another clear limitation is that the scale at which the designer wishes to work at has to match resolution of the original data capture. As such a designer interested in the façade of a single building will find little use in the point cloud models shown above. To address this issue, smaller scale tests have been done with a Swinglet CAM UAV to explore the possibilities of capturing data over specific areas of the study sites and at specific times. In addition, close range terrestrial techniques are being explored by others in the team (REKITTKE et al. 2013). These additional techniques provide the possibility of supplemen-ting the data collected from the main UAV campaign and vice versa.
For use as purely a representative tool other than the similar scaling issue mentioned, the next biggest hurdle observed is the difficulty in texturing newly created point clouds with the goal of obtaining a realistic visualisation. Currently this involves manually creating a 2D texture map to be projected onto the point cloud. The inherent inability for point cloud models to receive and cast shadows also limits their visualisation potential especially if dealing with lighting analysis.
Lastly, as with all tools, their effectiveness is largely dependent on the user’s proficiency. The skill required to create surface models in a 3D environment and to manipulate the point cloud are still very much user dependent. Hopefully by making the tools simple and accessible, this learning curve will be a gentle one and we should see more developments in this area which adopt such an approach.
7
Future Work & Conclusion
The goal of this research is to enable an interactive loop from design, to simulation to analysis and back to design in a streamlined fashion. These examples show that in their current state, the tools and workflows developed allow for the realisation of large scale designed landscapes to be represented in a point cloud format with an added possibility of extending towards analytical platforms.
That said, many questions still remain to be answered. These include refinement the current set of tools, testing of the effectiveness of using point clouds as a representative format, investigating the fundamental changes adopting such an approach has on designers, defining clear workflows to test and analyse designed landscapes and eventually demon-strating these findings in the real world context of the Ciliwung River.
To conclude, as illustrated in this paper, the use of point clouds to represent large scale landscape architectural projects which are coupled to analytical platforms is made possible through the use of the Point Cloud Components toolset. This suggests the possibility of using point clouds as an effective format in the broader framework of GeoDesign and warrants further investigation into the matter.
References
DRONEMAPPER AERIAL IMAGERY PROCESSING AND PHOTOGRAMMETRY (2013), Webpage, retrieved May 3, 2013, from http://dronemapper.com/.
ERVIN, S. M. (2003), Trends in Landscape Modeling. In: Buhmann, E. & Ervin, S. M. (Eds.), Trends in Landscape Modeling. Proceedings at Anhalt University of Applied Sciences 2003. Wichmann, Heidelberg, 1-7.
FICKER, P., GIROT,C., MELSOM,J. & WEMER,P. (2012), From Reality to Virtuality and
Back Again Teaching Experience within a Postgraduate Study Program. In: Buhmannn et al. (Eds.), Peer Reviewed Proceedings of Digital Landscape Architecture 2012 at Anhalt University of Applied Sciences. Wichmann, Berlin/Offenbach, 130-140.
GRUEN, A. (2009), Virtual Archaeology – New Methods of Image-Based 3D Modeling. In: Reindel, M. & Wagner, G. a. (Eds.), New Technologies for Archaeology. Natural Science in Archaeology. Springer, Berlin/Heidelberg, 287-305.
JANSSEN, P. H. T & CHEN,K. W. (2011), Visual Dataflow Modelling: A Comparison of Three Systems, in Proceedings of the 4th International Conference on Computer Aided Architectural Design Futures, 801-816, paper presented at CAAD Futures 2011, Liege, Belgium.
LANDSCAPE ECOLOGY | FUTURE CITIES LABORATORY (2013), Webpage, retrieved October 4, 2013, from http://www.futurecities.ethz.ch/module/landscape-ecology/.
LINSEN, L. (2001), Point Cloud Representation. Fak. für Informatik, Bibliothek, Univ. Karlsruhe.
MCGARIGAL, K., CUSHMAN, S. A. & ENE, E. (2012), FRAGSTATS v4: Spatial Pattern Analysis Program for Categorical and Continuous Maps. Computer software program produced by the authors at the University of Massachusetts, Amherst. Available at the following web site: www.umass.edu/landeco/research/fragstats/fragstats.html.
REKITTKE, J., PAAR,P. & NINSALAM, Y. (2013), Brawn and Technology under the Urban Canopy. In: Buhmann, E. at al. (Eds.), Peer Reviewed Proceedings of Digital Landscape Architecture 2013 at Anhalt University of Applied Sciences. Wichmann, Berlin/Offen-bach, 12-21.
REKITTKE, J., NINSALAM,Y. & PAAR,P. (in press, 2014), No Fear of Ridicule – deploying plaything technology for credible representations of urban landscape. In: International Journal of Architectural Computing (IJAC), Special Issue of Computer-Aided Archi-tectural Design Research In Asia 2013 (CAADRIA).
SHAAD, K. & BURLANDO,P. (2013), Flood Modelling Sensitivity to DTM Processing in Densely Settled River Corridors. In: Proceedings of Hydro 2013 International, IIT Madras, India.
TURNER, M. G. (1989), Landscape Ecology: The Effect of Pattern on Process. In: Annual Review of Ecology and Systematics, 20, 171-197 (Annual Reviews).
WHITE, D. A. (2013), LIDAR, Point Clouds, and Their Archaeological Applications. In:
Mapping Archaeological Landscapes from Space, SpringerBriefs in Archaeology, Springer, New York, 175-186.