Is the relationship between in‡ation and its uncertainty linear?
M. KARANASOS
aand S. SCHURER
ba
Brunel University, Middlesex, UK
b
Ruhr Graduate School in Economics, Essen, Germany
First draft: April 2005
This version: July 2005
Abstract
We use parametric power ARCH models of the conditional variance of in‡ation and monthly data in Germany, the Netherlands and Sweden for the period 1962-2004 to examine the relationship between in‡ation and in‡ation uncertainty. In two out of the three countries in‡ation signi…cantly raises in‡ation uncertainty as predicted by Friedman. Increased nominal uncertainty a¤ects in‡ation in all countries but not in the same manner. The results for Germany and the Netherlands support the Cukierman-Meltzer hypothesis. In Sweden uncertainty about the future in‡ation appears to have a negative impact on in‡ation.
Keywords: GARCH-in-mean, In‡ation, Level e¤ect, Nominal uncertainty, Power transformation.
JEL Classi…cation: C22, E31.
We would like to thank C. Conrad, C. Hanck and M. Karanassou for their helpful comments and suggestions.
Address for correspondence: RWI Essen, Hohenzollernstrasse 1-3, D-45128 Essen, Germany; Email: [email protected], Tel: +49 (0)201 8149 508; Fax: +49 (0) 201 8149 500.
1
Introduction
The issue of the welfare costs of in‡ation has been one of the most researched topics in macroeconomics both on the theoretical and empirical front. Friedman (1977) argues that a rise in the average rate of in‡ation leads to more uncertainty about the future rate of in‡ation. The opposite type of causation between in‡ation and its uncertainty has also been analyzed in the theoretical literature. Cukierman and Meltzer (1986) argue that central banks tend to create in‡ation surprises in the presence of more in‡ation uncertainty. Clarida et al. (1999) emphasize the fact that since the late 1980s a stream of empirical work has presented evidence that monetary policy may have important e¤ects on real activity. Consequently, there has been a great resurgence of interest in the issue of how to conduct monetary policy. If an increase in the rate of in‡ation causes an increase in in‡ation uncertainty, one can conclude that greater uncertainty-which many have found to be negatively correlated to economic activity-is part of the costs of in‡ation. Thus, if we attempt to provide a satisfactory answer to the questions ‘what actions should the central bankers take?’, and ‘what is the optimal strategy for monetary authorities to follow?’, we must …rst develop some clear view about the temporal ordering of in‡ation and nominal uncertainty.
The GARCH time series studies that examine the link between in‡ation rates and in‡ation uncertainty use various sample periods, frequency data sets and empirical methodologies. For example, Baillie et al. (1996) employ an ARFIMA-GARCH-in-mean model, Grier and Perry (1998) and Fountas and Karanasos (2005) estimate univariate component GARCH speci…cations, Conrad and Karanasos (2005a,b) utilize the ARFIMA-FIGARCH model, and Fountas et al. (2005) use a bivariate constant correlation GARCH formulation. Despite using di¤erent GARCH speci…cations all these studies focus exclusively on the standard Bollerslev type of model.
There seems to be no obvious reason why one should assume that the conditional variance is a linear function of lagged squared errors. The common use of a squared term in this role is most likely to be a re‡ection of the normality assumption traditionally invoked working with in‡ation data. However, if we accept that in‡ation data are very likely to have a non-normal error distribution, then the superiority of a squared term is lost and other power transformations may be more appropriate. Indeed, for non-normal data, by squaring the in‡ation rates one e¤ectively imposes a structure on the data which may potentially furnish sub-optimal modelling and forecasting performance relative to other power terms. If
trepresents in‡ation in periodtthis paper considers the temporal properties of the functions ofj tjdfor
positive values ofd. We …nd, as an empirical fact, that the autocorrelation function ofj tjd is a concave
function ofdand reaches its maximum whendis smaller than one. This result appears to argue against Bollerslev’s type of GARCH model.
In this paper, the above issues are analyzed empirically for Germany, the Netherlands and Sweden with the use of a parametric power ARCH model (PARCH). The PARCH model may also be viewed as a standard GARCH model for observations that have been transformed by a sign-preserving power trans-formation implied by a (modi…ed) PARCH parameterization. The PARCH model increases the ‡exibility of the conditional variance speci…cation by allowing the data to determine the power of in‡ation for which the predictable structure in the volatility pattern is the strongest. This feature in the volatility processes of in‡ation has major implications for the in‡ation-uncertainty hypothesis. To test for the relationship between in‡ation uncertainty and in‡ation we use the simultaneous-estimation approach. Under this ap-proach, we estimate a PARCH-in-mean model with the conditional variance equation incorporating lags of the in‡ation series (the ‘level’e¤ect), thus allowing simultaneous estimation and testing of the bidirec-tional causality between the in‡ation series and the associated uncertainty. Moreover, He and Teräsvirta (1999) emphasize that if the standard Bollerslev type of model is augmented by the ‘heteroscedasticity parameter’ (the ‘power’ term), the estimates of the ARCH and GARCH parameters almost certainly change. More importantly, we …nd that the in‡ation-uncertainty relation is sensitive to changes in the values of the ‘heteroscedasticity parameter’. Put di¤erently, the estimated values of the ‘in-mean’ and the ‘level’e¤ects are fragile to changes in the ‘power’term.
This article is organized as follows: Section 2 considers the hypotheses about the causality between in‡ation and in‡ation uncertainty in more detail. In Section 3, we describe the time series model for in‡ation and uncertainty about in‡ation and discuss its merits. The empirical results are reported in Section 4. Section 5 contains summary remarks and conclusions.
2
The link between in‡ation and its uncertainty
2.1
Theory
In this Section, we discuss the economic theory concerning the link between in‡ation uncertainty and macroeconomic performance. Since Friedman (1977) stressed the harmful e¤ects of nominal uncertainty on employment and production much research has been carried out investigating the relationship between in‡ation and uncertainty about in‡ation. The e¤ect of in‡ation on its unpredictability is theoretically ambiguous. Several researchers contend that since a reduction in in‡ation causes an increase in the rate of unemployment, a high rate of in‡ation produces greater uncertainty about the future direction of government policy and the future rates of in‡ation. Ball’s (1992) model formalizes this idea in the context of a repeated game between the monetary authority and the public. Ball (1992) extends a Barro-Gordon model of a repeated game by introducing exogenous shocks and two Central Bank policy-makers, one Conservative and one Liberal, who have di¤erent preferences over how to react in times of high in‡ation. In these times the public is confused because it does not know which policy maker is in charge, which in turn increases their uncertainty about future in‡ation. According to the Friedman hypothesis we test for a positive e¤ect of in‡ation on its uncertainty. In contrast, Ungar and Zilberfarb (1993) propose a mechanism that may weaken, o¤set, or even reverse the direction of the traditional view concerning the in‡ation-uncertainty relationship. They argue that as in‡ation rises economic agents invest more resources in forecasting in‡ation, thus reducing nominal uncertainty. However, this e¤ect might only be present in periods of high in‡ation. This means that the e¤ect comes into action only if the in‡ation rate surpasses a crucial threshold.
On the other hand, Cukierman and Meltzer (1986) predict that an increase in in‡ation uncertainty will raise average in‡ation due to the behavior of the Central Bank in an uncertain environment. Their model is embedded in a Barro-Gordon setting in which there exists no commitment mechanism for the Central Bank. Therefore, the Central Bank can pursue two objectives: keeping in‡ation low and stimulating the economy by surprise in‡ation. Since the objective function of the Central Bank and the money supply process are modelled as random variables, the public has di¢ culties to infer what caused higher in‡ation. It could be either that the Central Bank …nds it more important to stimulate the economy or that a random money supply shock occurred. Due to this information asymmetry the Central Bank has an incentive to create in‡ation surprises in the presence of higher nominal uncertainty.
Finally, Holland (1995) predicts the opposite e¤ect of in‡ation uncertainty on average in‡ation. He assumes the Central Bank to be following a stabilisation motive. If the Central Bank analysts observe increasing in‡ation uncertainty due to an increasing in‡ation rate, the Central Bank will contract the money supply. This measure is justi…ed by reducing the potential of severe negative welfare e¤ects. According to the Holland hypothesis, we test for a negative e¤ect of uncertainty on in‡ation.
2.2
Empirical Evidence
In this Section, we discuss previous empirical testing of the in‡ation-uncertainty hypothesis. The rela-tionship between in‡ation and its uncertainty has been analyzed extensively in the empirical literature. Recent time series studies have focused on the GARCH conditional variance of in‡ation as a statistical measure of its uncertainty. To test for the relationship between uncertainty and indicators of macro-economic performance, such as in‡ation, one can use either the two-step or the simultaneous-estimation approach.
Under the two-step approach, estimates of the conditional variance are obtained from the estimation of the standard GARCH model and then these estimates are used in running Granger-causality tests to examine the causality between the two variables. In particular, Grier and Perry (1998) …nd that in all G7 countries in‡ation signi…cantly raises its uncertainty. They also …nd evidence in favor of the Cukierman-Meltzer hypothesis for some countries and in favor of the Holland hypothesis for other countries. Fountas et al. (2004), using quarterly data and employing the EGARCH model, …nd that in …ve European countries in‡ation signi…cantly raises nominal uncertainty. Their results regarding the direction of the impact of a change in in‡ation uncertainty on in‡ation were generally consistent with the existing rankings of Central Bank independence. Conrad and Karanasos (2005b) analyze the in‡ation dynamics of several
countries belonging to the European Monetary Union and of the UK. They provide strong evidence that increased in‡ation raises its uncertainty. However, they …nd that uncertainty surrounding future in‡ation has a mixed impact on in‡ation.
Some studies use GARCH models that include a function of the lagged in‡ation rate in the conditional variance equation. In particular, Brunner and Hess (1993) allow for asymmetric e¤ects of in‡ation shocks on nominal uncertainty and …nd a weak link between US in‡ation and its uncertainty. Two studies use GARCH type models with a joint feedback between the conditional mean and variance of in‡ation. Baillie et al. (1996), for three high in‡ation countries and the UK, and Karanasos et al. (2004) for the US, …nd strong evidence in favor of a positive bidirectional relationship in accordance with the predictions of economic theory.
There are only two studies using European data that are based on GARCH measures of in‡ation uncertainty. They are Fountas et al. (2004) and Conrad and Karanasos (2005b). This study aims to …ll the gaps arising from the lack of interest in the European case where the results would have interesting implications for the successful implementation of common European monetary policy and from the methodological shortcomings of the previous studies.
3
PARCH Model
Since its introduction by Ding et al. (1993), the properties of the PARCH model have been frequently ex-amined. Laurent (2004) derives analytical expressions for the score of the asymmetric PARCH (APARCH) speci…cation while Karanasos and Kim (2005) study its autocorrelation function. The use of the PARCH model is now widespread in the literature (see, for example, Conrad and Karanasos, 2004 and Conrad et al., 2004).
Let t follow an autoregressive (AR) process augmented by a ‘risk premium’ de…ned in terms of
volatility (L) t= 0+kg(ht) +"t; (1) with "t eth 1 2 t;
where by assumption the …nite order polynomial (L)
p
P
i=1 i
Li has zeros outside the unit circle. In addition, fetg are independent, identically distributed random variables with E(et) = E(e2t 1) =
0. htis positive with probability one and is a measurable function of t 1, which in turn is the
sigma-algebra generated byf t 1; t 2; : : :g. That ishtdenotes the conditional variance of the in‡ationf tg,
( tj t 1) (0; ht).
Furthermore, we need to choose the form in which the time-varying variance enters the speci…cation of the mean to determine the ‘risk premium’. This is a matter of empirical evidence. In the empirical results that follow we employ three speci…cations for the functional form of the ‘risk premium’. That is, we useg(ht) =ht,g(ht) =pht, or g(ht) =ln(ht).
Moreover, ht is speci…ed as an APARCH(1,1) process with lagged in‡ation included in the variance
equation
h2
t =!+ ht2 1f(et 1) + ht2 1+ l t l; (2)
with
f(et 1) [jet 1j &et 1] ;
where ( >0) is the ‘heteroscedasticity’ parameter, and are the ARCH and GARCH coe¢ cients
respectively, and& (j&j<1) is the leverage term. Within the APARCH model, by specifying permissible values for , , l,& and in (2), it is possible to nest a number of the more standard ARCH and GARCH speci…cations (see Ding et al., 1993).
In order to distinguish the general model in (1) from a version in which k= l=& = = 0, we will hereafter refer to the former as APGARCH-in-mean-level (APGARCH-ML) and the latter as PARCH.
4
Empirical Analysis
4.1
The data
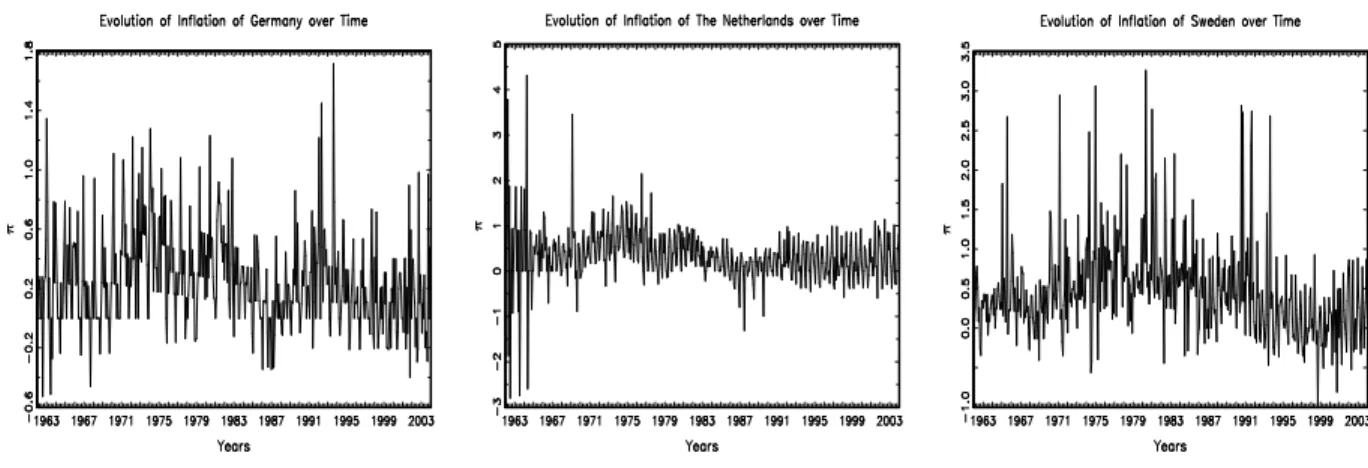
We use monthly data on the CPI (Consumer Price Index) as proxies for the price level.1 The data range from 1962:01 to 2004:01 and cover three European countries, namely, Germany, the Netherlands, and Sweden. In‡ation is measured by the monthly di¤erence of the log CPI [ t = 100log(CPIt=CPIt 1)].
Allowing for di¤erencing leaves 504 usable observations. The in‡ation rates of the three countries are plotted in …gure 1. The results of the Phillips-Perron unit root tests (not reported) imply that we can treat the three in‡ation rates as stationary processes. The summary statistics (not reported) indicate that the distribution of the three in‡ation series is skewed to the right and has fat tails. The large values of the Jarque-Bera statistic imply a deviation from normality.
Figure 1. Evolution of in‡ation over time.
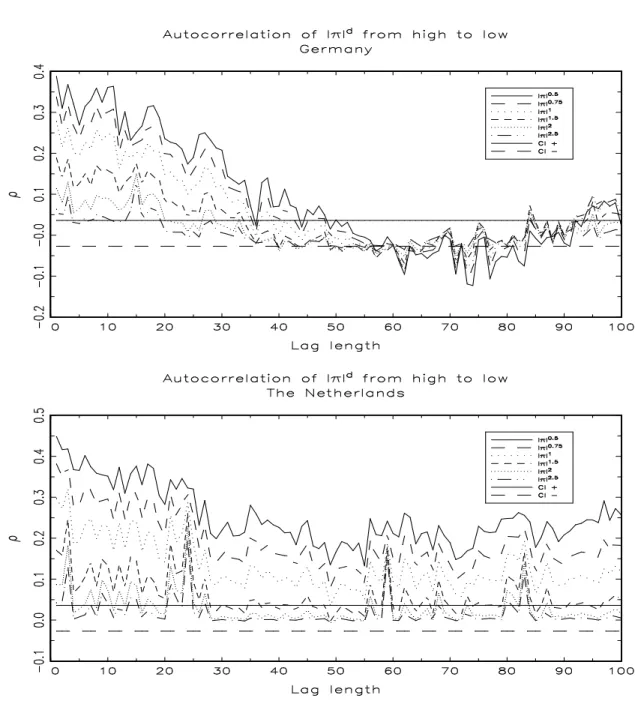
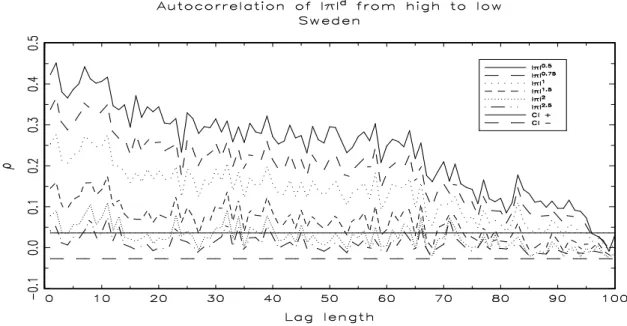
Next, we examine the sample autocorrelations of the power transformed absolute in‡ation j tjd for
various positive d. Figure 2 shows the autocorrelogram of j tjd from lag 1 to 100 ford = 0:5; 0:75; 1;
1:5; 2; 2:5. The horizontal lines show the 1:96=pT which is the con…dence interval for the estimated sample autocorrelations if the process tis independently and identically distributed (i.i.d). In our case
T = 505, so 1:96=pT = 0:0872.
The sample autocorrelations forpj tjare greater than the sample autocorrelations forj tjd (d= 0:5;
0:75; 1; 1:5; 2; 2:5) at every lag up to at least 100 lags for the Netherlands and Sweden, and up to at least 50 lags for Germany. In other words, the most interesting …nding from the autocorrelogram is that
j tjd has the largest autocorrelation whend= 0:5. Furthermore, the power transformations of absolute
in‡ation when dis less or equal to one have signi…cant positive autocorrelations at least up to lag 100, 95 and 35 for the Netherlands, Sweden and Germany respectively.
1Since most of the studies use CPI based in‡ation measures (i.e., Conrad and Karanasos, 2005a,b) we construct our in‡ation and in‡ation uncertainty measures from the Consumer Price Index. Alternatively, one can use either the Producer Price Index (PPI) or the GNP de‡ator. Brunner and Hess (1993) use all three measures of in‡ation but they discuss only the results using CPI in‡ation. Grier and Perry (2000) and Fountas and Karanasos (2005) use both (CPI and PPI) indices and …nd that the CPI and PPI results are virtually identical.
To illustrate this more clearly, we calculate the sample autocorrelations (d)as a function ofd,d >0, for lags = 1;12;60;96and taking d= 0:125;0:25; : : : ;1:75;1:875;2; : : : ;4:5. Figure 3 gives the plots of calculated (d)at = 1;12;60;96. For example, for lag 12, there is a unique pointd around0:5,0:6
and0:8for Sweden, the Netherlands and Germany respectively, such that 12(d)reaches its maximum at this point: 12(d )> 12(d)ford6=d .
Figure 3. Autocorrelations of j tjd at lags 1, 12, 60 and 96.
4.2
Estimated models of in‡ation
We proceed with the estimation of the AR-PGARCH(1,1) model in equations (1) and (2) in order to take into account the serial correlation observed in the levels and power transformations of our time series data. Table 1 reports the results for the period 1962-2004.2
The existence of outliers causes the distribution of in‡ation to exhibit excess kurtosis. To accom-modate the presence of such leptokurtosis, one should estimate the PGARCH models using non-normal 2Due to space limitations, we have not reported the estimated equations for the conditional means. They are available upon request from the authors.
distributions. As reported by Palm (1996), the use of a student-t distribution is widespread in the litera-ture. In accordance with this, we estimate all the models using two alternative distributions: the normal and the student-t.
The b parameter is signi…cant for all countries but Sweden (when the innovations et are student-t
distributed), while ^ is highly signi…cant for all countries. For all countries we …nd the leverage term
& to be insigni…cant and therefore we re-estimate the model excluding this parameter. In only one out of the six cases was the estimated power term statistically signi…cant. This case is Sweden when the distribution of the errors is student-t. In order to distinguish the general PGARCH model from a version in which is …xed to a speci…c value we will hereafter refer to the latter as (P)GARCH.
For the Netherlands the Akaike Information Criterion (AIC) choose (P)GARCH models with power term parameters ( ) between 1 and 1.5. In Germany the values of the power coe¢ cients for the two preferred speci…cations are below 1. For Sweden, when the errors"tare conditionally normal, the chosen
value of the power coe¢ cient (0.40) is markedly lower than the estimated power term with t-distributed errors (1.71).
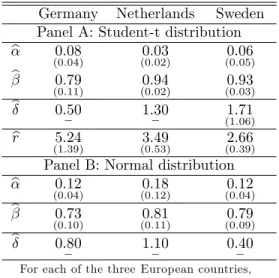
Table 1. PGARCH Models.
Germany Netherlands Sweden
Panel A: Student-t distribution
b 0:08 (0:04) (00::0302) (00::0605) b 0:79 (0:11) (00::9402) (00::9303) b 0:50 1:30 1:71 (1:06) b r 5:24 (1:39) (03::4953) (02::6639)
Panel B: Normal distribution
b 0:12
(0:04) (00::1812) (00::1204) b 0:73
(0:10) (00::8111) (00::7909) b 0:80 1:10 0:40
For each of the three European countries, Table 1 reports estimates of the
parameters for the PGARCH model.r are the degrees of freedom of the student-t distribution. The numbers in parentheses are standard errors.
Next, we report the estimation results of an AR-PGARCH-M model of in‡ation for the three European countries. Table 2a reports only the estimated parameters of interest. In all countries the estimates for the ‘in-mean’parameter (bk) are statistically signi…cant. In Germany and the Netherlands there is evidence in favor of the Cukierman-Meltzer hypothesis since the value of the ‘in-mean’ coe¢ cient is positive. Evidence in favor of the Holland hypothesis applies in Sweden. Hence, overall, the evidence on the e¤ect of in‡ation uncertainty on in‡ation is mixed.
Table 2a. PGARCH-M Models.
Germany Netherlands Sweden
Panel A: Student-t distribution
b k 0:97 (0:60) 0:08 ? (0:03) (00::03)06 b 0:50 0:8 1:63 (0:89) b r 5:30 (1:42) (03::5053) (02::4107)
Panel B: Normal distribution
b
k 0:97
(0:60) 0(0:34:16) (00:13):33 b 0:80 1:00 0:40
For each of the three European countries, Table 2a reports estimates of the parameters (of interest) for the PGARCH-M model. The numbers in parentheses are standard errors. g(ht) =pht. ? g(ht) = ln(ht).
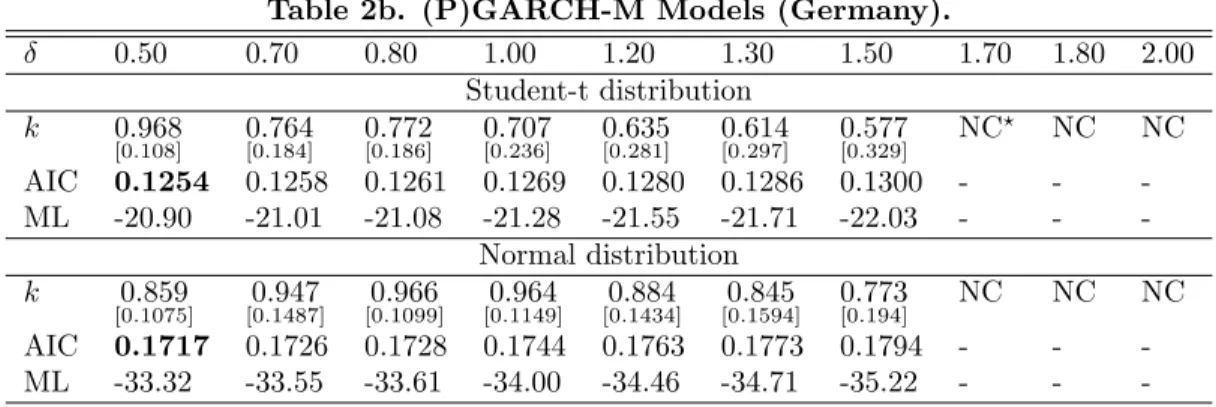
Table 2b reports, for Germany, estimates of the k parameters of the (P)GARCH-M model with
g(ht) =ht, for various positive . The estimated values of the ‘in mean’e¤ect are sensitive to changes
in the ‘power’ term. Note that, when the student-t distribution is used, the bk parameter is signi…cant only when = 0:5. When the errors are conditionally normal, the signi…cance of the ‘risk premium’ decreases monotonically when exceeds 0:80. It is important to mention that the AIC is minimized when = 0:5. The most interesting …nding is that the autocorrelation function of j tjd reaches its
maximum, approximately, at this point.
Table 2b. (P)GARCH-M Models (Germany).
0.50 0.70 0.80 1.00 1.20 1.30 1.50 1.70 1.80 2.00 Student-t distribution k 0:968 [0:108] 0[0::764184] [00::772186] 0[0::707236] 0[0::635281] [00::614297] 0[0::577329] NC ? NC NC AIC 0.1254 0.1258 0.1261 0.1269 0.1280 0.1286 0.1300 - - -ML -20.90 -21.01 -21.08 -21.28 -21.55 -21.71 -22.03 - - -Normal distribution k 0:859 [0:1075] [00::1487]947 [00::1099]966 [00::1149]964 [00::1434]884 [00::1594]845 0[0::773194] NC NC NC AIC 0.1717 0.1726 0.1728 0.1744 0.1763 0.1773 0.1794 - - -ML -33.32 -33.55 -33.61 -34.00 -34.46 -34.71 -35.22 - -
-Table 2b reports estimates of the ‘in mean’ parameters of the (P)GARCH-M model withg(ht) =ht,for various positived. The numbers in brackets arepvalues. ? No convergence. The bold numbers indicate the minimum value of the AIC.
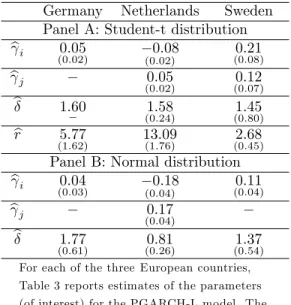
In what follows we report the estimation results of an AR-PGARCH-L model of in‡ation in three countries with lagged in‡ation included in the conditional variance (the ‘level’e¤ect). In the expressions for the conditional variances reported in Table 3, various lags of in‡ation (from 1 to 12) were considered with the best model chosen on the basis of the minimum value of the AIC. Statistically signi…cant e¤ects are present for all countries. In Germany and Sweden there is strong evidence that in‡ation a¤ects its uncertainty positively as predicted by Friedman (1977) and Ball (1992). In sharp contrast, in‡ation may cause lower nominal uncertainty in the Netherlands, thus supporting the Ungar-Zilberfarb argument.
Table 3. PGARCH-L Models.
Germany Netherlands Sweden
Panel A: Student-t distribution
bi 0:05 (0:02) (00:02):08 0:21 (0:08) bj 0:05 (0:02) (00::1207) b 1:60 1:58 (0:24) (01::4580) b r 5:77 (1:62) 13(1::76)09 (02::6845)
Panel B: Normal distribution
bi 0:04 (0:03) (00:04):18 (00::1104) bj 0:17 (0:04) b 1:77 (0:61) (00::8126) (01::3754)
For each of the three European countries, Table 3 reports estimates of the parameters (of interest) for the PGARCH-L model. The numbers in parentheses are standard errors. i= 10;2;and4for Germany, the Netherlands and Sweden respectively.
j= 3; and7 for the Netherlands and Sweden respectively.
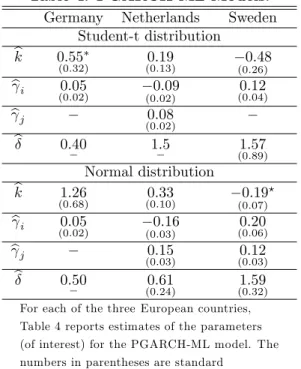
Finally, we report the estimation results of an AR-PGARCH-ML model. That is, we estimate a system of equations that allows only the current value of the conditional variance to a¤ect average in‡ation and that also allows up to the twelfth lag of average in‡ation to in‡uence the conditional variance. Table 4 reports only the estimated parameters of interest. As with the simple ‘level’model, we …nd again support of the Friedman’s hypothesis for Germany and Sweden whereas for the Netherlands we …nd that the e¤ect of in‡ation on its uncertainty is negative as predicted by Ungar and Zilberfarb (1993). Moreover, we …nd mixed evidence regarding the direction of the impact of a change in nominal uncertainty on in‡ation. That is, we …nd evidence in favor of the Cukierman-Meltzer hypothesis for Germany and the Netherlands and in favor of the Holland hypothesis for Sweden.
Table 4. PGARCH-ML Models.
Germany Netherlands Sweden
Student-t distribution b k 0:55 (0:32) (00::1913) (00:26):48 bi 0:05 (0:02) (00:02):09 0:12 (0:04) bj 0:08 (0:02) b 0:40 1:5 1:57 (0:89) Normal distribution b k 1:26 (0:68) (00::3310) 0:19 ? (0:07) bi 0:05 (0:02) (00:03):16 0:20 (0:06) bj 0:15 (0:03) (00::1203) b 0:50 0:61 (0:24) (01::5932)
For each of the three European countries, Table 4 reports estimates of the parameters (of interest) for the PGARCH-ML model. The numbers in parentheses are standard
errors. g(ht) =pht. ? g(ht) = ln(ht).
i= 10;2;and4for Germany, the Netherlands and Sweden respectively.
5
Conclusions
We have used monthly data on in‡ation in Germany, the Netherlands and Sweden to examine the possible relationship between in‡ation and its uncertainty, and hence test a number of economic theories. The results in this paper highlight the importance of using the PGARCH speci…cation in order to model the power transformation of the conditional variance of in‡ation. The PGARCH model increases the ‡exibility of the conditional variance speci…cation by allowing the data to determine the power of in‡ation for which the predictable structure in the volatility pattern is the strongest.
The application of the PGARCH approach allows us to derive two important conclusions. First, the Friedman hypothesis that in‡ation leads to more nominal uncertainty applies in two out of the three European countries. Similarly, mixed evidence is found regarding the direction of the impact of a change in uncertainty on in‡ation. We found that uncertainty about in‡ation causes negative nominal e¤ects in Sweden. This evidence favors the ‘stabilization hypothesis’put forward by Holland (1995). In Germany and the Netherlands we found strong evidence in favor of the Cukierman-Meltzer hypothesis. According to Devereux (1989) in‡ation uncertainty can have a positive impact on in‡ation via the real uncertainty channel. If the variability of real shocks is the predominant cause of nominal uncertainty, then in‡ation uncertainty and in‡ation are positively correlated. As real shocks become more variable the optimal degree of indexation declines. The in‡ation rate rises only after the degree of indexation falls. Assuming that changes in the degree of indexation take time to occur, greater in‡ation uncertainty precedes higher in‡ation.
References
[1] Baillie, R. T., Chung, C., Tieslau, M., 1996. Analyzing in‡ation by the fractionally integrated ARFIMA-GARCH model. Journal of Applied Econometrics 11, 23-40.
[2] Ball, L., 1992. Why does high in‡ation raise in‡ation uncertainty? Journal of Monetary Economics 29, 371-388.
[3] Brunner, A. D., Hess, G. D., 1993. Are higher levels of in‡ation less predictable? A state-dependent conditional heteroscedasticity approach. Journal of Business and Economic Statistics 11, 187-197. [4] Clarida, R., Galí, J., Gertler, M., 1999. The science of monetary policy: a new Keynesian Perspective.
Journal of Economic Literature, 1661-1707.
[5] Conrad C., Jiang, F., Karanasos, M., 2004. Modelling and predicting exchange rate volatility via power ARCH models: the role of long-memory. Unpublished paper, University of Mannheim. [6] Conrad, C., Karanasos, M., 2004. Fractionally integrated APARCH modelling of stock market
volatil-ity: a multi country study. Unpublished paper, University of Mannheim.
[7] Conrad, C., Karanasos, M., 2005a. On the in‡ation-uncertainty hypothesis in the USA, Japan and the UK: a dual long memory approach. Japan and the World Economy 17, 327-343.
[8] Conrad, C., Karanasos, M., 2005b. Dual long memory in in‡ation dynamics across countries of the Euro area and the link between in‡ation uncertainty and macroeconomic performance. Studies in Nonlinear Dynamics and Econometrics, forthcoming.
[9] Cukierman, A., Meltzer, A., 1986. A theory of ambiguity, credibility, and in‡ation under discretion and asymmetric information. Econometrica 54, 1099-1128.
[10] Devereux, M., 1989. A positive theory of in‡ation and in‡ation variance. Economic Inquiry 27, 105-116.
[11] Ding, Z., Granger, C.W.J., Engle, R.F., 1993. A long memory property of stock market returns and a new model. Journal of Empirical Finance 1, 83-106.
[12] Fountas, S., Ioannidi, A., Karanasos, M., 2004. In‡ation, in‡ation uncertainty, and a common Eu-ropean monetary policy. Manchester School 2, 221-242.
[13] Fountas, S., Karanasos, M., 2005. In‡ation, output growth, and nominal and real uncertainty: evi-dence for the G7. Journal of International Money and Finance, forthcoming.
[14] Fountas, S., Karanasos, M., Kim, J., 2005. In‡ation uncertainty, output growth uncertainty and macroeconomic performance. Oxford Bulletin of Economics and Statistics, forthcoming.
[15] Friedman, M., 1977. Nobel lecture: In‡ation and Unemployment. Journal of Political Economy 85, 451-472.
[16] Grier, K., Perry, M., 1998. On in‡ation and in‡ation uncertainty in the G7 countries. Journal of International Money and Finance 17, 671-689.
[17] Grier, K., Perry, M., 2000. The e¤ects of real and nominal uncertainty on in‡ation and output growth: some GARCH-M evidence. Journal of Applied Econometrics 15, 45-58.
[18] He, C., Teräsvirta, T., 1999. Statistical properties of the asymmetric power ARCH model, in En-gle, R.F.., White, H., Cointegration, causality and forecasting. Festchrift in honour of Clive W. J. Granger, Oxford University Press, Oxford, 462-474.
[19] Holland, S., 1995. In‡ation and uncertainty: tests for temporal ordering. Journal of Money, Credit, and Banking 27, 827-837.
[20] Karanasos, M., Karanassou, M., Fountas, S., 2004. Analyzing US in‡ation by a GARCH model with simultaneous feedback. WSEAS Transactions on Information Science and Applications 2, 767-772. [21] Karanasos, M., Kim, J., 2005. A re-examination of the asymmetric power ARCH model. Journal of
Empirical Finance, forthcoming.
[23] Palm, F. C., 1996. GARCH models of volatility, in: Maddala, G. S., Rao, C. R., Handbook of Statistics: Statistical Methods in Finance, Vol. 14. North Holland, Amsterdam, 209-240.
[24] Ungar, M., Zilberfarb, B., 1993. In‡ation and its unpredictability- theory and empirical evidence. Journal of Money, Credit, and Banking 25, 709-720.