P
ag
e
42
Finance & Banking Studies
IJFBS, VOL 5 NO 3 ISSN: 2147-4486
Contents available at www.ssbfnet.com/ojsDoi:10.20525/ijfbs.v5i3.278
What Makes Underwriting and Non-Underwriting
Clients of Brokerage Firms Receive Different
Recommendations? An Application of Uplift
Random Forest Model
Shaowen Hua
La Salle University, Accounting Department
Abstract
I explore company characteristics which explain the difference in analysts’ recommendations for companies that were underwritten (affiliated) versus non-underwritten (unaffiliated) by analysts’ brokerage firms. Prior literature documents that analysts issue more optimistic recommendations to underwriting clients of analysts’ brokerage employers. Extant research uses regression models to find general associations between recommendations and financial qualities of companies, with or without underwriting relationship. However, regression models cannot identify the qualities that cause the most difference in recommendations between affiliated versus unaffiliated companies. I adopt uplift random forest model, a popular technique in recent marketing and healthcare research, to identify the type of companies that earn analysts’ favor. I find that companies of stable earnings in the past, higher book-to-market ratio, smaller sizes, worsened earnings, and lower forward PE ratio are likely to receive higher recommendations if they are affiliated with analysts than if they are unaffiliated with analysts. With uplift random forest model, I show that analysts pay more attention on price-related than earnings-related matrices when they value affiliated versus unaffiliated companies. This paper contributes to the literature by introducing an effective predictive model to capital market research and shedding additional light on the usefulness of analysts’ reports.
Key Words: Uplift Modeling; Analyst; Recommendation; Underwriting; Brokerage. JEL classification: C8; G2
Introduction
In this paper, I explore the company characteristics that explain different recommendations given by sell-side analysts for underwriting (affiliated) clients and non-underwriting (unaffiliated) clients. Sell-sell-side equity analysts are financial experts who work for the research department of large brokerage firms. They do
Peer-reviewed Academic Journal published by SSBFNET with respect to copyright holders.
P
ag
e
43
research on companies, write investment reports about stocks, and advise clients on trading strategies. Objectivity of analysts has been seriously questioned in the past two decades. Prior literature documents that analysts’ earnings forecasts and stock recommendations are overly optimistic, because favorable opinions generate trading commissions (Irvine 2000; Jackson 2005) and underwriting fees (Lin and McNichols 1998; Ertimur, Muslu, and Zhang 2011) for their brokerage employers. While financial press blames analysts for intentionally misleading investors (Craig and Weil 2001), a few scholars argue for analysts in that over-optimism in earnings forecasts and recommendations is resulted from analysts’ censorship in covering stocks. Analysts report only well-performing stocks and drop inferior ones. If analysts were to continue following those low-quality stocks, they would express negative opinions, and the overall average of earnings forecasts and recommendations would appear less optimistic (McNichols and O’Brien 1997). Empirical evidence shows that the IPOs with more analysts’ coverage yield significantly better returns than the IPOs with smaller analysts’ coverage (Das, Guo, and Zhang 2006), and that favorable recommendations do not necessary win underwriting businesses for analysts’ brokerage firms (Ljungqvist, Marston, and Wilhelm 2006). Whether investors can trust analysts’ information is still an unsolved debate.
Examining only the investment banking relationship does not render ground to say whether analysts’ reports are useful to investors. Stock prices are affected by many corporate information and macro-economic events. If analysts’ recommendations reflect value generating features of companies even under the brokerage business pressure, then analysts’ reports are still informative to investors. Extant accounting and finance research relies on regression models to find association between recommendations and affiliation. In a regression model, researchers use recommendations as the dependent variable and observe how the sign and the significance of the coefficient of the affiliation change as they gradually add control variables that are proved to be associated with recommendation in prior literature. Regression models allow researchers to interpret the association between recommendations and affiliation at an aggregate level, but they are incapable of detecting which control variables are most likely to cause the affiliated company to receive a favorable recommendation. Uplift random forest model is designed to find the most responsive subsample by combining decision tree and ordered logistic model. Uplift random forest model begins with developing decision trees by ranking the importance of control variables. Following the order of the importance of control variables, uplift random forest then predicts the probability of receiving good recommendations for affiliated and unaffiliated companies. Finally, difference in probabilities of affiliated and unaffiliated companies are ranked into quintiles, and researchers can identify the control variables that best explain the difference in recommendations between affiliated and unaffiliated companies.
Using uplift random forest model, I find that affiliated companies receive better recommendations than unaffiliated companies because they are smaller, report less volatile earnings, exhibit worsened earnings but higher book-to-market ratios, whose stocks are held by analyst’s brokerage firm, followed by more analysts, and have lower forecasted price-to-earnings ratios. The results also show that the difference in likelihood of receiving favorable recommendations between affiliated and unaffiliated companies is larger after 2002, the year when regulatory reforms of investment banking industry were enacted. These findings imply that even under investment banking business pressure, analysts still value measures that reveal prospect of the company.
My paper contributes to the literature in two ways. First, most of papers examining associations between analysts’ outputs and analysts’ incentives provide a general conclusion without looking further into how financial characteristics of companies affect the association between analysts’ research outputs and incentives. This paper is the first to investigate factors that contribute to the span of analysts’ recommendations between affiliated and unaffiliated companies. I show that analysts, albeit under pressure of brokerage businesses, still rank stocks according to critical financial indicators of companies. My findings shed additional light in the debate of usefulness of analysts’ reports in that analysts appear to strive to be objective, and analysts’ reports are useful to investors. Second, I introduce a new method to capital markets research. Uplift random forest model is known for detecting qualities of subjects that are most responsive to treatment such as a promotional program and a drug, and the methodology is popular in
Peer-reviewed Academic Journal published by SSBFNET with respect to copyright holders.
P
ag
e
44
marketing and health care research. My initial effort of applying uplift random forest model to analysts’ recommendations shows that this technique can be used in other capital market research areas such as regulation effects, audit testing, and corporate governance mechanisms… etc.
In the next section, I review literature of sell-side equity analysts and uplift random forest model. In the section of methodology, I explain the construction of sample and variables and implementation of uplift random forest model. Results are reported in the fourth section, followed by the conclusion.
Literature Review
Analysts’ Reports and Incentives
Prior literature documents that analysts’ research reports are informative to market as the stock price moves around the day when the analyst revises his/her earnings forecasts (Lys and Sohn 1990), and the stock price moves in the same direction as the recommendations are updated (Stickel 1995). Analysts are supposed to provide objective information about stocks to investors. However, since majority of analysts are employed by brokerage firms, analysts’ message on research reports is inevitably affected by their employers’ businesses. Brokerage firms make revenues primarily out of three sources: trading commissions, underwriting fees, and M&A advising fees. Anecdotal stories tell us that analysts strive to develop good relationship with trading clients (Lauricella 2001), because the quicker and the more private information analysts can provide for institutional investors, the more likely institutional investors vote for “star analysts” on polls of Institutional Investor II Magazine or the Wall Street Journal, which is an important determinant of analysts’ compensation (Stickel 1992; Groysberg, Healy, and Mabor 2008). Since investors are pleased by analyst’s service, they are likely to place trading orders through analysts’ brokerage firms (Irvine 2007), which helps generate trading income for the brokerage firm. In order to gain access to private information, analysts would revise earnings forecasts and recommendations as corporate managers expect (Francis and Philbrick 1993; Richardson, Teoh, and Wysocki 2004; Feng and McVay 2010). Another reason why analysts please corporate managers is that debt or equity offerings of companies create underwriting income for analysts’ brokerage firms. When a company wants to go public, its name is usually not well recognized in the marketplace. By guaranteeing coverage and helping run the “road show”, analysts can help the new company find investors and sustain the stock price after IPOs (Bradley, Jordan, and Ritter 2003). Empirical evidence documents that sell-side analysts give more positive recommendations to affiliated stocks than to unaffiliated ones (Lin and McNichols 1998; Chen and Chen 2009; Malmendier and Shanthikumar 2014), and affiliated stocks yield worse returns than unaffiliated stocks (Michaely and Womack 1999). Analysts’ underwriting incentives appear to be against the interest of investors.
Despite ample articles attribute analysts’ biased opinions to underwriting incentives, some papers find that overly optimistic opinions are not necessarily resulted from underwriting businesses. McNichols and O’Brian (1997) argue that it is because analysts are inclined to follow better-performers, causing the overall average ratings of stocks to become optimistic. Empirical results of Eames, Glover, and Kennedy (2002) do not support the notion that analysts intentionally bias their information, because the psychology theory of “motivated reasoning” (Kunda 1990) points out that people tend to defend their choice by putting consistently favorable messages. Since analysts believe in their selection of stocks, they will give optimistic earnings forecasts to promote their choices. Comparing earnings forecasts and recommendations of analysts who are hired by independent research firms, pure brokerage firms, and bulge brokerage firms who also underwrite offerings, Cowen, Groysberg, and Healy (2006) discover that analysts of bulge brokerage firms issue less optimistic forecasts and recommendations than analysts of pure brokerage firms. Similarly, Ljunqvist et al. (2006) fail to find association between optimism in recommendation and winning underwriting mandates. With mixed findings of the association between analysts’ research outputs and underwriting incentives, Bradley et al. (2008) turn to seek how investors view analysts’ relationship with corporate managers. Examining stock returns following IPOs, they find that the market responds more to recommendations issued by lead-underwriting analysts than those issued by co-underwriting analysts. Further investigation shows that investors perceive informational advantage outweigh the conflict of interests of the lead-underwriting analysts.
Peer-reviewed Academic Journal published by SSBFNET with respect to copyright holders.
P
ag
e
45
Since the literature is discrepant in usefulness of affiliated analysts’ reports, we need to look further into the difference in research outputs of affiliated and unaffiliated analysts. If the spread of analysts’ recommendations can be explained by key financial characteristics of companies, then it is not fair to say analysts hamper the informational environment of the market.
Development of Uplift Random Forest Model
Uplift modeling is one of the relatively new branches in predictive modeling of decision science. The objective is to find individuals or subgroups that are most likely to respond to a treatment. For example, in direct marketing campaign, uplift modeling is used to select the customers who are most likely to respond to direct mailing. Radcliff and Surry (1999) first propose a decision-tree approach. The basic idea is that we split branches according to customer characteristics, and we identify the most responsive qualities of customers by calculating the difference in responses of subgroups. Lo (2002) improves the accuracy of identifying the target customers by estimating the probabilities of responses in the first stage, and then he uses the difference in probabilities between subgroups to find the most responsive qualities. Due to strong computation capability of machines in recent years, various machine learning algorithms are developed for uplift modeling. Among machine learning algorithms, machine learning ensemble methods show the best prediction performance. A machine learning ensemble includes multiple models, and it predicts more accurately than each individual model does. Evaluating performances of different machine learning ensemble methods, Soltys, Jaroszewicz, and Rzepakowski (2015) concludes that bagging and random forest are most suitable techniques for classification model, and random forest algorithm predicts more accurately than bagging.
In the context of analysts’ recommendations, the literature does not tell us how company’s financial characteristics affect recommendations when the company was or was not underwriting client of the analyst’s brokerage firm. Since uplift random forest model is known for identifying the most responsive subgroup of the sample, I use it to find the financial characteristics that contribute to the most difference in recommendations between affiliated and unaffiliated companies.
Research and Methodology
Data and Sample
The sample recommendations are resulted from merging several databases. I download individual analysts’ recommendations issued between 1993 and 2014 from I/B/E/S. I begin with 1993 because I/B/E/S starts recommendation data in late 1992, and the number of observations in 1992 is small enough to be ignored. Because analysts issue recommendations for companies on average once a quarter, I retrieved quarterly company financials from COMPUSTAT Capital IQ. SDC Platinum provides equity and debt underwriting information. Following prior literature, previous underwriting relationship can affect future analysts’ research outputs as long as five years for IPOs (Ljngqvist et al. 2006; Malmendier and Shanthikumar 2014). Therefore, my underwriting data starts in 1988. Institutional holding in companies are downloaded from Thompson Reuters 13f Holdings database. In order to calculate abnormal returns of the covered stocks, I download daily stock prices from CRSP. To prepare for uplift random forest model, I keep only the companies that are covered by at least two brokerage firms. Among the recommendations received in a quarter, I require that at least one recommendation is issued by the affiliated brokerage firm. The final sample is 420 observations, spanning from 1995 to 2011. Table 1 exhibits year distribution of sample recommendations. 56.43% of recommendations are in 2008 to 2011. Because I/B/E/S does not provide names of brokerage firms, matching brokerage companies across databases lose significantly number of observations. I use names of analysts in recommendation dataset to find names of brokerage firms on Internet, and I merge recommendation dataset with underwriting dataset (SDC Platinum) by names of brokerage firms and CUSIP of covered companies.
Peer-reviewed Academic Journal published by SSBFNET with respect to copyright holders.
P
ag
e
46
Table 1: Year Distribution
Year Frequency Percent Cumulative Frequency Cumulative Percent
1995 3 0.71 3 0.71 1996 3 0.71 6 1.43 1997 11 2.62 17 4.05 1998 25 5.95 42 10.00 1999 8 1.90 50 11.90 2000 9 2.14 59 14.05 2001 34 8.10 93 22.14 2002 2 0.48 95 22.62 2003 27 6.43 122 29.05 2004 4 0.95 126 30.00 2005 15 3.57 141 33.57 2006 28 6.67 169 40.24 2007 14 3.33 183 43.57 2008 55 13.10 238 56.67 2009 79 18.81 317 75.48 2010 42 10.00 359 85.48 2011 61 14.52 420 100.00
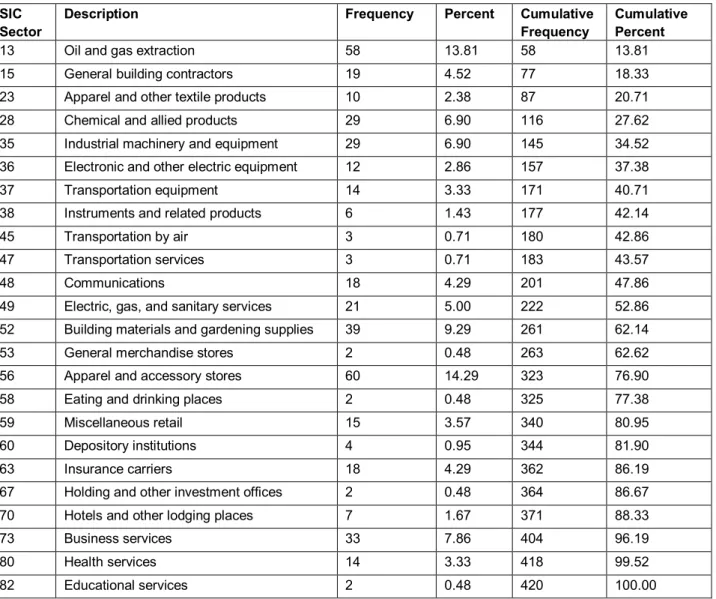
Table 2: Industry Distribution
SIC Sector
Description Frequency Percent Cumulative
Frequency
Cumulative Percent
13 Oil and gas extraction 58 13.81 58 13.81
15 General building contractors 19 4.52 77 18.33
23 Apparel and other textile products 10 2.38 87 20.71
28 Chemical and allied products 29 6.90 116 27.62
35 Industrial machinery and equipment 29 6.90 145 34.52
36 Electronic and other electric equipment 12 2.86 157 37.38
37 Transportation equipment 14 3.33 171 40.71
38 Instruments and related products 6 1.43 177 42.14
45 Transportation by air 3 0.71 180 42.86
47 Transportation services 3 0.71 183 43.57
48 Communications 18 4.29 201 47.86
49 Electric, gas, and sanitary services 21 5.00 222 52.86
52 Building materials and gardening supplies 39 9.29 261 62.14
53 General merchandise stores 2 0.48 263 62.62
56 Apparel and accessory stores 60 14.29 323 76.90
58 Eating and drinking places 2 0.48 325 77.38
59 Miscellaneous retail 15 3.57 340 80.95
60 Depository institutions 4 0.95 344 81.90
63 Insurance carriers 18 4.29 362 86.19
67 Holding and other investment offices 2 0.48 364 86.67
70 Hotels and other lodging places 7 1.67 371 88.33
73 Business services 33 7.86 404 96.19
80 Health services 14 3.33 418 99.52
Peer-reviewed Academic Journal published by SSBFNET with respect to copyright holders.
P
ag
e
47
Table 2 reports industry distribution of sample recommendations. Most of my sample recommendations are for companies in “Apparel and accessory stores” (14.29%) and “Oil and gas extraction” (13.81%), followed by “Building materials and gardening supplies” (9.29%) and “Business services” (7.86%). 13.8% of recommendations are for “Chemical and allied products” (6.9%) and “Industrial machinery and equipment” (6.9%). More than half of the recommendations in my sample cover companies of intensive capital, which are usually “large” corporation with small growth rate.
Variable Measurement
I choose the variables that are documented to be associated with recommendations in prior literature to explore whether difference in analysts’ recommendations between affiliated and unaffiliated companies are related to company’s financial characteristics. Because recommendations are the end-product of analysts’ valuation process (Bradshaw 2004), and past earnings help analysts predict future earnings and determine value of the stocks, my first group of financial characteristics is related to earnings. Since managers have incentives to avoid losses, and if analysts’ incentives are aligned with managers, then recommendations would be favorable and earnings forecasts would be meet/beatable (Brown 2001); on the other hand, if analysts are objective, analysts should view loss as a negative signal and issue a less favorable recommendation. I use company’s net income/loss of the latest quarter prior to analysts’ reports (LOSS) to observe the pattern of recommendations between affiliated and unaffiliated analysts. I also include earnings momentum (EM) and earnings volatility (EVOLATIL) because earnings momentum is documented to be negatively associated with recommendations (Stickel 2007), and volatile earnings in the past make earnings forecasts difficult (Gu and Wu 2003). In addition, ROE, ROA, and change of earnings (CHE) are popular measures for company’s performance (McNichols and O’Brien 1997), hence my first group of financial characteristics contains these variables as well.
The second group of financial characteristics is price-related measures of the stocks. Because returns of stocks affect analysts’ recommendations and forecast errors (Stickel 2007; Koch 2002), I use price momentum (PM) to detect analysts’ preference of stocks between affiliated and unaffiliated ones. Since the difference between book value and market value indicates growth opportunity of companies, analysts’ research outputs are affected by book-to-market or price-to-earnings measures. Prior literature documents that higher book-to-market ratio (Fama and French 1992; Lakonishok, Shleifer, and Vishny 1994) and lower forward-price-to-earnings ratio (Bradshaw 2000) are associated with favorable recommendations. As a result, I include book-to-market ratio (BM) and forward-price-to-earnings ratio (FWD_PE) in the list of financial qualities of the company.
Finally, I select size of the company, proxies for earnings management, proxies for company’s information environment, brokerage firm’s shares holdings in the company, and the indicator of years after new regulations for analysts as the third group of financial characteristics. Prior studies find that smaller companies earn higher returns (Dechow and Sloan 1997) and higher recommendations (Jegadeesh, Kim, Krische, and Lee 2004). I use total assets (ATQ) and natural log of market capitalization (LOGMV) of the quarter prior to analysts’ reports to represent sizes of companies. Because the market punishes companies for missing analysts’ forecasts, managers have incentives to manage earnings, and analysts who intend to keep good relationship with managers would lower earnings forecasts to managers’ meet/beatable levels and issue favorable recommendations (Abarbanell and Lehavy 2003; Louis, Sun, and Urcan 2013). I follow Louis et al. (2013) to use Modified Jones abnormal accruals (Abnormal_ACC) to examine the different recommendations between affiliated and unaffiliated companies. As discussed earlier, analysts compete for trading volume (Irvine 2007), if one’s recommendation is more favorable than the others’, his/her brokerage firm is more likely to win orders of trading a particular stock (Niehaus and Zhang 2010). Therefore, I use natural log of number of covering analysts last quarter (COVERAGE) to observe aggressiveness of analysts’ recommendations between affiliated and unaffiliated companies. If analysts’ brokerage firms hold shares of the companies they cover, they should have incentives to promote the stocks, because favorable recommendations generate more trade volumes than less favorable recommendations (Irvine 2004). Following the same rationale, Ljungqvist et al. (2006) find that brokerage firms’ holdings in companies are positively associated with recommendations issued by their analysts. Thus, I include an indicator variable (HOLD) to test whether analysts’ opinions in affiliated and nonaffiliated stocks would be different given their
Peer-reviewed Academic Journal published by SSBFNET with respect to copyright holders.
P
ag
e
48
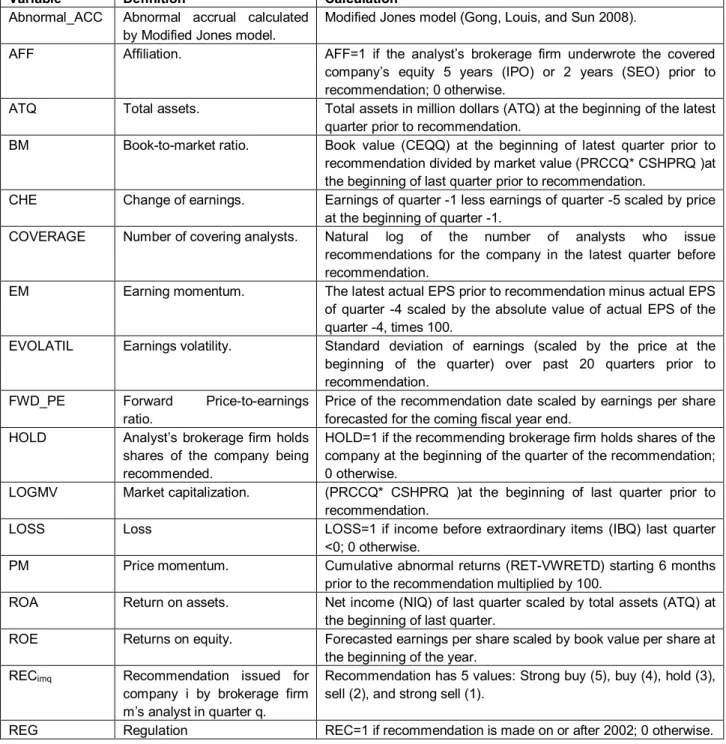
employers hold shares of the covered stocks. Lastly, after accounting scandals and financial crisis in early 2000’s, SEC and stock exchanges started regulatory reforms regarding management’s disclosure (Regulation Fair Disclosure) and analysts’ communications (NYSD Rule 2711 and NYSE Rule 472). These new regulations are aimed to curb analysts’ biased information resulted from investment banking incentives. As Regulation Fair Disclosure was in effect in 2000, and NYSD Rule 2711 and NYSE Rule 472 were formally accepted by SEC in July 2003, analysts’ reports issued in and after 2003 should be affected by all of these new rules. The literature generally finds that analysts issue fewer buy recommendations after regulatory reforms (Ertimur, Sunder, and Sunder 2007; Ke and Yu 2007), however, private access to management is still not completely shut (Koch, Lefanowicz, and Robinson 2013). As a result, I use an indicator variable (REG) to test whether regulatory reforms have an impact on difference in recommendations for affiliated and unaffiliated companies. Detailed calculation and variable names in the relevant databases are described in Table 3.
Table 3: Variable Definitions
Variable Definition Calculation
Abnormal_ACC Abnormal accrual calculated by Modified Jones model.
Modified Jones model (Gong, Louis, and Sun 2008).
AFF Affiliation. AFF=1 if the analyst’s brokerage firm underwrote the covered
company’s equity 5 years (IPO) or 2 years (SEO) prior to recommendation; 0 otherwise.
ATQ Total assets. Total assets in million dollars (ATQ) at the beginning of the latest
quarter prior to recommendation.
BM Book-to-market ratio. Book value (CEQQ) at the beginning of latest quarter prior to recommendation divided by market value (PRCCQ* CSHPRQ )at the beginning of last quarter prior to recommendation.
CHE Change of earnings. Earnings of quarter -1 less earnings of quarter -5 scaled by price at the beginning of quarter -1.
COVERAGE Number of covering analysts. Natural log of the number of analysts who issue recommendations for the company in the latest quarter before recommendation.
EM Earning momentum. The latest actual EPS prior to recommendation minus actual EPS
of quarter -4 scaled by the absolute value of actual EPS of the quarter -4, times 100.
EVOLATIL Earnings volatility. Standard deviation of earnings (scaled by the price at the beginning of the quarter) over past 20 quarters prior to recommendation.
FWD_PE Forward Price-to-earnings
ratio.
Price of the recommendation date scaled by earnings per share forecasted for the coming fiscal year end.
HOLD Analyst’s brokerage firm holds shares of the company being recommended.
HOLD=1 if the recommending brokerage firm holds shares of the company at the beginning of the quarter of the recommendation; 0 otherwise.
LOGMV Market capitalization. (PRCCQ* CSHPRQ )at the beginning of last quarter prior to recommendation.
LOSS Loss LOSS=1 if income before extraordinary items (IBQ) last quarter
<0; 0 otherwise.
PM Price momentum. Cumulative abnormal returns (RET-VWRETD) starting 6 months
prior to the recommendation multiplied by 100.
ROA Return on assets. Net income (NIQ) of last quarter scaled by total assets (ATQ) at
the beginning of last quarter.
ROE Returns on equity. Forecasted earnings per share scaled by book value per share at
the beginning of the year.
RECimq Recommendation issued for
company i by brokerage firm m’s analyst in quarter q.
Recommendation has 5 values: Strong buy (5), buy (4), hold (3), sell (2), and strong sell (1).
Peer-reviewed Academic Journal published by SSBFNET with respect to copyright holders.
P
ag
e
49
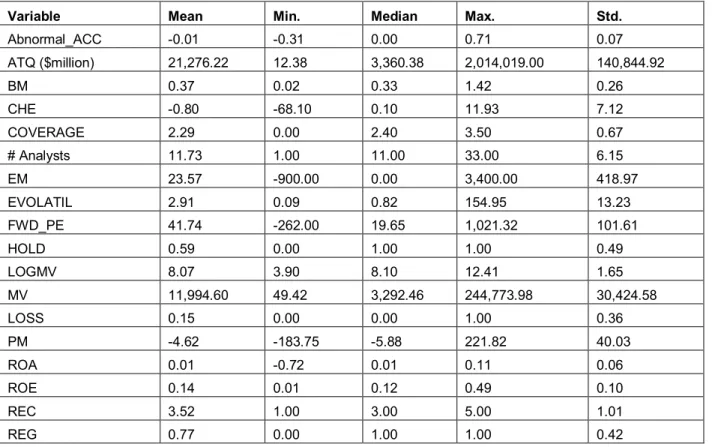
Table 4 reports descriptive statistics of variables. Recommendations (REC) on average are 3.25, higher than hold recommendation. The companies in my sample generally manage earnings downwardly as average abnormal accruals is -0.01. The size of sample companies varies widely as total assets (market capitalization) range from $12 ($49) million to $2,014 ($244,774) million, and average total assets (market capitalization) is $21,276 ($11,994) million. The proxy for growth opportunity (BM) is 0.37 on average, which indicates that my sample companies are generally undervalued. Average number of analysts who issue recommendations for the same company every quarter is 11.73, indicating the informational environment of these sample companies is good. The latest quarterly earnings is on average 23.57 percent of the earnings of the same quarter last year (EM) and -0.8 of the stock price (CHE), the movement of earnings exhibits moderately downward trend. The mean EVOLATIL is 2.91, which is about the same level as previous work (Louis et al. 2013). Current stock price is on average 41.74 percebt of expected earnings per share of the coming fiscal year (FWD_PE), analysts are optimistic about future earnings of their recommended companies. 59% of recommendations are issued by analysts whose brokerage firms hold shares of the recommended stock (HOLD). On about 15% of recommended stocks experienced loss in the last quarter (LOSS). Cumulative abnormal returns for six months prior to recommendation (PM) is on average -4.62 percentage. Profitability of recommended companies is on average 0.01 and 0.14 of total assets and stockholders’ equity respectively. 77% of my sample recommendations are issued in or after 2003 (REG).
Table 4: Descriptive Statistics
Variable Mean Min. Median Max. Std.
Abnormal_ACC -0.01 -0.31 0.00 0.71 0.07 ATQ ($million) 21,276.22 12.38 3,360.38 2,014,019.00 140,844.92 BM 0.37 0.02 0.33 1.42 0.26 CHE -0.80 -68.10 0.10 11.93 7.12 COVERAGE 2.29 0.00 2.40 3.50 0.67 # Analysts 11.73 1.00 11.00 33.00 6.15 EM 23.57 -900.00 0.00 3,400.00 418.97 EVOLATIL 2.91 0.09 0.82 154.95 13.23 FWD_PE 41.74 -262.00 19.65 1,021.32 101.61 HOLD 0.59 0.00 1.00 1.00 0.49 LOGMV 8.07 3.90 8.10 12.41 1.65 MV 11,994.60 49.42 3,292.46 244,773.98 30,424.58 LOSS 0.15 0.00 0.00 1.00 0.36 PM -4.62 -183.75 -5.88 221.82 40.03 ROA 0.01 -0.72 0.01 0.11 0.06 ROE 0.14 0.01 0.12 0.49 0.10 REC 3.52 1.00 3.00 5.00 1.01 REG 0.77 0.00 1.00 1.00 0.42
Uplift model
The purpose of uplift modeling is to use the difference between treatment group and control group to identify the qualities that cause the difference. The treatment group is exposed to certain action while control group is not. The action can be a marketing campaign such as direct mailing or a therapy in medicine. Unlike traditional models such as OLS that maximized overall data fit, the uplift model maximizes the difference in responses between treatment and control groups. The uplift model is defined as:
Peer-reviewed Academic Journal published by SSBFNET with respect to copyright holders. P ag e
50
∑ { ( = 1| ) − ( = 1| )}PT and PC are probability functions for treatment group and control group respectively. Y is a binary response with a value of either 1 or 0. Y can be continuous variable for certain selected model forms. X represents predictor variables x1, x2, x3…xk.
Random forest is one type of the ensemble methods to calculate probabilities of Y. It randomly selects a fraction of data and grows a tree (mi) using k variables (k <= n, n is number of observations). Repeat this
process to grow B trees and average all the individual trees to ensemble. Mathematically, this step can be described as:
( ) =1 ( )
To implement uplift random forest model, I first convert the response variable, recommendation (REC), into a binary variable. RECimq represents a recommendation issued for company i by brokerage firm m in the
quarter q. is the average recommendation across all brokerage firms for company i in quarter q. The binary response variable Yimq is defined as:
= 1 , > 0, ℎ
Second, I fit random forests uplift model using methods defined in Guelman (2014). Kullback-Leibler divergence (Csiszar and Shields 2004) was used for tree splitting criterion. The model allows users to select the number of randomly selected variables for each node and the number of trees. The user can check the performance of uplift model by changing these criteria. In the end, I build 100 trees in total. I specify 5 randomly selected variables to test difference in each node.
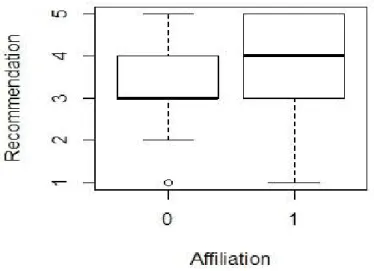
Figure 1 shows the difference in response variable, recommendation, between affiliated and unaffiliated analysts. Consistent with scholars who argue that analysts’ research outputs are biased by underwriting incentive (Michaely and Womack 1999; Richardson et al. 2006), the recommendations issued by affiliated analysts are higher (4) than those issued by unaffiliated analysts (3).
Peer-reviewed Academic Journal published by SSBFNET with respect to copyright holders.
P
ag
e
51
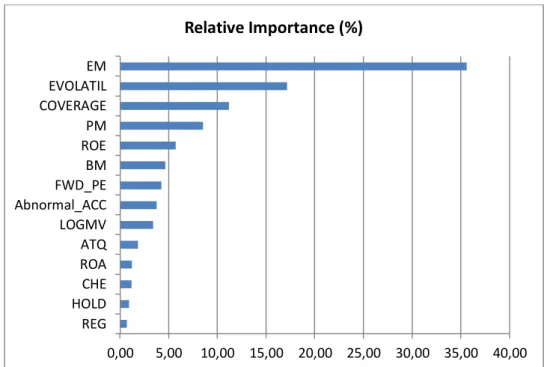
Figure 2 illustarates relative importance of variables in determining the difference in recommendations between affiliated and unaffiliated companies. The most important variable is earnings momentum (EM), which is about 36% of relative importance compared to all the other variables. The second important variable is earnings volatility (EVOLATIL), followed by natural logarithm of number of covering analysts for a company in a quarter (COVERAGE). After earnings and the informational environment of the company, analysts pay attention to price-related measures such as abnormal returns of the company in prior six months (PM), return on equity (ROE), book-to-market ratio (BM), and forward price-to-earning ratio (FWD_PE). Earnings management (Abnormal_ACC), size of the company (ATQ and LOGMV), ROA, and change of earnings (CHE) appear not as important as the other variables in determining the difference in recommendations. Unlike Ljungqvist et al. (2006) who find that holding shares of recommended companies affect the favorability of recommendations, the importance of HOLD is less than 1%. In contrast to many prior studies that document new regulations for analysts’ communication effectively press down optimism in recommendations (Koch et al. 2013), my sample shows that regulations (REG) have very little importance in analysts’ decision process.
Figure 2: Importance Score
Results and Discussion
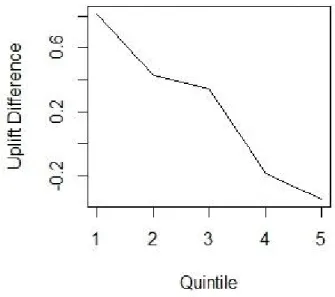
Figure 3 shows the performance of uplift random forest model. The vertical axis is the average difference of probabilities between the group of “Affiliated companies receiving higher than average recommendation” and the group of “Unaffiliated companies receiving higher than average recommendation”. The horizontal axis is the quintiles of the difference in probabilities, one as the most different quintile and five the least different quintile. The steeper the slope is, the more successful uplift model separates the treatment and control groups. Apparently, uplift random forest model distinguish two groups successfully. I continue to calculate average of financial characteristics for each of these quintiles to explore the company qualities that make the difference in recommendations.
0,00 5,00 10,00 15,00 20,00 25,00 30,00 35,00 40,00 REG HOLD CHE ROA ATQ LOGMV Abnormal_ACC FWD_PE BM ROE PM COVERAGE EVOLATIL EM
Relative Importance (%)
Peer-reviewed Academic Journal published by SSBFNET with respect to copyright holders.
P
ag
e
52
Figure 3: Performance of Uplift Modeling
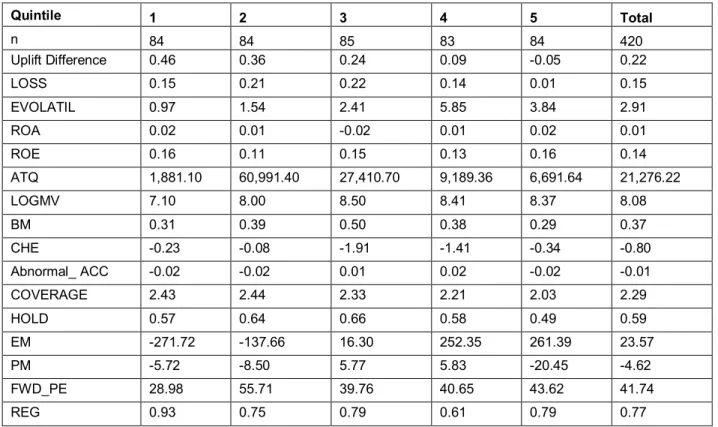
Table 5 reports means of financial characteristics in each of the quintiles uplift difference. The means of LOSS in the first two quintiles are larger than those of the last two quintiles. When the company exhibits loss in recent quarter, it is more likely to receive favorable recommendations from analysts if it is an affiliated company than if it is an unaffiliated company. This finding supports the notion that analysts’ research outputs are biased by underwriting incentives. The average of EVOLATIL increases as the difference in probabilities decreases. Analysts’ different recommendations for affiliated and unaffiliated companies highly depend on the volatility of past earnings of the companies. Comparing affiliated with unaffiliated companies, affiliated companies who have less volatile earnings are more likely to receive favorable recommendations than unaffiliated companies. ROA and ROE do not show a pattern with quintiles of difference in probabilities.
The smallest ATQ appears in the first quintile of the difference in probabilities, which indicates that a company with lower total assets are more likely to receive favorable recommendations from the analyst if the company is affiliated with the analyst than if the company is not affiliated with the analyst. When the size of the company is measured by market capitalization (LOGMV), I also find that smallest companies appear in the first quintile. These smaller companies are companies of higher growth opportunities, because BM is larger in the upper quintiles than in the lower quintiles. My finding of analysts’ preference in companies of smaller size and higher growth opportunity is consistent with prior literature documenting that analysts prefer “glamour” stocks to “value” stocks (Jagadeesh et al. 2004). Change of earnings from last quarter (CHE) generally becomes more negative as difference in probabilities goes smaller. Analysts tend to give better recommendations to companies who incur less loss from last quarter. Earnings management (Abnormal_ACC) does not explain the difference in probabilities. COVERAGE generally decreases with the difference in probabilities. It is not surprising that analysts are more likely to give favorable recommendations to a company when they can see how other analysts rank the company. Analysts whose brokerage firms hold shares of the reported company (HOLD) express more optimistic views about these companies. Consistent to Ljungqvist et al.’s (2006) finding, holding shares of the covered company indicates conflict of interest between analysts and investors. Companies whose earnings are worsened (EM) are more likely to receive favorable recommendations. Less negative abnormal returns during the past six months (PM) in general are associated with higher likelihood of receiving favorable recommendations. FWD_PE shows that smaller forecasted price-to-earnings ratios are more likely to receive favorable recommendations from analysts. The year indicator variable of REG shows higher means in upper quintiles than in lower quintiles. After year 2002 when new regulations about analysts’ communication are in effect, analysts are more likely to give favorable recommendations to affiliated
Peer-reviewed Academic Journal published by SSBFNET with respect to copyright holders.
P
ag
e
53
companies than unaffiliated companies. Regulatory reforms appear not to be a significant determinant in analysts’ valuation process.
Table 5:Financial Characteristics by Uplift Difference Quintiles
Quintile 1 2 3 4 5 Total n 84 84 85 83 84 420 Uplift Difference 0.46 0.36 0.24 0.09 -0.05 0.22 LOSS 0.15 0.21 0.22 0.14 0.01 0.15 EVOLATIL 0.97 1.54 2.41 5.85 3.84 2.91 ROA 0.02 0.01 -0.02 0.01 0.02 0.01 ROE 0.16 0.11 0.15 0.13 0.16 0.14 ATQ 1,881.10 60,991.40 27,410.70 9,189.36 6,691.64 21,276.22 LOGMV 7.10 8.00 8.50 8.41 8.37 8.08 BM 0.31 0.39 0.50 0.38 0.29 0.37 CHE -0.23 -0.08 -1.91 -1.41 -0.34 -0.80 Abnormal_ ACC -0.02 -0.02 0.01 0.02 -0.02 -0.01 COVERAGE 2.43 2.44 2.33 2.21 2.03 2.29 HOLD 0.57 0.64 0.66 0.58 0.49 0.59 EM -271.72 -137.66 16.30 252.35 261.39 23.57 PM -5.72 -8.50 5.77 5.83 -20.45 -4.62 FWD_PE 28.98 55.71 39.76 40.65 43.62 41.74 REG 0.93 0.75 0.79 0.61 0.79 0.77
Conclusion
I use uplift random forest model to find the financial qualities that explain the different recommendations between affiliated and unaffiliated companies. I show that analysts put more weight on volatility of earnings, book-to-market ratio, number of analysts who follow the same company, and forward PE ratio in determining recommendations for affiliated versus unaffiliated companies. On the other hand, size, earnings, and abnormal accruals of the company do not generate significant difference in recommendations between these two groups of companies. Analysts’ recommendations communicate important growth-related matrices to the market, even though underwriting business pressure is present. I introduce a new method to capital market research. Uplift random forest model can effectively identify the most responsive subjects in a sample and can be applied to research seeking causal relationship.
References
Abarbanell, J., & Lehavy, R. (2003). Biased forecasts or biased earnings? The role of reported earnings in explaining apparent bias and over/underreaction in analysts’ earnings forecasts. Journal of Accounting and Economics, 36(1), 105-146. http://dx.doi.org/10.1016/j.jacceco.2003.11.001 Bradley, D. J., Jordan, B. D., & Ritter, J. R. (2003). The quiet period goes out with a bang. The Journal of
Finance, 58(1), 1-36. DOI: 10.1111/1540-6261.00517
Bradshaw, M. T., & Sloan, R. G. (2000). The articulation of sell-side analysts' earnings forecasts, common stock valuations, and investment recommendations. University of Michigan..
Brown, L. D. (2001). A temporal analysis of earnings surprises: Profits versus losses. Journal of Accounting Research, 39(2), 221-241. DOI: 10.1111/1475-679X.00010
Peer-reviewed Academic Journal published by SSBFNET with respect to copyright holders.
P
ag
e
54
Chen, C. Y., & Chen, P. F. (2009). NASD Rule 2711 and changes in analysts' independence in making stock recommendations. The Accounting Review,84(4), 1041-1071. http://dx.doi.org/10.2308/accr.2009.84.4.1041
Cowen, A., Groysberg, B., & Healy, P. (2006). Which types of analyst firms are more optimistic?. Journal of Accounting and Economics, 41(1), 119-146. http://dx.doi.org/10.1016/j.jacceco.2005.09.001 Craig, S. and Weil, J. (2001). Despite losses, complex deals analysts remain high on Enron. The Wall
Street Journal. C1. http://www.wsj.com/articles/SB1004043182760447600 .Last visited on January 23rd, 2016.
Das, S., GUO, R. J., & Zhang, H. (2006). Analysts' selective coverage and subsequent performance of newly public firms. The Journal of Finance,61(3), 1159-1185. DOI: 10.1111/j.1540-6261.2006.00869.x.
Dechow, P. M., & Sloan, R. G. (1997). Returns to contrarian investment strategies: Tests of naive expectations hypotheses. Journal of Financial Economics, 43(1), 3-27. http://dx.doi.org/10.1016/S0304-405X(96)00887-2
Eames, M., Glover, S. M., & Kennedy, J. (2002). The Association between Trading Recommendations and Broker‐Analysts’ Earnings Forecasts.Journal of Accounting Research, 40(1), 85-104. DOI: 10.1111/1475-679X.00040
Ertimur, Y., Sunder, J., & Sunder, S. V. (2007). Measure for measure: The relation between forecast accuracy and recommendation profitability of analysts. Journal of Accounting Research, 45(3), 567-606. DOI: 10.1111/j.1475-679X.2007.00244.x
Ertimur, Y., Muslu, V., & Zhang, F. (2011). Why are recommendations optimistic? Evidence from analysts’ coverage initiations. Review of Accounting Studies, 16(4), 679-718. DOI: 10.1007/s11142-011-9163-6.
Fama, E. F., & French, K. R. (1992). The cross‐section of expected stock returns. the Journal of Finance, 47(2), 427-465. DOI: 10.1111/j.1540-6261.1992.tb04398.x
Feng, M., & McVay, S. (2010). Analysts' incentives to overweight management guidance when revising their short-term earnings forecasts.The Accounting Review, 85(5), 1617-1646. http://dx.doi.org/10.2308/accr.2010.85.5.1617
Francis, J., & Philbrick, D. (1993). Analysts' decisions as products of a multi-task environment. Journal of Accounting Research, 216-230. DOI: 10.2307/2491271
Gong, G., Louis, H., & Sun, A. X. (2008). Earnings Management and Firm Performance Following Open‐
Market Repurchases. The Journal of Finance,63(2), 947-986. DOI: 10.1111/j.1540-6261.2008.01336.x
Groysberg, B., Healy, P. M., & Maber, D. A. (2011). What Drives Sell‐Side Analyst Compensation at High‐
Status Investment Banks?. Journal of Accounting Research, 49(4), 969-1000.
Gu, Z., & Wu, J. S. (2003). Earnings skewness and analyst forecast bias.Journal of Accounting and Economics, 35(1), 5-29. http://dx.doi.org/10.1016/S0165-4101(02)00095-2
Guelman, L., Guillen, M., & Pérez-Marín, A. M. (2014). Optimal personalized treatment rules for marketing interventions: A review of methods, a new proposal, and an insurance case study (No. 2014-06). Irvine, P. J. (2000). Do analysts generate trade for their firms? Evidence from the Toronto stock
exchange. Journal of Accounting and Economics,30(2), 209-226. http://dx.doi.org/10.1016/S0165-4101(01)00005-2
Irvine, P. J. (2004). Analysts' forecasts and brokerage-firm trading. The Accounting Review, 79(1), 125-149. doi: http://dx.doi.org/10.2308/accr.2004.79.1.125
Peer-reviewed Academic Journal published by SSBFNET with respect to copyright holders.
P
ag
e
55
Irvine, P., Lipson, M., & Puckett, A. (2007). Tipping. Review of Financial Studies, 20(3), 741-768. doi: 10.1093/rfs/hhl027
Jackson, A. R. (2005). Trade generation, reputation, and sell‐side analysts.The Journal of Finance, 60(2), 673-717. DOI: 10.1111/j.1540-6261.2005.00743.x
Jegadeesh, N., Kim, J. Krische, S. and Lee, C. (2004). Analyzing the analysts: When do recommendations add value? Journal of Finance 59(3): 1083-1124.
Jegadeesh, N., Kim, J., Krische, S. D., & Lee, C. (2004). Analyzing the analysts: When do recommendations add value?. The journal of finance,59(3), 1083-1124. DOI: 10.1111/j.1540-6261.2004.00657.x
Koch, A. S. (2002). Financial distress and the credibility of management earnings forecasts.
Ke, B., & Yu, Y. (2007). The effect of ability, independence, and investor sentiment on analysts’ propensity to use their own earnings forecasts in stock recommendations. Working paper, Pennsylvania State University and University of Texas.
Kunda, Z. (1990). The case for motivated reasoning. Psychological bulletin,108(3), 480. http://dx.doi.org/10.1037/0033-2909.108.3.480
Lakonishok, J., Shleifer, A., & Vishny, R. W. (1994). Contrarian investment, extrapolation, and risk. The journal of finance, 49(5), 1541-1578. DOI: 10.1111/j.1540-6261.1994.tb04772.x
Lauricella, T. (2001). Analyst reports pressures of employer’s trading. The Wall Street Journal September 4. http://www.wsj.com/articles/SB99955856910000000. Last accessed January 27th, 2016. Lin, H. W., & McNichols, M. F. (1998). Underwriting relationships, analysts' earnings forecasts and
investment recommendations. Journal of Accounting and Economics, 25(1), 101-127. http://dx.doi.org/10.1016/S0165-4101(98)00016-0
Ljungqvist, A., Marston, F., & Wilhelm, W. J. (2006). Competing for securities underwriting mandates: Banking relationships and analyst recommendations. The Journal of Finance, 61(1), 301-340. DOI: 10.1111/j.1540-6261.2006.00837.x
Lo, V. S. (2002). The true lift model: a novel data mining approach to response modeling in database marketing. ACM SIGKDD Explorations Newsletter, 4(2), 78-86. Doi:10.1145/772862.772872 Louis, H., Sun, A. X. and Urcan, O. (2013). Do analysts sacrifice forecast accuracy for informativeness?
Management Science 59(7): 1688-1708.
Louis, H., Sun, A. X., & Urcan, O. (2013). Do analysts sacrifice forecast accuracy for
informativeness?. Management Science, 59(7), 1688-1708.
http://dx.doi.org/10.1287/mnsc.1120.1675
Malmendier, U., & Shanthikumar, D. (2014). Do security analysts speak in two tongues?. Review of Financial Studies, 27(5), 1287-1322. doi: 10.1093/rfs/hhu009
McNichols, M., & O'Brien, P. C. (1997). Self-selection and analyst coverage.Journal of Accounting Research, 35, 167-199. DOI: 10.2307/2491460
Michaely, R., & Womack, K. L. (1999). Conflict of interest and the credibility of underwriter analyst recommendations. Review of financial studies, 12(4), 653-686. doi: 10.1093/rfs/12.4.653
Niehaus, G., & Zhang, D. (2010). The impact of sell-side analyst research coverage on an affiliated broker’s market share of trading volume. Journal of Banking & Finance, 34(4), 776-787. http://dx.doi.org/10.1016/j.jbankfin.2009.09.007
Radcliffe, N. J., & Surry, P. D. (1999). Differential response analysis: Modeling true response by isolating the effect of a single action. Credit Scoring and Credit Control VI. Edinburgh, Scotland.
Peer-reviewed Academic Journal published by SSBFNET with respect to copyright holders.
P
ag
e
56
Radcliffe, N. J., & Surry, P. D. (1999). Differential response analysis: Modeling true response by isolating the effect of a single action. Credit Scoring and Credit Control VI. Edinburgh, Scotland.
Sołtys, M., Jaroszewicz, S., & Rzepakowski, P. (2015). Ensemble methods for uplift modeling. Data mining and knowledge discovery, 29(6), 1531-1559. DOI: 10.1007/s10618-014-0383-9.
Stickel, S. E. (1992). Reputation and performance among security analysts.The Journal of Finance, 47(5), 1811-1836. DOI: 10.1111/j.1540-6261.1992.tb04684.x
Stickel, S. E. (1995). The anatomy of the performance of buy and sell recommendations. Financial Analysts Journal, 51(5), 25-39.
Stickel, S. E. (2007). Analyst incentives and the financial characteristics of Wall Street darlings and dogs. The journal of investing, 16(3), 23-32. DOI: 10.3905/joi.2007.694759