econstor
www.econstor.eu
Der Open-Access-Publikationsserver der ZBW – Leibniz-Informationszentrum Wirtschaft
The Open Access Publication Server of the ZBW – Leibniz Information Centre for Economics
Nutzungsbedingungen:
Die ZBW räumt Ihnen als Nutzerin/Nutzer das unentgeltliche, räumlich unbeschränkte und zeitlich auf die Dauer des Schutzrechts beschränkte einfache Recht ein, das ausgewählte Werk im Rahmen der unter
→ http://www.econstor.eu/dspace/Nutzungsbedingungen nachzulesenden vollständigen Nutzungsbedingungen zu vervielfältigen, mit denen die Nutzerin/der Nutzer sich durch die erste Nutzung einverstanden erklärt.
Terms of use:
The ZBW grants you, the user, the non-exclusive right to use the selected work free of charge, territorially unrestricted and within the time limit of the term of the property rights according to the terms specified at
→ http://www.econstor.eu/dspace/Nutzungsbedingungen By the first use of the selected work the user agrees and declares to comply with these terms of use.
Müller, Hans Christian
Working Paper
Forecast Errors in Undisclosed Management Sales
Forecasts: The Disappearance of the Overoptimism
Bias
DICE discussion paper, No. 40 Provided in cooperation with: Heinrich-Heine-Universität Düsseldorf
Suggested citation: Müller, Hans Christian (2011) : Forecast Errors in Undisclosed Management Sales Forecasts: The Disappearance of the Overoptimism Bias, DICE discussion paper, No. 40, http://hdl.handle.net/10419/54195
No 40
Forecast Errors in
Undisclosed Management
Sales Forecasts:
The Disappearance of the
Overoptimism Bias
Hans Christian Müller
IMPRINT
DICE
DISCUSSION
PAPER
Published
by
Heinrich
‐
Heine
‐
Universität
Düsseldorf,
Department
of
Economics,
Düsseldorf
Institute
for
Competition
Economics
(DICE),
Universitätsstraße
1,
40225
Düsseldorf,
Germany
Editor:
Prof.
Dr.
Hans
‐
Theo
Normann
Düsseldorf
Institute
for
Competition
Economics
(DICE)
Phone:
+49(0)
211
‐
81
‐
15125,
e
‐
mail:
normann@dice.uni
‐
duesseldorf.de
DICE
DISCUSSION
PAPER
All
rights
reserved.
Düsseldorf,
Germany,
2011
ISSN
2190
‐
9938
(online)
–
ISBN
978
‐
3
‐
86304
‐
039
‐
0
The
working
papers
published
in
the
Series
constitute
work
in
progress
circulated
to
stimulate
discussion
and
critical
comments.
Views
expressed
represent
exclusively
the
authors’
own
opinions
and
do
not
necessarily
reflect
those
of
the
editor.
Forecast Errors in Undisclosed Management Sales Forecasts:
The Disappearance of the Overoptimism Bias
Hans Christian M¨uller ∗ December 12, 2011
Abstract
Previous empirical evidence which evaluated the accuracy of management earnings or sales forecasts consistently revealed these forecasts to be on average significantly overop-timistic. However, all studies analyzed forecasts from public disclosures, which are an important signal to investors and analysts and thus possibly biased by strategic con-siderations. To disentagle whether and to which extent strategic deception or cognitive biases are resposible for this overoptimism, the present study analyzes the accuracy of 6,234 undisclosed, company-internal sales forecasts, which German firms provided anony-mously to the IAB Establishment Panel. Quite surprisingly, the study reveals the average forecast to be significantly overpessimistic. I propose that the non-existence of a general bias towards overoptimism is due to the lack of incentives to consciously overgloss future prospects in undisclosed forecasts and that overpessimism may be a consequence of loss aversion.
Key Words: Management forecasts, Overoptimism, Overpessimism, Germany JEL-Classification: D22, L21, M41
∗
Researcher
Duesseldorf Institute for Competition Economics (DICE) Heinrich-Heine-University of Duesseldorf Universit¨atsstr. 1 D-40225 D¨usseldorf Email: mueller2@dice.uni-duesseldorf.de Phone: +49-(0)211-81-10240 Fax: +49-(0)211-81-15499
I am grateful to Hans-Theo Normann, Ralf Dewenter, Ulrich Heimeshoff and to audience members at Seminars at the German Economics Association (“Verein f¨ur Socialpolitik”) and the Duesseldorf Institute for Competition Economics (DICE) for helpful comments. The dataset used in this study is based on the IAB Establishment Panel (Waves: 1993-1997). Controlled remote data access was kindly provided by the Research Data Centre (FDZ) of the Institute for Employment Research (IAB).
1 Introduction
Being able to accurately forecast your firm’s future is a key to success and survival in hard-fought markets. If managers, for example, have to decide about their future production capacity, over- and underestimating future demand or costs is highly dangerous. In forecasting research, quadratic loss functions are commonly used to account for this danger, assuming that the damage of bad forecasts increases exponentially.
In recent years, however, empirical researchers in the fields of behavioural economics, industrial organization or accounting provided overwhelming evidence that managers’ as-sessments of their ventures’ future prospects are on average too optimistic. Mergers and acquisitions, for example, fail to achieve their intended goals in far more than every second case1; public infrastructure projects face cost overruns in almost nine of ten cases (Flyvbjerg et al., 2002); and also firms’ disclosed sales or earnings forecasts turned out to be too positive on average, whenever they were analysed.
This clear evidence raises the question about the main reasons for this overoptimism bias. Kahneman and Lovallo (2003a) argue that overoptimism on the one hand occurs due to un-conscious cognitive biases, sometimes called the “planning falacy”. If a firm is succesful, the managers may wrongfully trace this development back to their own skills and decisions in the past, rather than to luck or other factors that cannot be influenced by the firm itself. This “misatribution of cause” (Camerer and Malmendier, 2007) may lead to too much optimism about future outcomes, if the lucky streak ends and external conditions worsen. Furthermore, managers may underestimate the probability of expensive or time-consuming problems be-cause they oversee that, although each thinkable single risk may occur with a low probability, the chance that none of these dangers occurs at all is pretty low.
On the other hand, Kaheman and Lovallo (2003a) argue that overoptimism may further be amplified, if forecasters can benefit from announcing promising prospects. If, for example, a principal is known for explicitly disliking bad news, employees may consciously sugarcoat their estimates about the likely success of a project. Flyvbjerg et al. (2002) argue that, since many projects only get started, if its prospects are good enough, managers may often choose 1
the most overglossed project instead of the one with the objectively best prospects. Thus, if such organizational pressures are present, the forecasters have strong incentives to cheat against their own best knowledge, often reffered to as “strategic deception”. This behaviour may likely produce forecasts which later turn out to be too optimistic.
But there may not only be internal pressures, but first and foremost also external ones: Listed joint-stock companies may have incentives to publish too optimistic forecasts of their future sales or earnings, since these forecasts are an important, if not the most important, signal to analysts and investors (Pedwell et al., 2004). Using Japanese data, Ota (2010), for example, provides evidence how closely analysts follow managements’ forecasts when providing their own forecasts, so joint-stock companies may benefit from (mis-)leading the market to believe that its prospects are bright.
Hence, overoptimism may be caused by strategic deception as well as by unconscious cognitive biases. From the point of view of behavioural economics, the question arises, to what extent and - in which kind of situations - these approaches are responsible for the established overoptimism. Flyvbjerg (2003) critisized Kahneman and Lovallo (2003a) for underrating the likely influence of strategic deception in their seminal paper. Kahneman and Lovallo (2003b) retorted by emphazising that the cognitive bias in their eyes is the main reason why the majority of forecasts is biased upwards.
Finding the foundations of overoptimism surely is of great interest: If a firm unconsciously overestimates its future sales, and plans its capacity and workforce according to these fore-casts, it will have to pay the price for its wrong forecasts. If a firm, however, publishes overglossed forecasts in order to mislead the market, their investors have to bear the damage, disregarding possible negative reputation effects.
However, empirical evidence that tries to disentangle the influence of both causes is still scarce. To the best of my knowledge, only Rogers and Stocken (2005) contributed to this research field. They analyze earnings forecasts of almost one thousand US-companies between 1995 and 2000 and find that management forecasts are less biased, if managers are in danger of beeing sued for intentionally misleading the market or if the market’s ability to verify the forecasts is high (measured by the analysts’ agreement on a firm’s prospects). Thus, they
can reveal some evidence for intentional misrepresentation.
The present study tries to further fill the research gap with a new approach. I ana-lyze the biasedness and accuracy of managements’ sales forecasts from 2,511 German firms (timeframe: 1993-1997). But unlike all previous studies about management earnings or sales forecasts, I use company-internal forecasts (which were provided secretly to the anonymized IAB Establishment Panel) instead of publicly disclosed ones. Every year in June, a large sample of firms is asked to provide a forecast about their sales for the upcoming business year, so the forecast period starts 6 and ends 18 months later.
I chose to analyse sales instead of earnings forecasts because this key figure, compared to earnings, is more pure and less subject to possible misleadings through creative accounting or earnings management.2 Furthermore, I do not restrict my analysis to data from joint-stock companies (“Aktiengesellschaften”), as all previous studies did, and use data from firms with all different legal forms and sizes instead.
Since the forecasts were complied under secrecy and the dataset is strictly anonymized, the forecasters could not use their forecasts as a tool to influence the market and hence faced no (external) pressures to intentionally cheat. Thus, I aim to test the hypothesis that management forecasts, compared to previous evidence, reveal less overoptimism in situations where managers have no incentives (at least no external ones) to state different numbers than they truly believe. The second hypothesis assumes that joint-stock companies display more overoptimism compared to other legal forms like limiteds. This appears to be rather likely, since their managers may not be able to fully abstract from the pressure to report good news coming from the demanding financial markets.
My results add some interesting new aspects to the literature: Quite surprisingly, I do find the average firm’s sales forecast to be rather overpessimistic than overoptimistic (and am to my best knowledge the first to do so): The mean (median) forecast error is -5.58 (-.31) percent (measured as the difference of the forecasted and the actual sales numbers, devided by the forecasted value). While previous literature always reported a majority of too optimistic forecasts, I find a majority (50.90 percent) to be toopessimistic. Hence, I am 2
able to provide some support for Flyvbjerg’s (2003) hypothesis that overoptimism strongly depends on the forecaster’s incentives to cheat: In this case there are no external benefits from strategic deception and no overoptimism can be found on average.
But since the average forecast is found to be even overpessimistic, this explanation is not sufficient. I argue that firms may dislike bad surprises stronger than they like good surprises, so their overpessimism may be an expression of loss averting behaviour.
A subsample that is restricted to data from joint-stock companies reveals partly different results: Here, the mean forecast error is -1.57, hence overpessimistic as well, though less than within the whole sample. However, the majority of forecasts from joint-stock companies is overoptimistic, since the median forecast error is 1.96.
Using probit and logit estimation methods, further evidence can be provided that joint-stock companies appear to be more overoptimistic than other firms, while controlling for a broad range of micro- and macroeconomic values. Furthermore, hints for the existence of an “misatribution of cause”-bias could be found: Current success (measured by the sales growth-rate) is highly significantly related to the firms overoptimism, as suggested by a third hypothesis. OLS and between-effects panel regressions further provide some support for the fourth hypothesis that firms with a higher share of women among the workforce are less overoptimistic, which is in line with previous evidence about gender differences regarding overconfidence. No support can be provided for the hypothesis that younger firms display more overoptimism.
The remainder of this study is organized as follows: Section 2 introduces the concep-tual framework. Section 3 then sums up previous literature, while section 4 describes the IAB Establishment Panel. Section 5 derives five hypotheses, provides descriptive statistical analyses and sums up results from econometric regressions. Finally, section 6 concludes and recommends some steps for future research.
2 Conceptual Framework
Camerer and Malmendier (2007) define individual overoptimism as the overestimation of general prospects. The opposite case will be referred to as overpessimism throughout this
study. Hence, a forecast is considered as overoptimistic, if the (ex-ante) forecasted value exceeds the (ex-post) actual value, and as overpessimistic in the opposite case.
Statistically, overoptimism (respectively-pessimism) of company i in year t is measured on a percentage base as the difference between the forecasted value Fit of X (for example
sales, earnings or costs) and the actual value Ait, deflated by the forecasted value Fit, and
multiplied by 100 (McDonald, 1973; Imhoff, 1978; Pedwell et al., 1994). Thus, I define the percental forecast errorP F Eit(X) as:
P F Eit(X) =
Fit(X)−Ait(X)
|Fit(X)|
·100 (1)
Collective (or general) overoptimism bias is stated, if a sample’s average PFE significantly exceeds zero and if a majority of observations reveals a positive error. Hence, significantly positive mean and median PFE values indicate an overoptimism bias. This holds, if desirable values like sales, earnings or gains from a merger are forecasted. If costs are forecasted,
underestimations must be considered as overoptimistic.
The collective forecast quality, on the other hand, is measured by the standard deviation of the forecast errors throughout the sample. A higher variation thus represents greater uncertainty or worse forecast techniques.
3 Related Literature
Researchers from several disciplines published analyses about forecast accuracy, providing overwhelming evidence of structural overoptimism: In the field of planning management, Flyvbjerg et al. (2002) provide a seminal evaluation of the accuracy of cost forecasts for public infrastructure projects. Using international data of 258 projects from almost the last 100 years, they state considerable cost overruns for almost nine out of ten projects and an average forecast error of 28 percent.
In Industrial Organization, several studies aimed to evaluate whether mergers and acqui-sitions on average managed to achieve its initially forecasted financial goals. Straub (2007) provides an exhaustive overview about the relevant studies which on average report a failure
rate of almost two thirds (with no study stating a failure rate smaller than 40 percent). Similar overestimations could also be found for initial public offerings (IPOs): Firth and Smith (1992) reported 56 percent of 89 earnings forecasts published in IPO-broschures from New-Zealand to be too positive, while the rate is 76 percent for 112 Canadian IPO-forecasts in Pedwell et al. (1994). A general overoptimism bias was also found in 168 Australian IPO-broschures (covering dividend as well as earnings forecasts), as Brown et al. (2000) reveal.
To go public with your firm, to start infrastructure projects or to plan mergers are of course extraordinary, non-routine situations. But empirical evidence - the vast majority of it coming from the field of accounting - found considerable amounts of overoptimism also for everyday forecasts, namely for managers’ forecasts of their firms’ next-years’ earnings or sales. These forecasts are mostly published voluntary as a component of the firms’ annual reports, but are also mandatory in some countries (Japan or New Zealand, for example). To my best knowledge, all studies about forecast accuracy analyzed such kind of published disclosures of joint-stock companies and found a general overoptimism bias, although differing broadly in scale, covered countries and time-periods.
McDonald (1973), analyzing 201 American one-year-ahead earnings forecasts from the late 1960s, found 64 percent of them to be overoptimistic. Imhoff (1978) repeated McDonald’s study with data from four further years and found similar results. Cho et al. (2011), analyzing the accuracy of management earnings forecasts of almost 2,700 Japanese firms between 1988 and 2005, find 53 percent to be too optimistic.
Kato, Skinner and Kunimura (2009) were the only ones who also analyzed sales instead of earnings forecasts and found only 39 percent of about 30,000 examined forecasts from Japanese firms between 1997 and 2007 to be too pessimistic. Since Japanese companies do not only publish one-year-ahead forecasts, but update them several times throughout the year, the authors can show that managers tend to adjust their initial forecasts towards less overoptimistic predictions over time. Thus, the established amount of overoptimism in six-month-ahead-projections is much smaller than in the case of one-year-ahead-forecasts.
frag-mental - especially with respect to the question to which extent cognitive biases or strategic deception are to blame in the first instance. Flyvbjerg et al. (2002) conclude that the huge average cost overruns found for infrastructure projects are most likely due to strategic lying by policymakers, rather than to cognitive reasons. They argue that otherwise, cost overruns should decrease over time, since planners have a growing archive of similar projects to learn from. However, this point is disapproved by Kahneman and Lovallo (2003b): They argue that the lack of learning is a component of the cognitive bias and cite evidence about startups’ failure rates which cannot be traced back to strategic deception and which did not decrease over time.
Rogers and Stocken (2005) are able to find that managers’ overoptimism depends to some extent on the risk that cheating will be detected, and its costs. Overoptimism within US-firms’ earnings forecasts between 1995 and 2000 is greater, if they run less risk to be convicted (measured by the consistency of analysts’ forecasts of the same value) or punished for consciously overestimating their firms’ prospects. The latter is operationalized by an index measuring to what extent the firm is active in a high- or low-litigation industry.
Cho et al. (2011) show that a large fraction of the established overoptimism within their sample of Japanese firms can be traced back to the fact that firms avoid to forecast losses: Only less than 20 percent of those firms who later had to reveal a loss in their balance sheets had also forecasted negative earnings in the year before. The authors suggest that the Japanese bank-oriented firm system might be one reason for this: Japanese managers reporting losses are in danger of being replaced due to pressure of their house bank, so they have strong incentives not to forecast losses, at least to prolong their tenure.
In order to provide additional evidence about the likely foundations of overoptimism biases, the present study is based on the methods of accounting research about management forecast accuracy, but analyzes undisclosed instead of published forecasts. I hypothesize that such forecasts are on average less overoptimistic than published forecasts due to lacking external pressures and incentives to cheat. I a second step, regression methods will be used to assess which firm characteristics enhance managers’ optimism.
4 Data
The dataset used in this study is a subsample of the IAB Establishment Panel, a large anonymized German firm panel. Data access is restricted to researchers and not open for commercial market researchers. Between 1993 and 1997, the IAB asked the firms to provide a secret forecast of their sales numbers for the upcoming fiscal year. The IAB always sends its questionnaires in June, so the forecasted period starts 6 and ends 18 months afterwards (Fischer et al., 2009). Although the data does not reveal who actually filled in the question-naire, surveys for similar datasets showed that in the large majority of firms a member of the upper management takes over this task.3
For my analysis, I use all available sales forecasts, except for some outliers which were excluded as explained below. The sample thus contains 6,234 verifiable forecasts of 2,511 different firms. For each year between 1993 and 1997, between 827 and 1,936 firm-year observations are available.
The firms differ widely - in terms of workforce numbers, legal form, sector, sales numbers et cetera, since the IAB aims to provide a representative subpopupulation of German companies. As shown in Table 1, the average firm within the panel had 614.82 (median firm: 129) employees, of whom 41.94 (39.46) percent were women; it newly hired 5.34 (1.69) and fired 5.76 (2.70) percent of its total workforce every year, paid an average yearly wage of 24,105 (23,685) Euros4 and registered sales of 774.87 million (28.44 million) Euros. The firms’ inflation-adjusted sales grew by 6.94 (.65) percent every year. 26.85 percent of the firms export part of its products or services and 58.08 percent have a workers council. The firms’ investments amount to 9.22 (2.78) percent (compared to sales numbers). Table 2 presents data about the frequency of legal forms, sectors and origins expressed by the German state (Bundesland) in which the firms’ headquarters are located.
Since the IAB only allows remote data access, outliers or improperly filled in data arrays could not be manually detected. Thus, correction rules which are able to exclude useless 3See for example Abberger et al. (2009) for a survey among the firms within the Ifo-institute’s Business Climate
panel.
4Please note: All pecuniary values within this study are given inflation-adjusted and display prices of the year
2000. They are further translated into Euro using the official exchange rate: 1.95583 Deutsche Mark = 1 Euro.
data had to be applied. I chose to conduct the following corrections of the data: I dropped observations, when a firm’s workforce or sales exploded or collapsed by more than ten times in one year’s time in order to account for outliers and firms which did not complete the survey properly. Furthermore, I excluded observations, if the firm over- or underestimated its next year’s sales by more than ten time. I did so because I assume that such escalations or misestimations are rather due to sudden existential changes (like insolvencies, mergers or acquisitions) than to actual forecast errors. Firms were completely left out in the anal-ysis, when they gave exactly the same answers, either for their sales or for their workforce numbers5, three or more consecutive times, since I assume this to be a clear sign that the
managers of these firms did not put enough effort into these questionnaires.6
5 Hypotheses and Empirical Analysis
Since I analyze secret company-internal instead of published management sales forecasts, firms cannot benefit from overglossed forecasts and hence have no incentives to cheat in order to influence analysts or investors. To test the suggestion that such pressures are the crucial foundation of the overoptimism established in previous literature, I set up the following hypothesis:
• H1: The mean and median forecast errors in this sample depict less
overop-timism than it was found in previous literature.
Kahneman and Lovallo (2003a) as well as Flyvbjerg et al. (2002) state that the amount of internal and external organizational pressures to produce and report good news are an important source of overoptimism (although they differ in their assessment of its relative importance). Rogers and Stocken (2002) further provide evidence that overoptimism does not occur randomly, but varies with the companies’ incentives to gloss over their estimations. 5The latter correction was only conducted for firms with more than 1,000 employees, as it is not unlikely that
small firms have constant workforce numbers over time.
6
To check for robustness, all analyses within this paper were repeated with an otherwise corrected sample: Therefore, observations were only excluded, when the firm’s sales and workforce numbers changed by more than a hundredfold or when the forecast misestimated future sales by more than this. The results do not differ qualitatively, so they are not reported here, but can be provided upon request.
Turning the focus on the firms’ legal forms, I suggest that joint-stock companies face more (at least external) pressure than for example self-employers. Accordingly, the fate of joint-stock companies depends much stronger on public judgments of its soundness, which are based on reports of realized past and predicted future financial results. Furthermore, its decision makers have to satisfy a greater number of owners (their shareholders) who are commonly more interested in short-term success than for example self-employers or large-scale investors. Although the forecasts whose accuracy are analyzed in this paper were complied under secrecy, it seems unreasonable to expect that forecaster are fully able to abstract from these organizational pressures while reporting its predictions to the IAB. Hence, I set up the following hypothesis:
• H2: Management sales forecasts of joint-stock companies reveal more
overop-timism than those of firms with other legal forms.
To check the data for significant forecast biases, I focus on the distribution of the forecast errors. A median and mean value of zero would indicate that no significant statistical pattern existed, since it could not be rejected that all individual misforecastings were due to a random process.
Table 3 contains summary statistics of the firms’ forecast errors (PFEs). The results clearly reveal that the average forecast is rather overpessimistic than overoptimistic. The mean forecast is 5.58 percent below the true value and is highly significantly different from this, as a t-test reveals (the p-value is smaller than 0.001). The median error for the whole sample is more close to zero than the mean value, but slighty negative (-.31) as well, showing that also a majority of sales forecasts is overpessimistic.
The results further reveal that the yearly mean values for PFEs are always negative, too, though differing in scale. They range from -8.79 in 1997 to -.74 in 1995 and are always highly significantly smaller than zero (except for 1995). The yearly PFEs do not appear to follow a time trend, so there is no sign of common learning. However, the data covers only five years and is thus of limited value for such analyses.
Since some individual firms occur in the sample up to five times, while others provided a forecast only once, I also report the distribution of the firms’ mean forecast errors in Table
3. The results are qualitatively similar to those above which shows that the overpessimism bias is not due to differently weighted firms within the distribution.
These results clearly contradict previous evidence and allow support for hypthesis H1. The fact that the mean and median firm is overpessimistic is quite interesting considering that the phenomenon overpessimism has not gained much attention in economics thus far.
Table 3 further displays descriptive statistics for a subsample that is restricted to joint-stock companies. The mean PFE value is -1.57, which also depicts an average, though smaller, bias towards overpessimism (though not statistically significant). However, the median fore-cast error for this subsample is 1.96, which shows that a majority of forefore-casts from these firms was overoptimistic. Both values allow some support for hypothesis H2 which will be further tested with different regression methods below.
Descriptive results also reveal that about 45 percent of the forecasts (in the whole sample) assumed declining sales numbers. Hence, managers are not trying to avoid to forecast negative values like it was found in Cho et al. (2011) for Japanese firms. I suggest that this is also due to the fact that the forecasts are kept secret by the IAB. However, it must be admitted that Cho et al. analyzed earnings instead of sales forecasts, so the results are not perfectly comparable, since losses are commonly assumed to be more painful for firms than declining sales numbers.
The overall quality of forecasts within the sample is rather low: The 25-percent quartile of the PFE-distribution amounts to -11.61, while the 75-percent quartile is 9.70, indicating that about 50 percent of the forecasts miss the mark by more than ten percent. The distribution’s standard deviation (42.23) is also quite high, whereas broadly in line with previous literature about earnings forecast errors (McDonald, 1973; Imhoff, 1978; Pedwell et al. 1994).
To further assess forecast quality, I compute the absolute percental forecast errors (APFE). APFE quantifies the forecast errors, disregarding the sign of the error, and is defined as:
The mean value of APFE amounts to 20.50 percent, as Table 3 shows. Since the firms’ sales numbers on average change by 21.90 percent from year to year, the mean absolute forecast error is only slightly smaller. Thus, it can be stated that the managers are only able to correctly forecast a very small fraction of their firms’ development.
Using econometric regression methods, this section further aims to assess which firm characteristics drive overoptimism or -pessimism in general. Therefore, three additional hy-potheses are set up in the following.
Camerer and Malmendier (2007) suggest that “misatribution of cause” may be one source which makes forecasters overly optimistic. Managers whose firms are currently succesful may wrongfully overestimate the proportion of this success which is based on their own skills and decisions - and underestimate the influence of luck and external factors like the general situation of their sectors. Hence they may underrate the posibility that the situation worsens due to external factors which they can hardly influence. So I expect:
• H3: Overoptimism is positively related to current success (measured as a
firm’s percental sales growth).
Previous literature reports extremely high failure rates for business startups (Camerer and Lovallo, 1999) and that entrepreneurs seem to be especially optimistic in character (Arab-sheibani et al., 2000). Hence, I assume that overoptimism might be a bias that occurs especially frequent among younger firms. I thus expect:
• H4: Younger firms reveal higher amounts of overoptimism.
Previous behavioural research showed that women question their own skills more often than men and thus reveal less overconfidence, for example regarding their stock trading activity (Barber and Odean, 2001), and less overoptimism, for example with respect to their expectations of their future financial situation (Arabsheibani et al., 2000). Although the IAB Establishment Panel does not contain details about the forecasters’ gender, data about the fraction of women among the workforce are available and reveal strong variations of this value. Thus, the fraction of female employees is used as a proxy for gender differences among the firms. I expect:
• H5: Firms with a higher percental fraction of women among the workforce are less prone to overoptimism.
The estimation strategy will be as follows: First, I use probit and logit models with clustered standard errors which estimate the probability that a forecast is too optimistic, all other things equal. Thus, the dependent variable is dichotomic and will be equal to 1, if the PFE is larger than zero, and 0, if the PFE is negative.7 A positive coefficient hence denotes a positive influence of a variable on the probability that a firm issues an overoptimistic forecast, while a negative one indicates the opposite.
The logit and probit estimations are then compared to a standard (robustly estimated, also with clustered standard errors) pooled OLS regression which uses PFE values as dependent variable. Since some firms occur in the dataset more often than others, a between-effects panel regression is conducted afterwards as a robustness check: Here, the individual firms’ mean values are used to account for the possibility that the firms’ different weights within the sample distort the results. Regarding these two models, the coefficients depict the estimated in- or decrease of the forecast errors in percentage points which follow an increase of the respective independent variable. A positive (negative) coefficient would hence show that a forecast error is estimated to be more (less) overoptimistic, while no statement can be made whether it is actually overoptimistic or -pessimistic.
The independent variables used in these specification are defined and summed up in Table 1 as well. Regarding the hypotheses above, they include the firms inflation-adjusted percental sales growth rate (Sales Growthit), the firms’ legal forms (F orm, given as five
different categories8) and a categorial variable of age (Ageit)9.
7Here, 14 true forecasts (with a PFE of exactly zero) are left out. As robustness checks, the regressions were
repeated with samples where true forecasts were either included in the overoptimism or -pessimism category. However, they are not reported here, since the results are qualitatively equal, but can be provided upon request.
8
Joint-stock company, partnership, state-owned, limited (used as base level throughout the regressions) and others.
9
Due to a lack of more precise information, only categorial data exists: Ageit equals 1, if the firm was founded
before 1960; equals 2, if the founding date was after 1959 and before 1990; and equals 3, if the venture was launched after 1989. Throughout the regressions, dummy-variables are used for the two latter categories, while the first category is the base level.
Further, control variables regarding the firms size are used (the number of employees, W orkf orceit, as well as the inflation-adjusted10 sales numbers, Salesit), as well as dummy
varibales for the German state where the firm’s headquarter is located, for the firm’s sector and for the year of the observation. To control for macroeconomic influences, the real growth rate of the firm’s industry11is included, too.
As a robustness check, the regressions are repeated using an additional range of control variables: The percental fraction of women among the workforce (W omenit), the persistence
of the workforce (measured by the percentage of the workforce that has been newly hired, Hiredit, or fired,F iredit, during the respective year, as well as the percentage of current
va-cancies,V acantit), the firm’s investment ratio (Investit, measured as the sum of investments
devided by the sales numbers), its wage costs (W agecostit, also as a fraction of sales) and
its inflation-adjusted average wage (AvW ageit). Furthermore, additional dummy variables
are included: Export, which equals 1, if the firm exports parts of its products, andCouncil, which is 1, if the firm allows its employees to let their interests be represented by a workers council.
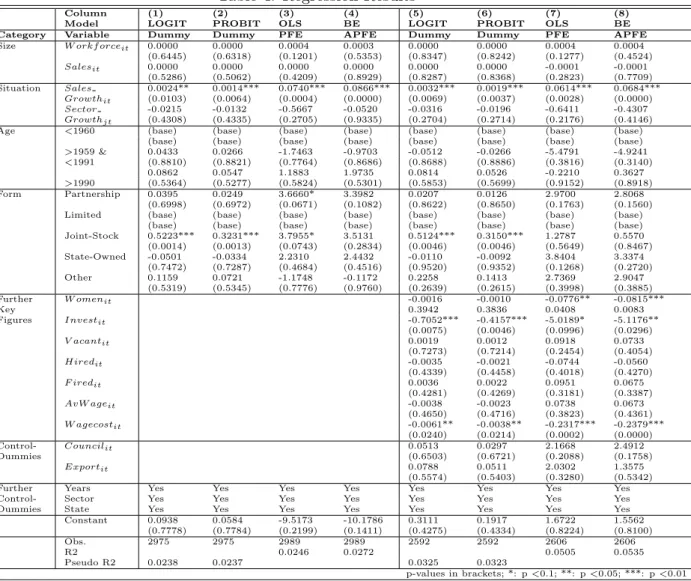
Table 4 depicts the regression results. Column (1) and (5) show the probit regression re-sults and columns (2) and (6) the logit regression. Both models allow support for hypothesis H2 (highly significant at the one percent level). Compared to limiteds, the probability of issu-ing an overoptimistic forecast is much higher for joint-stock companies, while the probabilities of firms with other legal forms do not differ significantly from that of limiteds. Furthermore, also hypothesis H3 cannot be rejected: The greater a firm’s current growth rate, the higher is the estimated probability for an overoptimistic forecast (significant at least at the five percent level). However, no support can be stated for hypothesis H4 about the influence of the firms’ age.
Columns (5) and (6) show significantly negative influences on the probability of issuing an overoptimistic forecast for the investment ratio (one percent level) and the wage-sales ratio (five percent level). Hence, firms which are active in people-intensive businesses or which make relatively high investments seem to be more cautios when predicting their own future. 10
Given in prices of the year 2000.
11
Due to changes of the sector-classification, the firms can only be separated into eleven sectors. The growth rates are collected from the German central bank (Bundesbank) and the German Federal Bureau of Statistics.
The logit and probit analyses further provide no support for hypothesis H5, while the the OLS and between-effects models in columns (7) and (8) do. Here, the fraction of women among the workforce has a clearly significant negative influence on the forecast error (at least at the five percent level), as suggested by hypothesis H5. All other things equal, the forecast error is estimated to be about 2.25 percentage points lower, if the fraction of women grows by the value of one standard deviation.
Regarding hypothesis H3, the OLS- and between-effects-models (3), (4), (7) and (8) fur-ther confirm the support of the probit and logit regressions. All ofur-ther things equal, firms whose growth rate is larger by one standard deviation provide forecasts which are about three percentage points more optimistic. Furthermore, the investment ratio has an, at least weakly significant, influence also in the OLS and between-effects models (columns 7 and 8). The significantly negative impact of the wage ratio on a firm’s forecast error can be confirmed as well (one percent level).
Referring to the firms’ legal forms, the results of the OLS and between-effects models reveal only mixed evidence. While model (3) reports weakly significantly higher amounts of overoptimism for joint-stock companies and partnerships (compared to limiteds), models (5), (7) and (8) do not find any significant differences. However, this might be due to joint-stock companies’ better forecast quality, since their errors show much less less variation (as can be seen in the second line of table 3).
To sum up: The regression results provide clear and robust support for hypothesis H3: Currently successful firms appear to be more vulnerable for issueing too optimistic forecast about their future sales numbers. However, hypothesis H4 had to be clearly rejected, as no significant influence was found for the age of the firms.
At least partly support was found for hypotheses H2 and H5: While the probability of issueing an overoptimistic forecast is estimated to be significantly higher for joint-stock companies in the probit and logit models and in the OLS-model (3), this results do not hold for the other OLS model and the between-effects regressions.
For hypothesis H5, the opposite situation occurs: Models (7) and (8) provide evidence that the forecast error declines significantly with the fraction of women among the workforce, while
no significant influence could be found in the logit (5) and probit (6) models. Furthermore, all models reveal a robustly significant negative influence for the wage ratio and the investment ratio.
6 Discussion
This study is, to my best knowledge, the first one about management forecast errors that states a significant statistical pattern towards overpessimism. My first suggestion is that the non-existence of a general overoptimism bias in this sample is due to the lack of external pressure to report good news: Unlike forecasts issued in public disclosures, the forecasts analyzed here cannot be used as strategic signals to investors and analysts. Hence, firms have no benefit from intentionally overglossing their stated prospects. This allows some support for Flyvbjerg’s (2003) hypothesis that strategic deception is one, if not the main, cause of overoptimism. If, however, cognitive biases were the main reasons for overoptimism, it could be expected that the forecasts analyzed here were too optimistic on average, too, since it would not matter for which purpose they were made.
However, the reasoning above is not able to sufficiently explain why the results actually show a tendency towards overpessimism, as it can only explain why the mean PFE is less pos-itive, but not why it is actually negative. Thus, my second suggestion is that overpessimism may be a sign of loss aversion. I argue that decision makers may dislike negative surprises more than they like positive ones and thus hedge against rude surprises by being especially cautious, when estimating their firms’ future prospects.
Yet, further research is indicated to solidify the findings and conlusions of this study. It would be most preferable to directly compare undisclosed and disclosed forecasts of the same firms, but this appears to be impossible due to a likely lack of data.12 However, the analysis could be repeated on the one hand with company-internal forecasts from other countries and on the other hand with public disclosures of German firms. This approach would come closer to a ceteris-paribus analysis.
12
Firm panels are typically highly anonymized for data protection reasons, so matching panel datasets with data from public disclosures appears to be impossible.
Using different regression methods, this study could further provide some support for dif-ferent hypotheses related to behavioural research. It could be shown that currently successful firms display a tendency towards overoptimism, which I argue might be due to the cognitive bias “misattribution of cause”. If management skills and decisions are hold accountable for current success too much, firms may underrate the influence of randomly occuring external factors and thus the possibily of a worsening situation.
At least some support could further be found for the hypotheses that women are more pessimistic when forecasting the future, which can be seen as in line with previous behavioural evidence, and that joint-stock companies are more prone to be overoptimistic than firms with other legal forms. I suggest that managers of joint-stock companies face stronger pressures to deliver positive numbers, since their shareholders first and foremost demand persistent returns and dividends. Thus, these forecasters may not be able to fully abstract from these omnipresent pressures, when forecasting their firms’ future.
References
Abberger, K., Birnbrich, M., Seiler, C., 2009. Der “Test des Tests” im Handel eine Metaum-frage zum Ifo Konjunkturtest. Ifo Schnelldienst, 62 (21), 34-41.
Arabsheibani, G., de Meza, D., Maloney, J., Peasron, B., 2000. And a vision appeared unto them of a great profit: evidence of self-deception among the self-employed. Economic Letters, 67 (2000), 35 41.
Barber, B.M., Odean, T., 2001. Boys Will be Boys: Gender, Overconfidence, and Common Stock Investment. The Quarterly Journal of Economics, 116(1), 261-292.
Brown, P., Clarke, A., How, J.C.Y., Lim, K., 2000. The Accuracy of Management Dividend Forecasts in Australia. Pacific-Basin Finance Journal, 8, 309-331.
Camerer, C., Lovallo, D., 1999. Overconfidence and Excess Entry: An Experimental Ap-proach. American Economic Review, 89, 306-318.
Camerer, C., Malmendier, U., 2007. Behavioral Economics of Organizations. In: Diamond, P., Vartiainen, H. (Eds.), 2007. Behavioral Economics and Its Applications, Princeton Uni-versity Press, Chapter 7, 235-290.
Cho, M., Hah, Y.D., Kim, O., 2011. Optimistic Bias in Management Forecasts by Japanese Firms to Avoid Forecasting Losses. The International Journal of Accounting, 46 (1), 79-101. Firth, M., Smith, A., 1992. The Accuracy of Profits Forecasts in Initial Public Offering Prospectuses. Accounting and Business Research, 22(87), 239-247.
Fischer, G., Janik, F., M¨uller, D., Schmucker, A., 2009. The IAB Establishment Panel Things Users Should Know. Schmollers Jahrbuch, 129, 133-148.
Flyvbjerg, B., Holm, M.S., Buhl, S., 2002. Underestimating Costs in Public Works Projects - Error or Lie? Journal of the American Planning Association, 68(3), 279-295.
Imhoff, E.A.Jr., 1978. The Representativeness of Management Earnings Forecasts. The Accounting Review, 53(4), 836-850.
Kahneman, D., Lovallo, D., 2003a. Delusions of success: How optimism undermines execu-tives’ decisions. Harvard Business Review, 81(7), 56-63.
Kahneman, D., Lovallo, D., 2003b. Delusions of success. Harvard Business Review, 81(12), 122.
Kasznik, R., 1999, On the Association between Voluntary Disclosure and Earnings Manage-ment. Journal of Accounting Research, 37(1), 57-81.
Kato, K., Skinner, D.J., Michio, K., 2009. Management Forecasts in Japan: An Empirical Study of Forecasts that are Effectively Mandated. Accounting Review, 84(5), 1575-1607. Matsumoto, D.A., 2002. Management’s Incentives to Avoid Negative Earnings Surprises. The Accounting Review, 77(3), 483-514.
McDonald, C.L., 1973. An Empirical Examination of the Reliability of Published Predictions of Future Earnings. The Accounting Review, 48 (3), 502-510.
Ota, K., 2010. The Value Relevance of Management Forecasts and Their Impact on Analysts’ Forecasts: Empirical Evidence From Japan. Abacus, 46(1), 28 - 59.
Pedwell, K., Warsame, W., Neu, D., 1994. The Accuracy of Canadian and New Zealand Earnings Forecasts: A Comparison of Voluntary Versus Compulsory Disclosures. Journal of International Accounting, Auditing & Taxation, 3(2), 221-236.
Rogers, J.L., Stocken, P.C., 2005. Credibility of Management Forecasts. The Accounting Review, 80(4), 1233-1260.
Straub, T., 2007. Reasons for Frequent Failure in Mergers and Acquisitions: A Comprehen-sive Analysis. Gabler Edition Wissenschaft - Business and Economics.
T able 1: Summary Statistics I Category V ariable Description Unit Mean Median StD Obs. Mean (JSC) Obs. Size Sales T otal sales (prices of 1995 ) Mio. Euro 774.8745 28.4381 5066.7089 2048 1216.8643 142 W orkforce Num b er of emplo y ee s # 614.8232 129 1788.4166 6 234 1769.8078 281 Situation Sales Gro wth Infl.-adj. gro wth rate of sales % 6.9449 0.6543 47.4394 5889 1.4945 252 Key V acan t V acan t p ositions (in % of w orkforce) % 1.5825 0 6.8043 6217 1.1722 281 figures Hired Newly hired empl. (% of w orkforce) % 5.3351 1.6878 10.0585 6181 2.9135 279 Fired N ewly fired empl. (% of w orkforce) % 5.7566 2.7027 10.2008 6194 5.352 278 F urther W omen F emale emplo y ees (% of w orkforce) % 41.9446 39.4582 28.7807 6191 32.3692 277 charac-In v estmen t Quota In v estmen ts (dev. b y sales) # 0.0922 0.0278 0.25 83 6068 0.0692 264 teristics W ork ers Council? Firm has w ork ers council? Dumm y 0.5808 1 0.4935 3263 0.9431 281 Exp orting? Firm e x p orts? Dumm y 0.2685 0 0.4432 6234 0.4413 281 This ta ble depicts sum mary statistics ab out the sample of firms analyzed in the presen t pap er. The sample includes all 6,234 firm-y ear observ ations within the IAB Establishmen t P anel, for whic h at least one v erifia ble sales forecast is a v ailable. F or further data corrections, please see section 4. T able 2: Summary Statistics II Legal F orm % Sector % Origin % F arming 1.99 Sc hlesw.-H. 2.39 P artnership 25.70 Energy 1.81 Ham burg 1.68 Limited 46.79 Industry 22. 62 Lo w er Sax. 6.79 Join t-Sto ck Comp. 6.43 Man ufact. 6.59 Bremen 2.46 Non-Profit 14.55 Construct. 8.23 North R h.-W. 12.90 State-Owned 6.53 T rade 12.79 Hesse 5.84 Logistics 3.6 9 Rhineland-P . 3.17 Finance 3.53 Baden-W uert 8. 40 Services 27.7 3 Ba v aria 8.51 Organiz. 3.14 Saarland 1.74 Administr. 7.88 Berlin 6.32 Branden b. 7.66 Mec klen b.-W. 7.33 Saxon y 7.84 Saxon y-Anh. 7.94 Th uringia 7.73 This table sums up the firms’ legal forms, sectors and states of orig in.
Table 3: Forecast Errors
Mean StD P25 Median P75 Obs.
PFE (whole sample) -5.577*** 42.2345 -11.6071 -0.3078 9.7007 6234 PFE (joint-stock comp). -6.1306 39.5053 -12.7918 -1.0379 8.6666 2511 Mean PFE (whole sample) -1.5726*** 29.5955 -6.8682 1.9608 9.3364 281 APFE (whole sample) 20.5031 37.3418 4.6089 10.8681 23.6782 6234
Year 1993 1994 1995 1996 1997
Mean PFE -5.6446*** -6.1334*** -0.7376 -4.6641*** -8.7923*** Obs. 911 907 827 1963 1626
*: p<0.1; **: p<0.05; ***: p<0.01; P-values refer to t-tests testing whether the mean is equal to zero. This table evaluates (1) the percental forecast errors (PFE) of the whole sample, (2) the PFEs of joint-stock companies only, (3) all firms’ (weight-corrected) mean forecast errors, (4) all firms’ absolute forcast errors (APFE) and (5) the disaggregated yearly PFEs. See sections 2 and 5 for a description of the mathematical concepts.
Table 4: Regression Results
Column (1) (2) (3) (4) (5) (6) (7) (8) Model LOGIT PROBIT OLS BE LOGIT PROBIT OLS BE Category Variable Dummy Dummy PFE APFE Dummy Dummy PFE APFE
Size W orkf orceit 0.0000 0.0000 0.0004 0.0003 0.0000 0.0000 0.0004 0.0004
(0.6445) (0.6318) (0.1201) (0.5353) (0.8347) (0.8242) (0.1277) (0.4524) Salesit 0.0000 0.0000 0.0000 0.0000 0.0000 0.0000 -0.0001 -0.0001 (0.5286) (0.5062) (0.4209) (0.8929) (0.8287) (0.8368) (0.2823) (0.7709) Situation Sales 0.0024** 0.0014*** 0.0740*** 0.0866*** 0.0032*** 0.0019*** 0.0614*** 0.0684*** Growthit (0.0103) (0.0064) (0.0004) (0.0000) (0.0069) (0.0037) (0.0028) (0.0000) Sector -0.0215 -0.0132 -0.5667 -0.0520 -0.0316 -0.0196 -0.6411 -0.4307 Growthjt (0.4308) (0.4335) (0.2705) (0.9335) (0.2704) (0.2714) (0.2176) (0.4146)
Age <1960 (base) (base) (base) (base) (base) (base) (base) (base) (base) (base) (base) (base) (base) (base) (base) (base) >1959 & 0.0433 0.0266 -1.7463 -0.9703 -0.0512 -0.0266 -5.4791 -4.9241 <1991 (0.8810) (0.8821) (0.7764) (0.8686) (0.8688) (0.8886) (0.3816) (0.3140) 0.0862 0.0547 1.1883 1.9735 0.0814 0.0526 -0.2210 0.3627 >1990 (0.5364) (0.5277) (0.5824) (0.5301) (0.5853) (0.5699) (0.9152) (0.8918) Form Partnership 0.0395 0.0249 3.6660* 3.3982 0.0207 0.0126 2.9700 2.8068 (0.6998) (0.6972) (0.0671) (0.1082) (0.8622) (0.8650) (0.1763) (0.1560) Limited (base) (base) (base) (base) (base) (base) (base) (base)
(base) (base) (base) (base) (base) (base) (base) (base) Joint-Stock 0.5223*** 0.3231*** 3.7955* 3.5131 0.5124*** 0.3150*** 1.2787 0.5570 (0.0014) (0.0013) (0.0743) (0.2834) (0.0046) (0.0046) (0.5649) (0.8467) State-Owned -0.0501 -0.0334 2.2310 2.4432 -0.0110 -0.0092 3.8404 3.3374 (0.7472) (0.7287) (0.4684) (0.4516) (0.9520) (0.9352) (0.1268) (0.2720) Other 0.1159 0.0721 -1.1748 -0.1172 0.2258 0.1413 2.7369 2.9047 (0.5319) (0.5345) (0.7776) (0.9760) (0.2639) (0.2615) (0.3998) (0.3885) Further W omenit -0.0016 -0.0010 -0.0776** -0.0815*** Key 0.3942 0.3836 0.0408 0.0083 Figures Investit -0.7052*** -0.4157*** -5.0189* -5.1176** (0.0075) (0.0046) (0.0996) (0.0296) V acantit 0.0019 0.0012 0.0918 0.0733 (0.7273) (0.7214) (0.2454) (0.4054) Hiredit -0.0035 -0.0021 -0.0744 -0.0560 (0.4339) (0.4458) (0.4018) (0.4270) F iredit 0.0036 0.0022 0.0951 0.0675 (0.4281) (0.4269) (0.3181) (0.3387) AvW ageit -0.0038 -0.0023 0.0738 0.0673 (0.4650) (0.4716) (0.3823) (0.4361) W agecostit -0.0061** -0.0038** -0.2317*** -0.2379*** (0.0240) (0.0214) (0.0002) (0.0000) Control- Councilit 0.0513 0.0297 2.1668 2.4912 Dummies (0.6503) (0.6721) (0.2088) (0.1758) Exportit 0.0788 0.0511 2.0302 1.3575 (0.5574) (0.5403) (0.3280) (0.5342)
Further Years Yes Yes Yes Yes Yes Yes Yes Yes
Control- Sector Yes Yes Yes Yes Yes Yes Yes Yes
Dummies State Yes Yes Yes Yes Yes Yes Yes Yes
Constant 0.0938 0.0584 -9.5173 -10.1786 0.3111 0.1917 1.6722 1.5562 (0.7778) (0.7784) (0.2199) (0.1411) (0.4275) (0.4334) (0.8224) (0.8100) Obs. 2975 2975 2989 2989 2592 2592 2606 2606 R2 0.0246 0.0272 0.0505 0.0535 Pseudo R2 0.0238 0.0237 0.0325 0.0323 p-values in brackets; *: p<0.1; **: p<0.05; ***: p<0.01 This table presents the regression results. The logit and probit models in columns 1,2, 5 and 6 are carried out with clustered standard errors and estimate the probability that a forecast is too optimistic. The OLS regressions in columns 3 and 7 (which compute clustered standard errors as well) and the between-effects panel regressions in columns 4 and 8 use the firms’ PFE, respectively mean PFE, as dependent variable.
PREVIOUS DISCUSSION PAPERS
40 Müller, Hans Christian, Forecast Errors in Undisclosed Management Sales Forecasts: The Disappearance of the Overoptimism Bias, December 2011.
39 Gu, Yiquan and Wenzel, Tobias, Transparancy, Entry, and Productivity, November 2011.
Forthcoming in: Economics Letters.
38 Christin, Clémence, Entry Deterrence Through Cooperative R&D Over-Investment, November 2011.
37 Haucap, Justus, Herr, Annika and Frank, Björn, In Vino Veritas: Theory and Evidence on Social Drinking, November 2011.
36 Barth, Anne-Kathrin and Graf, Julia, Irrationality Rings! – Experimental Evidence on Mobile Tariff Choices, November 2011.
35 Jeitschko, Thomas D. and Normann, Hans-Theo, Signaling in Deterministic and Stochastic Settings, November 2011.
Forthcoming in: Journal of Economic Behavior and Organization.
34 Christin, Cémence, Nicolai, Jean-Philippe and Pouyet, Jerome, The Role of Abatement Technologies for Allocating Free Allowances, October 2011.
33 Keser, Claudia, Suleymanova, Irina and Wey, Christian, Technology Adoption in Markets with Network Effects: Theory and Experimental Evidence, October 2011. 32 Catik, A. Nazif and Karaçuka, Mehmet, The Bank Lending Channel in Turkey: Has it
Changed after the Low Inflation Regime?, September 2011.
Forthcoming in: Applied Economics Letters.
31 Hauck, Achim, Neyer, Ulrike and Vieten, Thomas, Reestablishing Stability and Avoiding a Credit Crunch: Comparing Different Bad Bank Schemes, August 2011. 30 Suleymanova, Irina and Wey, Christian, Bertrand Competition in Markets with
Network Effects and Switching Costs, August 2011.
Published in: B.E. Journal of Economic Analysis & Policy, 11 (2011), Article 56.
29 Stühmeier, Torben, Access Regulation with Asymmetric Termination Costs, July 2011.
28 Dewenter, Ralf, Haucap, Justus and Wenzel, Tobias, On File Sharing with Indirect Network Effects Between Concert Ticket Sales and Music Recordings, July 2011. 27 Von Schlippenbach, Vanessa and Wey, Christian, One-Stop Shopping Behavior,
Buyer Power, and Upstream Merger Incentives, June 2011.
26 Balsmeier, Benjamin, Buchwald, Achim and Peters, Heiko, Outside Board Memberships of CEOs: Expertise or Entrenchment?, June 2011.
25 Clougherty, Joseph A. and Duso, Tomaso, Using Rival Effects to Identify Synergies and Improve Merger Typologies, June 2011.
24 Heinz, Matthias, Juranek, Steffen and Rau, Holger A., Do Women Behave More Reciprocally than Men? Gender Differences in Real Effort Dictator Games, June 2011.
Forthcoming in: Journal of Economic Behavior and Organization.
23 Sapi, Geza and Suleymanova, Irina, Technology Licensing by Advertising Supported Media Platforms: An Application to Internet Search Engines, June 2011.
Published in: B. E. Journal of Economic Analysis & Policy, 11 (2011), Article 37.
22 Buccirossi, Paolo, Ciari, Lorenzo, Duso, Tomaso, Spagnolo Giancarlo and Vitale, Cristiana, Competition Policy and Productivity Growth: An Empirical Assessment, May 2011.
21 Karaçuka, Mehmet and Catik, A. Nazif, A Spatial Approach to Measure Productivity Spillovers of Foreign Affiliated Firms in Turkish Manufacturing Industries, May 2011.
Forthcoming in: The Journal of Developing Areas.
20 Catik, A. Nazif and Karaçuka, Mehmet, A Comparative Analysis of Alternative Univariate Time Series Models in Forecasting Turkish Inflation, May 2011.
Forthcoming in: Journal of Business Economics and Management.
19 Normann, Hans-Theo and Wallace, Brian, The Impact of the Termination Rule on Cooperation in a Prisoner’s Dilemma Experiment, May 2011. Forthcoming in: International Journal of Game Theory.
18 Baake, Pio and von Schlippenbach, Vanessa, Distortions in Vertical Relations, April 2011.
Published in: Journal of Economics, 103 (2011), pp. 149-169.
17 Haucap, Justus and Schwalbe, Ulrich, Economic Principles of State Aid Control, April 2011.
Forthcoming in: F. Montag & F. J. Säcker (eds.), European State Aid Law: Article by Article Commentary, Beck: München 2012.
16 Haucap, Justus and Heimeshoff, Ulrich, Consumer Behavior towards On-net/Off-net Price Differentiation, January 2011.
Published in: Telecommunication Policy, 35 (2011), pp. 325-332.
15 Duso, Tomaso, Gugler, Klaus, Yurtoglu, Burcin B., How Effective is European Merger Control? January 2011.
Published in: European Economic Review, 55 (2011), pp. 980‐1006.
14 Haigner, Stefan D., Jenewein, Stefan, Müller, Hans Christian and Wakolbinger, Florian, The First shall be Last: Serial Position Effects in the Case Contestants evaluate Each Other, December 2010.
Published in: Economics Bulletin, 30 (2010), pp. 3170-3176.
13 Suleymanova, Irina and Wey, Christian, On the Role of Consumer Expectations in Markets with Network Effects, November 2010 (first version July 2010).
Forthcoming in: Journal of Economics.
12 Haucap, Justus, Heimeshoff, Ulrich and Karaçuka, Mehmet, Competition in the Turkish Mobile Telecommunications Market: Price Elasticities and Network Substitution, November 2010.
Published in: Telecommunications Policy, 35 (2011), pp. 202-210.
10 Dewenter, Ralf and Kruse, Jörn, Calling Party Pays or Receiving Party Pays? The Diffusion of Mobile Telephony with Endogenous Regulation, October 2010.
Published in: Information Economics and Policy, 23 (2011), pp. 107-117.
09 Hauck, Achim and Neyer, Ulrike, The Euro Area Interbank Market and the Liquidity Management of the Eurosystem in the Financial Crisis, September 2010.
08 Haucap, Justus, Heimeshoff, Ulrich and Luis Manuel Schultz, Legal and Illegal Cartels in Germany between 1958 and 2004, September 2010.
Published in: H. J. Ramser & M. Stadler (eds.), Marktmacht. Wirtschaftswissenschaftliches Seminar Ottobeuren, Volume 39, Mohr Siebeck: Tübingen 2010, pp. 71-94.
07 Herr, Annika, Quality and Welfare in a Mixed Duopoly with Regulated Prices: The Case of a Public and a Private Hospital, September 2010.
Published in: German Economic Review, 12 (2011), pp. 422-437.
06 Blanco, Mariana, Engelmann, Dirk and Normann, Hans-Theo, A Within-Subject Analysis of Other-Regarding Preferences, September 2010.
Published in: Games and Economic Behavior, 72 (2011), pp. 321-338.
05 Normann, Hans-Theo, Vertical Mergers, Foreclosure and Raising Rivals’ Costs – Experimental Evidence, September 2010.
Publishedin: The Journal of Industrial Economics, 59 (2011), pp. 506-527.
04 Gu, Yiquan and Wenzel, Tobias, Transparency, Price-Dependent Demand and Product Variety, September 2010.
Published in: Economics Letters, 110 (2011), pp. 216-219.
03 Wenzel, Tobias, Deregulation of Shopping Hours: The Impact on Independent Retailers and Chain Stores, September 2010.
Published in: Scandinavian Journal of Economics, 113 (2011), pp. 145-166.
02 Stühmeier, Torben and Wenzel, Tobias, Getting Beer During Commercials: Adverse Effects of Ad-Avoidance, September 2010.
Published in: Information Economics and Policy, 23 (2011), pp. 98-106.
01 Inderst, Roman and Wey, Christian, Countervailing Power and Dynamic Efficiency, September 2010.
ISSN 2190-9938 (online) ISBN 978-3-86304-039-0