Multi-homing in the Apple Ecosystem:
Why and How Developers Target Multiple Apple App Stores
Andrei Idu, Tommy van de Zande, Slinger Jansen
Department of Information and Computing Science Utrecht University
Utrecht, The Netherlands
{a.idu, t.jacobusmeergenaamdvandezande, slinger.jansen}@uu.nl
ABSTRACT
The Apple ecosystem is divided into three sub-ecosystems: iPhone, iPad and Mac. This paper analyses the behav-ior of companies that target more than one of these sub-ecosystems, aptly named multi-homers, using statistical anal-ysis and a short survey. The set of companies analyzed is composed of the publishers of the top 300 free and paid ap-plications within the three ecosystems’ App Stores in May 2011. Findings showed that there is a strong relationship be-tween the number of platforms a company targets and the type of applications it publishes and the number of these applications. The most encountered trend was of first tar-geting the iPhone platform and then the iPad. Multi-homing from a strategic perspective is motivated mainly by a wider customer base and the portability the Apple sub-ecosystems offer.
Categories and Subject Descriptors
K.1 [Computing Milieux]: The Computer Industry— Mar-kets
General Terms
Management, EconomicsKeywords
Software Ecosystems, App Store, Multi-homing
1.
INTRODUCTION
Software ecosystems (SECOs) have created new oppor-tunities for software companies. Acting as SECO partici-pants, these companies are able to develop software based on an open platform provided by a SECO orchestrator [4]. However, for these companies it is of strategic importance to understand the SECO in which they exist [12]. They are dependent on an orchestrator for a vital infrastructure such as operating systems, libraries, component stores, and plat-forms [9]. A practice that poses an even more complicated
Permission to make digital or hard copies of all or part of this work for personal or classroom use is granted without fee provided that copies are not made or distributed for profit or commercial advantage and that copies bear this notice and the full citation on the first page. To copy otherwise, to republish, to post on servers or to redistribute to lists, requires prior specific permission and/or a fee.
MEDES’11November 21-24, 2011, San Francisco, USA Copyright 2011 ACM 978-1-4503-1047-5/10/10 ...$10.00.
strategic challenge is the fact that an increasing number of companies are active in more than one SECO. Data from as early as 2004 [2] showed this practice of “multi-homing” software companies developing software products for multi-ple platforms.
Apple currently has three different software platforms, for which it provides an App Store. These App Stores are gov-erned in a similar, tightly controlled and organized way, but they serve different platforms: the iPhone App Store for their mobile phones, the iPad App Store for their tablets and the Mac App Store for their personal computers, which are considered sub-ecosystems of the overall ‘Apple ecoys-tem’.
The iPhone App Store launched in July 2008. As of July 2011, there are more than 377.000 apps available in the iPhone App Store1. The iPad App Store launched together with the introduction of the first iPad, in April 2010. As of July 2011, there are 107.000 apps available for the iPad1. The latest App Store Apple launched is the Mac App Store, which launched in January 2011. As of July 2011, more than 5600 apps were available1.
Distimo B.V. is a Dutch company that provides monthly reports presenting interesting statistics about current ex-isting App stores, such as the Android App Store and the Apple App Stores. In their February 2011 report, they elab-orate on the three different Apple App stores [5]. The report shows that while there are publishers that create their apps for just one of these platforms, others target two or even all three of these App Stores. This paper looks at the reasons behind these strategic choices of crossing the boundaries at a software ecosystem level [9]. This brings us to the following research question:
How do multi-homers behave and what motivates them to develop applications for multiple app stores?
This research question is divided in the following sub-questions:
• Is there a relation between the type of application and the number of platforms it targets?
• Is there a relation between the size of the publisher and the number of platforms it targets?
• Is there a relation between the first platform a pub-lisher targeted and the second platform it targeted?
• Why do publishers make these choices? 1
The practical contribution of this research is to provide insight into the motivations of other multi-homers that sup-ports publishers in developing a portfolio road-map, choos-ing what ecosystems to target, and when. To the authors’ knowledge, this research path has not been pursued in exist-ing scientific literature, and even though the research ques-tions seem to have an obvious answer, this paper offers val-idation to these answers through a scientific study. There-fore, as a scientific contribution to the field of software ecosys-tems, the results of this paper provides insights in the behav-ior of multi-homers identified through a scientific research method. Trends in multi-homers business decisions on an ecosystem level are identified as well as strategic factors that influence multi-homing behavior.
This section introduced the software ecosystem domain and the concept of multi-homing publishers. The Apple ecosystem was given as an example to illustrate the be-havior of such publishers. The remainder of the paper is structured as follows. Section 2 describes a literature study, which provides a theoretical background for the analysis of the characteristics and behavior of multi-homing publishers. In Section 3 the conducted research method is described. Section 4 presents the data that was gathered about the publishers that are active in more than one of the three Apple App Stores. In Section 5 an analysis of the data is presented together with the findings of the research. In Section 6 we discuss the limitations and threats to valid-ity. Finally, conclusions and proposed further research are presented in Section 7.
2.
RELATED LITERATURE
In the field of Software ecosystems research different def-initions are used [10, 1]. This research paper uses the defi-nition proposed by Jansen, Brinkkemper & Finkelstein [8]. They define a Software ecosystem as “a set of actors func-tioning as a unit and interacting with a shared market for software and services, together with the relationships among them. These relationships are frequently underpinned by a common technological platform or market and operate through the exchange of information, resources and arti-facts”. Based on this definition, the iPhone, iPad and Mac ecosystems are considered as sub-ecosystems of the larger ‘Apple ecosystem’. Jansen at al. also talk about three dif-ferent scope levels that SECOs can have. These are the organizational scope level, the SECO scope level and the SECOs scope level.
A mix of the organizational level and the SECOs level has been discussed in literature by identifying participants of SECOs that are active in two or more SECOs at the same time. This behavior has been characterized in different manners based on the perspective of the analysis. Rochet & Tirole [11] call it multi-homing and state that it is de-rived from the consumer’s desire to take advantage of differ-ent functionalities in an environmdiffer-ent of non-interconnected platforms. The perspective in Rochet & Tirole’s research is market oriented [11], so their conclusion is that multi-homing appears when there are gains to be reaped from trade on incompatible or not interconnected platforms. The authors also explain that a multi-homing supplier will bene-fit from a greater potential market share that can be tapped into.
Boudreau [2] examines the “network effects” that an in-creasing number of buyers and suppliers around a platform
has. His study looks at mobile software developers on spe-cific platforms. Even though there is no mention of the term this is indeed a software ecosystem study. The inter-esting information in this paper is the fact that there were already multi-homing companies active between 2004 and 2007. Multi-homing software developing firms accounted for 1% of the data used by the research.
Burkard et al. (2011) analyze multi-homing in SaaS mar-ket places [3]. They base their research on Rochet & Tirole and mention the fact that SaaS providers sometimes employ multi-homing behavior by selling the same service on differ-ent platforms or marketplaces. This kind of behavior can be traced to the paper of Hagel, Brown & Davison [6] in which they call this type of participants hedgers. A hedger develops the same product for multiple platforms. The main benefit of being a hedger is that the business risk is spread in more markets, while the main drawback is that there are higher costs incurred when duplicating the effort for sup-porting multiple platforms.
Jansen et al. [8] mention a role that has similar attributes to multi-homers. The role is that of a “bridge” between dif-ferent SECOs. This kind of a SECO participant can trans-fer resources between ecosystems, however its main driver is providing connect-ability and not necessarily providing the same product for different ecosystems.
To summarize, existing literature provides different defi-nitions for the types of behavior or roles a participant that is active in more than one ecosystem can be classified as. These are: multi-homer, hedger or bridge. As a base for this research the term multi-homer is the most relevant. This is because the companies that are examined further provide either the same product or different related prod-ucts to different sub-ecosystems in the Apple ecosystems. The iPhone, iPad and Mac environments are considered sub-ecosystems because, based on the SECO definition, they provide different platforms and different markets for par-ticipants. However, they are sub-parts of the Apple ecosys-tem, because they share similar characteristics by having the same keystone player [7], having the same governance model with similar policies, using the same programming language, etcetera.
3.
RESEARCH METHOD
First, a literature study in the field of software ecosystems research was done. This created a theoretical background to base the analysis of the research results on. Emphasis was put on the strategic perspective for participants in software ecosystems and on the characteristics of the software ecosys-tem level [9]. Also, we studied and tried to unify the differ-ent terms used for companies which participate in multiple software ecosystems.
To answer the research question and sub-questions, a soft-ware tool was created to extract app and publisher data out of the different Apple App Stores. This tool was used to download several RSS-feeds provided by Apple, which in-cluded extensive data about the 300 most downloaded paid applications, as well as the 300 most downloaded free appli-cations of every US App Store. We based this research on data from the US App Stores because it currently has the most apps. The tool extracted relevant data, such as app ti-tle, publisher name, price, date first added and category, for every app from the RSS-feeds. This data was stored in sep-arate XML-files for every store. Data from these XML-files
Table 1: descriptive statistics of the dataset
Data N Max.Apps Mean Std.Dev. All 1060 44 1,6981 2,2038 No Games 761 23 1,474 1,415
was then combined and converted into CSV-files, so it could be loaded into SPSS, to perform statistical calculations on it in order to analyze the results. In the CSV-files, our tool counted the total number of apps per App Store for every publisher. Also, it stored the number of apps per category (23 in total, such as Social, News, Games etc.) per App Store, and the dates that the first app has been launched per App Store. All data was extracted on May 19th, 2011.
To evaluate the results, several publishers have been con-tacted to answer a small questionnaire to discover the rea-sons for their decisions. In this questionnaire, we asked pub-lishers in which stores they were currently active, in which store they started out, what were the strategic reasons for making these choices and if there were positive or negative effects after this behavior.
4.
RESULTS
The extraction of the App Store RSS-feeds, as described in the research method, resulted in a data-set of 1.060 differ-ent publishers, which had at least one top 300 app in one of the three App Stores. The total number of apps published by these publishers was 1.800. Most publishers (70,8%) have only one app in one of the three App Stores. The biggest publisher (Electronic Arts) has 44 different apps in the three App Stores. The average number of applications per pub-lisher (mean) is 1,698, with a standard deviation of 2,203.
A large part of publishers in the App Stores (28%) consists of game publishers. It is important to also look at the results without taking game publishers into account, since these game publishers could distort the results for other types of publishers. When all game publishers are filtered out of the data-set, the remaining number of publishers is 761. Most of them still have only one app in total (74,8%). The biggest non-game publisher (Apple) has 23 apps over all three App Stores. The average number of applications per publisher is 1,474 with a standard deviation of 1,415. These descriptive statistics are summarized in table 1
4.1
Store and Category characteristics
In Apple’s App stores, each application is placed into one of 23 categories. For example, there are separate categories for apps that relate to business, education, navigation and music. As noted before, the Games category is the dominant category in each store. Games account for 284 apps of the total 600 iPhone apps, while on both the Mac and iPad App Store, games account for 197 of the 600 apps of those platforms.
When looking at the popularity of categories on the dif-ferent platforms excluding games, we see that there is a clear difference in category Popularity over the different plat-forms. The category Productivity is, with 87 applications, the most popular category on the Mac. On the iPad, Pro-ductivity is the third most popular application category and on the iPhone it is the 8th most popular type. The most popular type of applications on the iPhone and iPad are in
Book
Business Developer Tools Education Entertainment Graphics & Design
Healthcare & Fitness Lifestyle Music News Photography Productivity Reference Social Networking Utilities 0 10 20 30 40 50 60 70 80 90
Mac iPhone iPad
Figure 1: Combination of fifteen most popular cat-egories on each platform
Table 2: Top 10 largest Multi-Homers
Position Name Apps Stores
1 Electronic Arts 44 iPad, iPhone
2 Apple 23 All three
3 Outfit7 22 iPad, iPhone
4 Gameloft 21 All three
5 EnsenaSoft 15 iPad, Mac
6 G5 Entertainment 14 All Three 7 Rovio Mobile Ltd. 12 All Three 8 Chillingo Ltd. 12 All Three
9 PopCap Games 10 All Three
10 Backflip Studios 10 All Three
the Entertainment category, where on the Mac App Store this application category is ranked 9th. Figure 1 gives on overview of the fifteen most popular categories per platform combined, and their respective number of application per store.
4.2
Multi-Homers
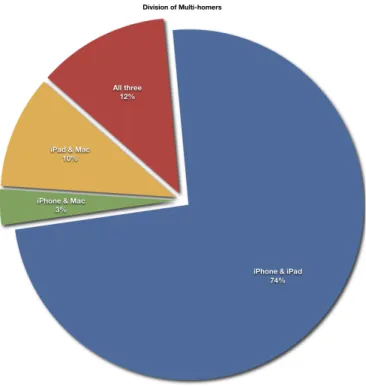
In total, 182 publishers publish an application in at least two stores (for example one app in the Mac App Store and one in the iPad App Store). 93 of these 182 publishers (51%) have an even amount of apps in both the iPhone App Store and iPad App store. 22 publishers have one or more apps in all three App Stores. In figure 2, a pie chart shows the division of multi-homers in the Apple ecosystem. As this chart shows, most multi-homers publish only in the iPhone and iPad App stores (74%), 12% publishes at least one app in all three stores, while 10% targets the iPad and Mac stores and 3% combines the iPhone and Mac App Stores.
Table 2 shows the top 10 largest multi homers, counted by how much total apps they have over all three ecosystems. Most of these publishers produces games. Note that the second largest multi-homer is Apple itself. They produce productivity apps, such as the iWork suite, and utility apps, such as the Remote app, to remotely control iTunes music. Most large multi-homers publish in all thee stores.
Figure 2: Pie chart showing the division of multi-homers over the different platforms
5.
ANALYSIS
In the previous section, interesting observations from the App Store and its publishers were extracted from the dataset. In this section, we will answer the actual research questions, by analyzing the results and calculating the correlation be-tween several characteristics. The final sub-question, if there are specific reasons behind the choices publishers make, will be answered by analyzing survey responses.
Is there a relation between the type of
applica-tion and the number of platforms it targets?
As we have seen in the previous section, there are differ-ences in the popularity of certain app categories on different platforms. Games are the most popular category on every platform, but Productivity apps are second most popular on Mac, while these types of apps are far less popular on iPhone and iPad.Looking back at Figure 1, some categories have a large number of apps on two platforms, but far less on another platform. For example, the entertainment category, has 66 apps on the iPhone and 61 on the iPad, but only 17 on the Mac. Some categories, such as books, are even non existent on the Mac, while they are present on both the iPhone and iPad stores. On the other hand, Productivity has 87 apps on the Mac, 50 on the iPad but only 15 on the iPhone. As men-tioned before, the most popular category on all platforms is the Games category.
It is clearly observable that there is a relation between the type of platform and the popularity of a few specific categories, however, other categories are about evenly dis-tributed among the three platforms.
Table 3: SPSS output of the correlation between publisher size and number of stores it targets
Is there a relation between the size of the
pub-lisher and the number of platforms it targets?
A logical assumption is that the size of the publisher cor-relates with the number of apps on different platforms. To compute the correlation between the number of stores a pub-lisher targets and its size, we counted the number of apps in all stores for every publisher in the data-set. We defined size of a publisher as the total number of apps it provides over all three stores. Table 3 presents the result of this computation. With a correlation coefficient of 0,524, there is a significant correlation between the size of a publisher and the number of platforms it targets. However, it is not a perfect correlation. There are still large publishers who do not target all three stores. One example is Electronic Arts. It is the biggest publisher in number of total apps, but it only targets the iPhone and iPad App stores.Is there a relation between the first platform a
publisher targeted and the second platform it
targeted?
For most publishers, the iPhone platform was the first plat-form that they targeted. This is not because of any strate-gic reasons, the iPhone App Store was simply the first App Store available. It seems a logical choice to also create an iPad app when the platform launched, since it requires rel-atively low effort (Apps are built using the same language, same SDK, same APIs etc.). However, looking at the signif-icant differences in the number of available apps among the stores, it seems that most publishers still only launched an iPhone app.
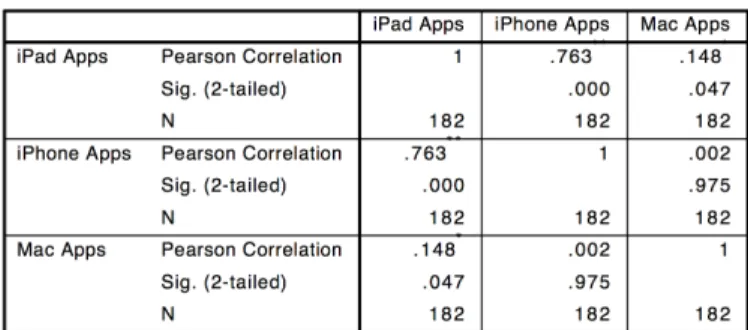
When looking at the relation between a first platform and a second platform, it is important to first look if there is a correlation between any of the platforms at all. We have calculated Pearson’s correlation coefficient for all possible combinations, with all publishers who have an app in at least two different stores. Those combinations are the cor-relation between number of iPhone and iPad apps per pub-lisher, iPhone and Mac apps per publisher and iPad and Mac apps per publishers.
Table 4 presents the SPSS output for the correlation coef-ficients between the number of apps in the different stores. The correlation coefficient between the number of iPhone apps and the number of iPad apps is 0,763, so there is a sig-nificant correlation between the number of iPhone apps and the number of iPad apps that a publisher has. The correla-tion coefficient between the number of iPad and Mac apps is low, but still significant: 0,148. There is a correlation,
Table 4: SPSS output of the correlation between stores
but it is not strong. The correlation between the number of iPhone apps and the number of Mac apps per publisher is low: 0,002. There is no significant correlation between the number of iPhone and Mac apps.
When looking at the first and second platform publish-ers target, it also shows the strong correlation between the iPhone and iPad apps. 72 out of the 135 publishers that have both an iPhone and iPad app, launched their iPhone app first and then later launched an iPad app, while only 15 publishers did it the other way around: they launched an iPad app before they launched an iPhone app. Interesting to note is that 48 of the 135 publishers (35%) launched both their iPhone and iPad app on the same day. These apps are so-called universal apps; apps that run on both plat-forms. They are present on both stores, but are technically the same app and therefore share the same launch date.
Of the 19 publishers active on both the iPad and Mac, 16 have launched their iPad app before they launched their Mac app. The remaining three have launched a Mac app before they launched an iPad app. The multi-homers who have an app on only the iPhone and Mac App Store, all six have first created their iPhone app, before they launched a Mac App.
In total, 22 publishers have apps in all three stores. Of those 22 publishers, 10 publishers have first developed an iPhone app, then an iPad app and finally a Mac app. Two publishers have first launched their iPad app, then their iPhone app and later their Mac app. Eight publishers launched their iPhone and iPad apps at the same day (universal app) and later launched a Mac app. The remaining two publish-ers first created an iPhone app, then a Mac app and later an iPad app.
A logical conclusion as to why publishers target the iPhone ecosystem first, is that it has existed longer. However, when considering only the multi-homing publishers that have launched their first app on or after the launch of Mac App store (which is the most recently launched store, on the December 9th, 2010), we notice somewhat similar behavior. Unfortunately the set of multi-homing publishers that launched their apps after the launch of the Mac App Store was quite low at the time of data extraction.
In total 27 publishers that launched their first app after 12/09/2010 have an app in more than one store. Three of those 27 publishers published their Mac app first, and later launched an iPad app. 20 out of the 27 publishers (74%) launched their iPhone and iPad app at the same day. As
explained before, this usually implies that it is a universal app. Note that this is a large increase compared to when considering all launch dates. The four remaining publishers published an iPhone app first. Two of them later launched a Mac app, and two later launched an iPad app.
Summarizing, the iPhone platform is often the platform of choice for a new entrant in the Apple ecosystem. If the developer desires to target another App Store next to the iPhone, in most cases it will be the iPad App Store. If a publisher does not create an iPhone app, it most often first creates an iPad app and later a Mac app. The other way around, from a Mac app to an iPhone or iPad app, is rare. When only considering apps that have been launched after all three App Stores were available, we see a somewhat similar behavior, however publishers tend to focus more on universal apps.
Why do publishers make these choices?
Out of all 182 multi-homers found in the data set, 30 were contacted to answer a short questionnaire about the reasons behind their multi-homing behavior. The reason for con-tacting only a few of the publishers is the fact that contact data was not available in the data set extracted from the App Stores. Thus, gathering contact data had to be done manually, which was a labour intensive task. The publishers were chosen based on the number of apps they had in the stores. Even though the response rate was low, 13%, time constraints did not permit for contacting more publishers. Despite this, the responses to the questionnaire provide in-teresting insights into the reasons behind the behavior that was observed from the App Store data and confirm the sta-tistical findings.
The respondents were all active in the iPhone and iPad ecosystems, with only one publisher being active in the Mac ecosystem as well. All respondents to the questionnaire listed a wider potential customer base as the main reason for targeting more than one platform. One respondent ac-tive in both the iPhone and iPad ecosystems stated that it did not target only the iPhone because“the iPad represents a significant number of [additional] users, as well as revenue”. Targeting a new platform does not only bring new customers into reach it also includes potential sales to the same cus-tomers that have more than one Apple product. Companies believe most Apple users own more than one Apple product. Another strategic factor for targeting more than one plat-form is the fact that using the same programming language for all platforms makes it easy to port an application from one platform to another. Developer resources are mainly used for one platform with less than a quarter of these re-sources being used for a different platform.
Also mentionable is the fact that companies see that a few specific categories of apps are more popular on a platform. For example the iPad has been observed to be used more in enterprises and so Productivity applications are more popu-lar on this platform than on the other portable platform, the iPhone. This confirms the statistical analysis per category that we presented earlier.
From the perspective of related benefits and negative ef-fects of multi-homing there is a general opinion that cus-tomers of the Apple ecosystem view the three sub-ecosystems without strict boundaries. On the positive side, targeting a new platform will increase sales for an existing product on a different platform. This is enhanced by efficient
cross-platform promotion of the products. On the negative side, however, users see a product that is available on more plat-forms as the same piece of software and expect it to behave in the same manner. A respondent gave the example of a “Tips Guide” for the iPhone app:“the content of which covers only the iPhone, but by being an universal app, some customers thought it would also cover the iPad”. Another issue is that negative reviews on one platform will have effects on the other platforms as well, for example, one respondent stated that there is a“risk that bugs or design decisions in one ver-sion will result in poor user reviews that will be shown to the users of the other platform”. There is also a tendency from users to compare the portable platforms to the Mac plat-form, in this case Mac applications are seen as over priced even though they do require more effort and resources than their simpler and smaller portable versions.
Summarizing, multi-homing from a strategic perspective is motivated mainly by a wider customer base and the porta-bility the Apple sub-ecosystems offer. This behaviour is ob-served to bring higher sales, however there is also the risk that a product inherits the same (potentially bad) reputa-tion on all platforms it targets.
6.
DISCUSSION
Even though the data set used for this research was large and detailed enough to perform relevant statistical compu-tations, there are limitations posed by the collection method used and sample data that was gathered.
The first limitation is that the population consists only of the top 300 popular free and top 300 paid applications in each of the App Stores at a certain moment in time. Pub-lishers could be in the top 300 only on one of the three plat-forms even though they do publish in more than just one App Store. These occurrences were omitted by the method used to collect data, thus making the data have a certain degree of incompleteness. Another limitation incurred be-cause of the collection method is the fact that the selection of publishers was not random. The selection was based on popularity. The rationale behind this choice to consider only the top 300 most popular applications, was that this was the only App Store data that was freely and publicly available. For further research in the Apple ecosystem it would be in-teresting to select publishers randomly in order to have a more representative data set, or perform the same tests on a dataset consisting of all the apps in the App Stores. How-ever, up until now we did not find a way to obtain this data. Lastly, the low response rate of the questionnaire, even though it provided important insights from the publishers’ perspective, does prevent us to conclude that these are the only reasons why publishers target multiple ecosystems.
Other limitations come from the fact that the concept of the App Store is relatively new. The Mac App Store launched less than a year ago, however there have been ap-plications for Mac before this. The market within the Apple ecosystem is continuously developing and evolving, so data from this research can quickly become obsolete.
7.
CONCLUSIONS
This paper analyzed the trends and characteristics of soft-ware companies within the Apple ecosystem and its three sub-ecosystems: iPhone, iPad and Mac. The focus of the analysis was on multi-homers within these ecosystems. A
multi-homer is a software publisher that offers products on more than one platform. The data-set that the research used was composed of the top 300 most popular free and 300 most popular paid applications in each of the three App Stores.
The results show that there is a relation between the cate-gory or type of application and the number of platforms that it targets. Apps categorized as Games are the most popular on all three platforms, while apps categorized as Books are only popular on iPhone and iPad and productivity apps are popular on Mac. Statistical correlation has shown that the number of apps a publisher has, correlates with the number of platforms it targets, however the large game-publisher Electronic Arts is an exception. It only targets iPhone and iPad while it is the publisher with the highest number of applications over all.
Focusing on the order which publishers use to target the ecosystems, the iPhone platform is usually the first platform a publisher targets. This does not only have to do with the fact that the iPhone was the first platform to have an App Store, because we used the current top 300 most popular paid and free apps. A better explanation is, probably, the market size of iPhone apps compared to iPad or Mac apps. Publishers that target more than one ecosystem usually pro-ceed by launching an iPad app after the introduction of their iPhone app.
Also observable was the fact that if publishers first target the iPad ecosystem the next to be targeted is usually the Mac ecosystem. When asked directly, multi-homing pub-lishers stated that targeting more potential customers and the high portability the three ecosystems offer were the main reasons for targeting more than one platform.
The findings of this paper enable better decision mak-ing for publishers in the Apple SECO. These findmak-ings show what the current overall behavior of multi-homers in the ecosystem is and also identify strategic benefits and risks that should be taken into account when adopting a multi-homing approach. This knowledge can be used by publishers to enhance their strategic analysis of the environment. The analysis could for example include iPhone, iPad and Mac order of approach based on app category. Competitors’ ac-tions can be anticipated regarding a multi-homing approach. Also, category niches in the different platforms can be identi-fied and targeted with a high quality app in order to quickly gain a strong position in the market.
Multi-homing is an interesting phenomenon. From a pub-lishers perspective, it helps to reduce dependency from one single ecosystem. It is favorable for platform providers such as Apple to encourage this behavior, because publishers tar-geting several ecosystems from the same platform provider have increased dependency on that single platform provider, making them less likely to move away.
To encourage multi-homing behavior, a platform provider should provide tools to help publishers adapt their existing apps for new ecosystems with as little effort as possible. Ap-ple already supplies such tools for iPhone to iPad transition. The transition from or towards a Mac app currently requires significantly more effort, as the APIs and user interface are completely different, however changes to the latest Mac OS X operating system suggests Apple is slowly trying to unify these differences.
As stated in the discussion section, further research in this area is necessary. A first direction would be to perform the same research on data-sets that are selected randomly, in
order to improve generalizability of the results. Also, re-sponses from more publishers should be gathered in order to better understand the different motivations behind their strategies. Another interesting aspect would be to look at the data from the App Stores in more than one moment in time in order to get a more detailed and accurate trend analysis. An approach to multi-homer behavior within other platforms could also be a cause for further research. For in-stance, multi-homers within the iPhone, Android and Win-dows Mobile ecosystems or multi-homers in the Mac and Windows ecosystems could be analyzed.
8.
REFERENCES
[1] J. Bosch. From software product lines to software ecosystems. InProceedings of the 13th International Software Product Line Conference, SPLC ’09, pages 111–119, Pittsburgh, PA, USA, 2009. Carnegie Mellon University.
[2] K. Boudreau. Too many complementors.SSRN eLibrary Working Paper Series, 943088, 2008. [3] C. Burkard, T. Draisbach, T. Widjaja, and
P. Buxmann. Software ecosystems: Vendor-sided characteristics of online marketplaces. InInformatik 2011 (forthcoming), 2011.
[4] P. Campbell and F. Ahmed. A three-dimensional view of software ecosystems. InProceedings of the Fourth European Conference on Software Architecture: Companion Volume, ECSA ’10, pages 81–84, New York, NY, USA, 2010. ACM.
[5] Distimo B.V. Insights into Apple’s app ecosystem: comparing Mac, iPad and iPhone. Whitepaper, February 2011. Retrieved from
http://www.distimo.com/wp-content/uploads/ 2011/03/Distimo-Publication-February-2011.pdf
[6] J. Hagel, J. Brown, and L. Davison. Shaping strategy in a world of constant disruption.Harvard Business Review, 86(10):80–89, 2008.
[7] M. Iansiti and R. Levien.The Keystone Advantage: What the New Dynamics of Business Ecosystems Mean for Strategy. Harvard Business School Press, Boston, MA, USA, 2004.
[8] S. Jansen, S. Brinkkemper, and A. Finkelstein. Business network management as a survival strategy: A tale of two software ecosystems. InProceedings of the First International Workshop on Software Ecosystems, IWSECO, pages 34–48, Falls Church, Virginia, USA, 2009. CEUR-WS.
[9] S. Jansen, A. Finkelstein, and S. Brinkkemper. A sense of community: A research agenda for software ecosystems. InSoftware Engineering-Companion Volume, 2009. ICSE-Companion 2009. 31st International Conference on, pages 187–190. IEEE, 2009.
[10] H. Kittlaus and P. Clough.Software Product Management and Pricing. Key Success Factors for Software Organizations.Springer-Verlag Berlin, Heidelberg, 2009.
[11] J. Rochet and J. Tirole. Two-sided markets: a progress report.The RAND Journal of Economics, 37(3):645–667, 2006.
[12] I. van den Berk, S. Jansen, and L. Luinenburg. Software ecosystems: a software ecosystem strategy assessment model. InProceedings of the Fourth European Conference on Software Architecture: Companion Volume, ECSA ’10, pages 127–134, New York, NY, USA, 2010. ACM.